 |
| About Bioline | All Journals | Testimonials | Membership | News |
|
||||||
|
||||||
African Crop Science Journal, Vol. 10. No. 1, 2002, pp. 111-120 SOCIOECONOMIC FACTORS ASSOCIATED WITH FINGER MILLET PRODUCTION IN EASTERN UGANDA M.M. Kidoido, V. Kasenge, S. Mbowa, J.S. Tenywa1 and Nyende1 Department of Agricultural Economics and Agribusiness, Makerere University,
Kampala, Uganda (Received 6 February, 2001; accepted 19 February, 2002) Code Number: cs02010 Abstract Finger millet (Eleusine coracana L.) is a major food security crop in Uganda, particularly in dry areas of the eastern and northern region. Unfortunately, yields are steadily declining at farm level and this coupled with lack of comprehension of factors responsible has provoked concern among farmers and research scientists. This study was conducted in eastern Uganda to establish the socioeconomic causes of millet yield decline. One fifty finger millet farmers were randomly selected and interviewed. A Cobb-Douglas production function was used to assess the critical socioeconomic factors influencing finger millet production. Seeding rate, labour, tools and equipment, production experience, and weed management were found to be the most constraining factors. Manure application, farmer-group involvement and ownership of draught power (oxen and ploughs) were also critical issues in the production of the crop. The future of the crop largely lies in addressing the factors that limit use of inputs and the integration of indigenous knowledge in finger millet production research and development. Key Words: Allocative efficiency index, Cobb-Douglas function, Eleusine coracana, marginal product RÉSUMÉ Le millet (Eleusine coracanal) est une plante importante pour la sécurité alimentaire, particulierement dans les régions sèches de l'est et du nord de l'Ouganda. Malheuresement les rendements sont entrain de décliner constament au niveau des fermes et ceci couplé avec le manque de compréhension des facteurs responsables ont provoqué un intéréssement parmi les fermiers et des scientifiques. Cette étude était conduite à l'est de l'Ouganda pour établir les facteurs socio-economiques de la dimunition des rendements. Cent cinquante fermiers étaient sélectionner au hazard et interviewés. La fonction de production de Cobb-Douglas était utilisée pour estimer les facteurs socio-economiques determinants la production du millet. Le taux des jeunes plantes, la main d'æuvre, les outils et équipements, l'expérience de production et le travail de désherbement étaient les facteurs les plus contraignants. L'application du fumier, la participation du groupe des fermiers et la possession des bêtes de trait puissants étaient aussi des problèmes critiques dans la production des plantes. L'avenir des plantes était largement liée à la résolution des facteurs qui limitent l'usage des intrants et l'intégration de connaissances indigènes dans la recherche et le développement du millet. Mots Clés: Indices d'allocation efficace, fonction de Cobb-Douglas, Eleusine coracana, produit marginal INTRODUCTION Food security is among the most outstanding socioeconomic challenges in Uganda. It is defined as a condition when all members of a given population can access sufficient food throughout the year to be able to live actively and maintain healthy life conditions (World Bank, 1986). In Uganda, although the area under cultivation has increased by 35% since 1996, the legacy of food insecurity and rapid population growth are serious socio-economic concerns (MFPED, 1999). For instance, food shortages are usually experienced in drought prone areas, such as eastern Uganda, where average annual rainfall is at 800-1000 mm (Tenywa et al., 1999). This scenario is probably attributed to national agricultural policies, which hitherto attached research priorities to cash crops with meagre attention to food crops. However, the current demographic trends and economic liberalisation framework require that research on food crops also takes a centre stage (MNR, 1994) to reconcile the growing need for adequate rural household nutrition with the increased food outflow into urban markets. Thus considerable research attention should be focussed on staple food crops in particular regions of the country, such as finger millet in eastern Uganda. Finger millet (eleusine coracana L.) is the second most important staple cereal crop in Uganda, after maize (Zea mays) (NARO, 1991). It is considered a vital food security crop, particularly in the eastern and northern regions (Oryokot, 1985). It is drought tolerant and, hence, is suitable for drought prone areas. The crop is known to have insignificant pest problems compared to other cereal crops (Shakya et al., 1991). It can be stored in granaries for more than 10 years without quality deterioration (Wasswa and Odelle, 1985). The grains are of high nutritional value and contain special amino acids namely, tryptophan, cystine, methionine and total amino acids. These amino acids are limited or lacking in many other cereals (Shakya et al., 1991). It can be utilised in various forms and is gradually capturing a niche in Uganda's market place. Its grain serves several intricate cultural roles, particularly in the form of local brew. Hence, local communities in the country attach a high value to this crop. Currently, the crop is grown on an estimated area of 420,000 hectares with an annual yield of 643,000 metric tonnes (Wasswa and Odelle, 1985). On-farm yields in eastern Uganda range from 400-800 kg ha-1 (Tenywa et al., 1999) compared to 2,500 kg ha-1 on-station (NEMA, 1996). In fact, yield trends over a 10-year period (1980-1999) display evidence of a growing gap between on-farm and on-station productivity (yield per unit area). Unfortunately causes responsible for this yield decline are largely unknown. Investigations were conducted to establish these causes, with a view to identify critical constraints that require research attention. As is probably the case with other crops, causes of yield decline are multi-faceted. In this paper, however, we report on socioeconomic causes of millet yield decline in eastern Uganda. The objective of this paper is, therefore, to present such results for eastern Uganda and attempts to expose the critical constraints that call for research intervention. METHODOLOGY The study was conducted in eastern Uganda, in three subcounties namely, Kanyum Agule and Namwiwa in the dictricts of Kumi, Pallisa and Kamuli, respectively. The data were collected during the period January, 1999 - February, 2000. The selection of the districts and, thereafter, the subcounties and villages was purposive. Sampling frames for finger millet producers of the selected villages were prepared and the names of household heads were written on cards and shuffled in a basin. The names were then rewritten and, using a population of four farmers per village, a skip interval was developed and used in the subsequent selection of 50 respondents per subcounty. A questionnaire was designed, pretested and administered during the survey. The thrust of the questionnaire was to determine the level of farm resource use, socio economic variables like labour, tools and implements, land ownership and management. Also included were the demographic variables like household characteristics. The data were entered in Excel spreadsheet and analysed using the Statistical Package for Social Scientists (SPSS). Descriptive statistics, and t-tests on mean differences were also performed. Linear regression of the Cobb-Douglas type of production function was adopted owing to its advantages, namely (i) adequate fit of data (ii) computational feasibility and (iii) permission of sufficient degrees of freedom for statistical testing (Doll and Orazem, 1984). The Cobb-Douglas production function was linearised through transformation into a double log (Equation 1). Ordinary least square (OLS) was used for estimating finger millet production function (Doll and Orazem, 1984). A double log-transformation was necessary to normalise the data for variables that had a positively skewed distribution. LnYi = C+b1LnLB + b2LnCP + b3LnLD + b4LnSEEDRT + b5LnFINEXP + b6DNW + b7DROTCAT + e ....... (Equation 1) Where: Yi = Finger millet yield (kg ha-1) LB = Labour (total family and hired labour, measured in person days; 1 person day = 6 adult working hours, 0.5 person day = 6 child working hours ). The increased use of labour is expected to have a positive effect on finger millet yield (Debertin, 1992). CP = Investment in farm tools and equipment, measured in Uganda shillings, as fractional annual linear depreciation on tools and equipment that are directly used in finger millet production (1,550 Ush = 1US$). Tools and equipment included hoes, sprayers, machetes, knives, rakes, gunny bags, ploughs, bicycles and oxen. Like capital, the increased use of tools and equipment in finger millet production should have a positive effect on finger millet yield. This is a result of increased labour use efficiency leading to faster accomplishment of activities (Gian, 1968). LD = Farm size (hectares). Lower land parcels force the farmers to encroach on marginal lands. This reduces soil productivity and increases soil erosion as a result of exposed large tracts of land under mono cropping (World Bank, 1986). SEEDRT = Seeding rate (kg ha-1). Broadcast seedlings are always exposed to high competition and to have a high survival rate many seedlings have to be established. Therefore, it requires a high seeding rate to establish a high finger millet plant population (Enserink, 1995) FINEXP = Farmer's experience in finger millet growing (years). The more years one spends growing a crop the more experienced such a farmer is empowered to manage various risks involved in the production of the crop (Tumutegyerereize et al., 1999). DNW = Weed pressure (0 = weeding once; 1 = weeding more than once). Weeds compete with finger millet for nutrients, water and other factors and, consequently, reduce crop yield (Tusiime et al., 1996). Frequency of weeding is a sign of weed pressure and weed effect on crop yield. DROWCAT = Rotation of finger millet fields with former cattle kraals sites (0=No, 1= yes). Rotation of finger millet fields in this manner is expected to increase finger millet yields because of nutrient enrichment from the manure productivity (Mudonderi et al., 1999). e = error term
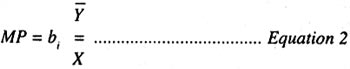
Where MP = marginal products; bi = the estimated coefficient; Y is the average yield; X is average input use. The efficient level of input use is defined by Equation 3:
Where: VMPx = Value of marginal product (MP multiplied by the
unit price of output); and Px = Unit price of input (Marginal Factor Cost).
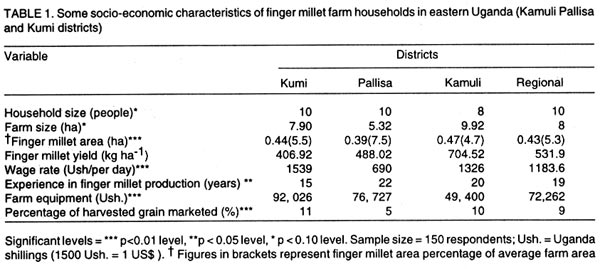
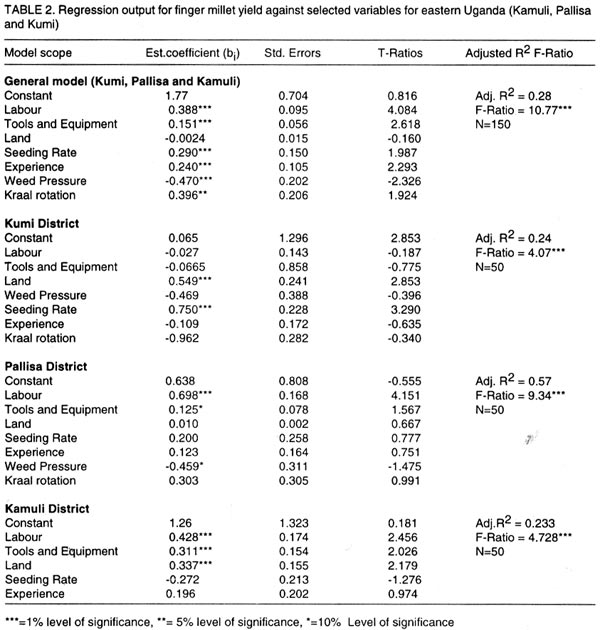
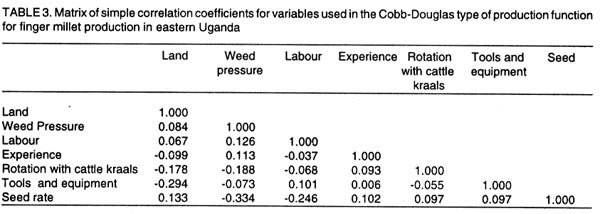
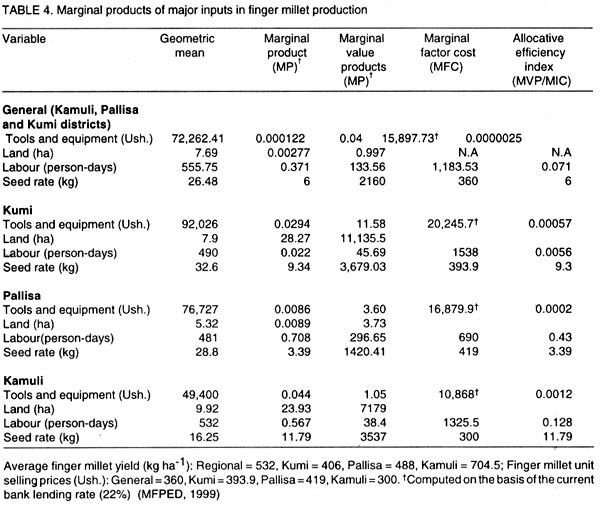
In this case, the condition RESULTS AND DISCUSSION Socioeconomic and biophysical profiles of eastern Uganda with respect to finger millet production. Data on socio-economic and demographic characteristics for the study region are presented in Table 1. Generally, the average finger millet production experience (in terms of years) was 19 years, but this varied significantly (P<0.05) between the districts. Farmers in Pallisa and Kamuli had more experience (20-22 years) as compared to farmes in Kumi (15 years). Average farm size for the three districts was 7.6 hectares and there was no significant difference. Despite the lack of a significant difference, farmers in Kamuli owned more land than those in Kumi and Pallisa districts. On average, land size in this region is markedly greater than that in the densely populated regions in Uganda such as the south-western, where as little as 0.2-2 ha are owned per household (Lindblade et al.,1998). Despite the relatively large hecterage owned by individual farmers in the region, area planted to finger millet covers only 0.43 ha (Table 1) and did not significantly differ (P<0.5) between the districts. This observation probably attributed to the labour intensive nature of this crop relative to other crops. Households largely depend on family labour, which has lately been constrained by the introduction of the Universal Primary Education (UPE) programme. This programme provides free education to at least four children per family. The other possible explanation to the above observation could be the farmers' desire for diversification of the food and cash crops base to guard against risks of crop failure. Table 1 presents data for finger millet productivity (yield per unit area) in the study region. Yield figures ranged from 400 to 700 kg ha-1. From available literature sources, these yields are very low compared to the region's research station yield average of 2,500 kg ha-1 (Esele, 1995; NEMA, 1996). Yield significantly differed (P<0.01) between districts, with Kamuli registering the highest (704.5 kg ha-1) and Kumi the lowest (406.92 kg ha-1). This yield range closely conforms to the figures reported earlier by Tenywa et al. (1999) during a rapid rural appraisal in the same region. On the other hand, the observed yields are lower than the national finger millet productivity average of 1,600 kg ha-1 previously reported by Wasswa and Odelle (1995). This disparity arises from the fact that the regional yields are very variable with regions such as western Uganda having relatively higher yield margins as compared to other areas. For instance Kabale is reported to yield as high as 2,000 kg ha-1 (NEMA, 1996). Thus, a computed national millet yield average will certainly be much higher than the lowest yields. It is, therefore, important that national statistics are disaggregated and interpreted objectively to avoid misleading generalisations that may lead to subjective development plans, especially for areas of marginal productivity. Wage rate data for finger millet production in eastern Uganda are presented in Table 1. The cost of labour significantly (P<0.01) varied among the districts. Pallisa had the cheapest (UShs. 690 per day per person) while Kumi had the highest (UShs. 1,539) labour costs. Wage values directly reflect labour availability (Pangali and Rosegrant, 1995), in which case Kumi is the most labour constrained district overall. Labour cost values are apparently in corroborate productivity values discussed above, in that Kumi district with the highest unit cost had the lowest productivity, while the other two districts with lower labour costs also produced the highest per unit area. This provides evidence that labour is a major bottleneck for productivity, especially in Kumi district. Generally, investment in farm tools and equipment was low and significantly (P<0.05) varied in the three districts (Table 1). However, farmers in Kumi and Pallisa districts invested more in these inputs than their counterparts in Kamuli district. There was general inadequacy of ox-ploughs in Kamuli, yet these are considered vital for crop production in the region. This, therefore, explains the lower aggregate values of farm equipment in this district, compared to Kumi and Pallisa where ox-ploughs are common among households. Eastern Uganda is not an exception as far as low use of inputs in crop production is concerned. Similar observations were reported for the whole country a couple of years ago (MNR, 1994). Only 9% of the finger millet produced is marketed directly (Table 1). The amounts sold to the market significantly varied (P<0.1) across the districts. Kumi recorded the highest amounts while Pallisa sold the least (5%). An uncertain portion of millet grain is used for local brew (Ajon or Malwa), which is sold for cash or exchanged for labour, particularly during peak weeding and harvesting periods. The remaining grain is stored in locally fabricated granaries and is gradually consumed by households. Considering the low hecterage under finger millet cultivation, in the region and the small fraction of the grain that ends up in the markets, it can be concluded that this crop is still at a low level of commercialisation. This inference is further strengthened by the over dependence on family labour (70%) by households during production, which Pangali and Rosegrant (1995) views as an indication of low level of commercialisation. This in turn reflects the level of commitment to and investment in the enterprise. The fraction of harvest retained is evidence for finger millet as a food security crop in the region. Weeding frequency and finger millet yields. As a result of high weed pressure, the crop is weeded twice in Pallisa (73% respondents) and Kumi (93% respondents). This has been associated with decline in soil fertility in the two districts compared to Kamuli district where only one time weeding was required (Oryokot, 1985). In fact, Kamuli farmers obtained significantly (P<0.05) higher yields (704.5 kg ha-1) than their counterparts in Pallisa and Kumi (465.7 kg ha-1). Nyende et al. (2001) evaluated soil fertility in the three districts and obtained higher soil fertility levels in Kamuli than in Pallisa and Kumi districts. Hence, the higher grain yields in Kamuli could be attributed to both higher soil fertility status and low weed pressure. Draught power for finger millet production. Land preparation is largely (90% respondents) by draught power (animal traction). However, approximately 15% of the households interviewed owned oxen and ploughs. The remaining households accessed these facilities through hiring. Generally, farmers who owned draught power facilities also had larger fields (0.52 ha) under finger millet production and obtained significantly (P<0.05) higher yields (720 kg ha-1) than those who hired (0.4 ha and 499.12 kg ha-1, respectively). This observation can be attributed to the fact that finger millet requires a clean seedbed and farmers who easily accessed draught power were better able to achieve land preparation in time during the season compared to those who probably had to wait and, therefore, planted late. This aspect of timeliness of operations was outside the scope of this study. Farmer groups and finger millet production. Up to 50% of the farmers (N=150) belonged to informal farmers' groups. On average, farmers group obtained significantly (P<0.05) higher grain yields (698 kg ha-1) than their individual counterparts (473.2 kg ha-1). This difference in yields might be attributed to group farmers accessing and sharing information on improved finger millet production practices, being able to form labour groups, and having easier and timely access to draught power. Hence, farmer groups could be a vehicle for research and development of finger millet production in the region. Resource use efficiency. Econometric outputs from the estimation of the Cobb-Douglas production function are presented in Table 2. All variables in the general model contributed significantly (P<0.01) to grain yields. The correlations among model variable were very low and not significant (Table 3), implying absence of multicollinearity. Overall, labour, tools and equipment, cropping experience and seeding rate were the most significant factors in this respect. The variables had a significant (P<0.01) and positive relationship with grain yield. Weed pressure was highly significant (P<0.01) but negatively related to yield. Locating finger millet fields in fertile grounds such as former kraal sites in a rotation system was also significant (P<0.05) and positively related to yields. The high significance of labour among model outputs attests to the fact that finger millet is a labour intensive crop and, therefore, labour availability is crucial. The equally high significance of tools and equipment also implies that increased investment in farm tools and equipment could offer an opportunity for increasing finger millet productivity. The strong positive effect of seeding rate on grain yield was expected since plant population densities in farmer broadcast finger millet are reportedly lower than the optimum recommendation for the crop. Nyende et al. (2001) reported a range of 75 to 95 x 104 plants per hectare, as opposed to the recommended optimum for the region of 83 x 104 plants per hectare (NARO, 1991). It is practically difficult to achieve a uniform plant population density in the field with broadcast sowing of the crop. Under broadcast sowing, the crop was unevenly distributed, being overcrowded in some areas and sparsely distributed in others. Simple mechanised sowing in rows could be the way forward for attainment of optimum plant population density and, consequently, optimum yields, apart from easing on weeding labour requirements (Nyende et al., 2001). The significance of finger millet growing experience on the production of the crop, is logical because cumulative experience is a factor in judicious allocation and utilisation of resources even in the absence of formal research efforts. Therefore, this factor and indigenous knowledge in general are key to successful implementation of potential finger millet development programmes. Indigenous knowledge is one of the frequently overlooked factors in socio-economic studies. The strong negative relationship between weed pressure as reflected by weeding frequency and yields (Table 4) is an expected phenomenon. Although the frequency of weeding was higher in the high weed pressure districts (Kumi and Kamuli), it appears that weeding was inadequate to increase yields. Weeding efforts were even challenged further by the prevalence of Striga, a weed that parasites on the crop through root physiological interactions and extracts resources captured or manufactured by the crop. Consequently, the crop becomes stunted, giving poor yields (Tusiime et al., 1996). Means for striga control are still lacking in Uganda and farmers depend on rotational cropping. At individual district levels, seeding rate and land size were the only significant variables in Kumi (Table 2) and both were positively related to finger millet yield. The effect of seeding rate remains prominent since the crop is grown in sub-optimal plant population densities. The significance of land size is true as most people with limited land parcels struggle to reduce poverty through agricultural production by encroaching on marginal lands. This reduces soil productivity and, thus, lowers crop yields (World Bank, 1986). In Pallisa district, on the other hand, labour was a highly significant (P<0.01) variable (Table 2). This contrasts with the fact that labour was more abundant and, hence, less expensive in this district compared to the other two districts (Kamuli and Kumi). In Kamuli district, on the other hand, investment in farm tools and equipment, land and labour were significant. This model output tallies directly with the socio-economic assessment in Table 1, where Kamuli farmers invested insignificantly in farm tools, equipment and labour. Rotation with cattle kraals was not a common practice in Kamuli and all farmers weeded once. Therefore, these variables were not included in the Kamuli model estimation. Yield elasticities as the estimated coefficients for the variables, are presented in Table 2. The elasticities were generally far less than one, implying existence of inelastic relationships between yield and most of the variables. In this respect, a percentage change in input use leads to a smaller change in output. For the general model, all other factors held constant, an increase in labour, experience and seeding rate by 10% leads to a 4, 3 and 3% increase in yield, respectively. Meanwhile, a 10% increase in investment in tools and equipment leads to 1% increase in yields. Farmers who practice crop rotation to ensure cultivation of finger millet on fertile soils such as grounds formerly used as cattle kraals also gain a significant finger millet yield. It is also evident that farmers be devilled by the weed problem lose a significant grain yields. At individual district level, there was a consistently significant (P<0.01) contribution of labour to finger millet yield in Pallisa and Kamuli. Assuming all factors held constant, a 10% increase in labour in Pallisa and Kamuli leads to 7 and 4% increase in grain yield, respectively. A 10% increase in seeding rate in Pallisa and Kamuli resulted in 2% increase and 3% decrease in yields, respectively. With respect to seeding rate, however, a 10% increase in rate in Kumi resulted in over 7% yields increase. Therefore, the contrast among the factors affecting yield at the district level complicates the use of the general regional model for recommendations at the district level. Efficiency parameters are also presented in Table 2 as constants. A shift in the constant indicates a shift in the efficiency of production. Kumi is the most inefficient district in finger millet production in the region. Kamuli is 50 times more efficient than Kumi, and 2 times more than Pallisa district. Efficiency of production. Under conditions of competition in the output and input markets, production is said to be efficiently organised when the marginal value product (MVP) is equal to the marginal factor cost (MFC) (Doll and Orazem, 1984). Values for the test of production efficiency, that is, the ratio of MVP to the MFC, were computed and are presented in Table 3. This is also in reference to allocative efficiency index. The ratio of 1 represents efficient use of a factor, and less than 1 implies that the factor is over utilised, hence, less of the resource should be used. While, a ratio above unity implies that the factor is under utilised and more of the resource should be used to meet the efficiency condition. The major inputs and their economic contributions to finger millet production are presented in Table 3. Basing on the size of the marginal products, labour and seeding rate are outstandingly the most productive inputs in the region. An increase in seeding rate of 1 kg seed per ha increases finger millet returns by UShs. 2,160, which is far above the cost of seed per kilogramme (UShs. 300) in the region. An increase in labour use by 1 person-day per ha, however, increases in the output value by just UShs. 133.6, which is far below the regional unit labour cost of UShs. 1,183.6. The situation was different at individual district level. In Kumi and Kamuli for instance, land and seed were most productive and had the highest marginal product. This is probably due to the relatively large land distribution in the area (Table 1) and the lower seed cost. While for Pallisa, seed and labour were the most productive factors. An increase in labour use by 1 person - day returned more than UShs. 290, while 1 kg increase in seeding rate returned over UShs. 1,420. The overall regional allocative efficiency indices (ratio of value of marginal product to marginal factor cost) for tools and equipment, and labour were less than unity, suggesting that these inputs were over utilised. The inefficiency of these resources is largely due to constraints associated with their use. The inefficient use of tools and equipment could be attributed to the fact that the crop is grown once a year (March - July) and, therefore, these facilities remain unused for most of the year. Labour use inefficiency is in part due to use of mechanically inefficient tools and equipment. For instance, weeding is done largely by hand, complemented by tiny worn-out hand-hoes (Tenywa et al., 1999). This process is complicated by the uneven crop stand due to broadcast sowing. Similarly, harvesting is done using locally fabricated blunt edged metal strips. More time is spent on each operation than would be necessary if improved means were available. As far as seeding rate is concerned, the allocative efficiency was greater than unity, implying that seed as an input was under-utilised. This suggests that there should be an increase in seeding rate. This under utilisation is most likely a result of lower seed price compared to the finger millet farm gate price. It is, therefore, likely that focus on seed rate optimisation could lead to a positive shift in finger millet productivity and economic benefits for the households in the region. On the other hand, the allocative indices of other factors present evidence of factor over-utilisation. The situation is most serious with tools and equipment throughout the region. This is followed by labour, especially in Kumi district. Over-utilised factors are invariably the most constraining factors in the production process. Hence, it is clear from this study that tools and equipment, as well as labour, are the most crucial elements in finger millet production in eastern Uganda. In part, this concurs with Oryokot's (1985) agronomic report in which labour, especially for weeding was ranked top on the list of constraints. Later studies by Tenywa et al. (1999) and Nyende et al.(2001) also came up with similar findings, though without the economic dimension. CONCLUSIONS In eastern Uganda, increasing labour use, investment in farm tools and equipment, adopting proper seeding rate, improved soil fertility, proper weed management and incorporation of indigenous knowledge in technology development and implementation are the main gateways for increasing finger millet production. However, increasing the use of these resources should critically consider the various constraints associated with their use. The interventions should also consider the uniqueness of the factors affecting finger millet yield at the individual district level rather than as a region. ACKNOWLEDGEMENTS The authors are grateful to the Rockefeller Foundation, Forum for Agricultural Resource Husbandry, for the financial support (Grant No. RF 98008 117). The agricultural staff and local administration authorities of Kumi, Kamuli and Pallisa districts are also acknowledged for their contribution. REFERENCES
©2002, African Crop Science Society The following images related to this document are available:Photo images[cs02010t2.jpg] [cs02010t4.jpg] [cs02010t1.jpg] [cs02010t3.jpg] |
| |||||||||
