 |
| About Bioline | All Journals | Testimonials | Membership | News |
|
||||||
|
||||||
African Crop Science Journal, Vol. 10. No. 2, 2002, pp. 121-132 Phenotypic and genetic correlations in Musa populations in Nigeria A. TENKOUANO, R. ORTIZ and K. P. BAIYERI1 International Institute of Tropical Agriculture, High Rainfall Station, P.M.B
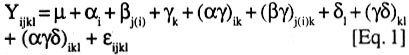
008 Nchia Eleme, Rivers State, Nigeria (Received 26 October, 2001; 4 March 2002) Code Number: cs02011 Abstract Breeding efforts for genetic improvement of banana and plantain have gradually shifted from individual trait selection to simultaneous improvement of several traits, following an ideotype concept. Therefore, information on the phenotypic and genetic association among these traits, and the influence of environmental factors thereupon, would be valuable to the Musa breeder. In this regard, the correlation of several traits with bunch weight was assessed for a sample of 36 Musa genotypes grown at three locations (Abuja, Ibadan and Onne) for two consecutive crop cycles. Genetic correlations between bunch weight and plant height at flowering, height of the tallest sucker at maturity of mother plant and number of days for fruit filling were smaller than phenotypic correlations, suggesting a synergistic effect of genotypes and environments on phenotypic relationship between bunch weight and those traits. However, the genetic correlations between bunch weight and the number of days to flowering or the number of leaves was higher than phenotypic correlations. The associations between bunch weight and yield components were higher than between bunch weight and phenological traits. In the former cases, the genetic correlation was similar to the phenotypic correlation, indicating that the effect of genotype x environment interaction on the relationship between bunch weight and yield components was neutral. This indicates that yield components could serve as indirect selection criteria for yield. Generally, there was a higher genetic expression for most yield components during the second crop cycle in all the environments. This probably implies that selection should be carried out in the second crop cycle. Different correlations were observed across locations, suggesting that different selection indices may be constructed to identify ideotypes best suited to specific agro-ecological niches. Key Words: Banana, genetic x environment interaction, heritability, plantain RÉSUMÉ Les efforts d'amélioration génétique du bananier et du bananier-plantain ont graduellement passé de la sélection de caractères individuels à celle simultanée de plusieurs caractères, suivant un concept d'idéotype. Ainsi, il devenu est important pour le sélectionneur Musa de connaître le degré d'association phénotypique et génétique entre ces caractères ainsi que l'influence des facteurs environnementaux sur ces associations. Aussi a-t-on déterminé les coefficients de corrélation entre le poids du régime et plusieurs autres caractères pour un échantillon de 36 génotypes évalués dans quatre sites (Abuja, Ibadan, Onne-alley crop, Onne-sole crop) sur deux cycles consécutifs. Les corrélations génétiques entre le poids de régime d'une part et la taille à la floraison, la taille du plus grand rejet à mâturité du pied mère et l'intervalle floraison-coupe d'autre part étaient inférieures aux corrélations phénotypiques, ce qui suggère un effet de synergie entre génotypes et environnement sur les relations phénotypiques entre le poids du régime et ces caractères. Par contre, les corrélations génétiques entre le poids du régime et l'intervalle plantation-floraison ou le nombre de feuilles étaient supérieures aux corrélations phénotypiques. Les associations entre poids du régime et composantes du rendement étaient plus fortes que les associations entre poids du régime et caractères végétatifs. Dans les premiers cas, la corrélation génétique était du même ordre de grandeur que la corrélation phénotypique, ce qui indique une neutralité de l'effet d'interaction entre génotypes et environmments sur les relations entre poids de régime et composantes du rendement. Aussi, les composantes du rendement peuvent-elles servir de critères indirects de sélection pour le rendement. En général, le niveau d'expression de la plupart des composantes du rendement était plus marqué dans le second cycle de culture quel que soit le site, ce qui veut dire que la sélection devrait se faire au cours de ce second cycle. On a obtenu différentes corrélations à travers les sites, ce qui suggère qu'on doive contruire des indices de sélection spécifiques à chaque niche agroécologique pour l'identification des idéotypes les mieux adaptés à ces niches. Mots Clés: Banane, interaction génétique x environnement, héritabilité, plantain Introduction Bananas and plantains (Musa spp.) are giant herbs that are cultivated in humid and subhumid regions of the world where they serve as staple and cash crops for many people (Dadzie and Orchard, 1996; Robinson, 1996). The cultivated bananas and plantains are predominantly triploid belonging to the Eumusa section of the genus Musa. These varieties evolved from intra- and inter-specific crosses involving two diploid ancestor species, M. acuminata Colla (genome AA) and M. balbisiana (genome BB), originating in Malaysia and India, respectively (Simmonds, 1962). In conjunction with chromosome restitution, this process gave rise to (i) autoploids and homogenomic hybrids which are essentially AAA dessert and beer bananas, and (ii) alloploids and heterogenomic hybrids comprising the plantains (AAB) and the cooking bananas (ABB). It is generally considered that genes for fruit parthenocarpy and yield are contributed by the A genome, whereas the B genome carries genes for hardiness, drought tolerance, and increased starchiness (Robinson, 1996). Hence, genome designations not only describe the relative proportion of A and B characteristics found in each group, but also determine the agronomic and environmental range as well as the organoleptic predisposition of the varieties (Simmonds, 1962; Stover and Simmonds, 1987; Robinson, 1996). A common feature of all present-day triploid cultivars is their susceptibility to black Sigatoka (Mycosphaerella fijiensis Morelet), a foliar disease that may cause from 30 to 50% yield reduction in plantain landraces in Africa and tropical America (Mobambo et al., 1993) and could wipe out commercial plantations if it were not for the massive application of fungicides. However, they remain the most preferred cultivars. Genetic resistance to M. fijiensis occurs naturally in diploid AA or BB accessions that often lack desirable agronomic and organoleptic attributes. Therefore, any successful breeding programme should aim at introgressing resistance to M. fijiensis and other pests into the existing cultivars. In addition to resistance to pests and diseases, improved hybrids should be photosynthetically efficient, early to mature in the first production cycle, and display minimum delay between consecutive harvests (Ortiz and Vuylsteke, 1994; Eckstein et al., 1995). Other desirable characteristics include short stature and strong roots for optimal nutrient uptake and greater resistance to wind damage. Hence, banana and plantain breeding essentially follows a recurrent backcrossing strategy, with the main objective of producing hybrids that are high-yielding through multiple trait selection (Rowe and Rosales, 1996; Vuylsteke et al., 1997). Complex inheritance and associations between trait expression have been reported for most growth and yield characteristics of Musa (Ortiz and Vuylsteke, 1996). Therefore, recurrent selection in a population may cause changes in traits other than those used directly as selection criteria, but the magnitude and direction of these changes may not be easily predicted (Stojsin and Kannenberg, 1994). Knowledge of the phenotypic and genetic correlations between indirectly and directly selected traits can help determine whether an indirectly selected trait will increase, decrease or remain constant in advanced cycles of selection. The nature and magnitude of association between traits may also have important implications for cultivar recommendations. For example, plantains and bananas are usually grown in backyards or in small forest fields in West Africa. In the former system, pure stands are grown perennially from successive ratoons in plots that receive organic matter from household refuse, whereas, inter-cropping predominates in the latter system. The challenge facing breeders is to select elite varieties that will give satisfactory yields under an alley cropping system, yet be amenable to intensification under a monoculture regime. Such varieties should not display substantial trait variations over cropping systems. Thus, the need for multilocational trials in the process of developent. Multilocational trials provide yield estimates for each genotype across environments, and the relative magnitude of genotypic response to environmental change, based on statistical techniques that detect and partition important agronomic variation into components (Gauch and Zobel, 1997; Kang, 1998). However, stability analyses seldom attempt to address variations in the patterns of trait association. Path coefficient analyses to determine the direct and indirect contributions of various traits to the yield of banana and plantain have shown that the coefficients varied across locations and genome groups (Baiyeri et al., 2000). Therefore, when genotype x environment interaction effects (G x E) occur, it is important to determine the effects of environments on the expression, heritability and genetic associations of important traits. This would prove useful for the construction of selection indices that would facilitate multiple trait selection and enhance breeding efficiency, with respect to cultivar stability and adaptation across environments. The objectives of this study were: (a) to estimate the heritability of several quantitative traits of banana and plantain, (b) to estimate their phenotypic and genetic correlations with bunch weight, and (c) to examine the effects of genotype x environment interaction effects with regard to these characteristics. Materials and methods Test environments, genetic materials and field experiments. The study was conducted at three geographical locations, Abuja, Ibadan and Onne, in Nigeria, following a north-south gradient of rainfall and vegetation types. Abuja (9° 16' N, 7° 20'E) is located in the southern-guinea savanna zone at about 300 metres altitude above sea level (masl) and has a unimodal rainfall pattern with an annual total of 1300 mm, falling between May and October. The maximum temperature ranges from 26 to 34°C and the minimum is between 13 and 21°C. Radiation is about 5846 MJ m-2 yr-1. The soil is ferric luvisol. Ibadan (7° 31'N, 3° 54' E, 150 masl) is in the forest-savanna transition zone and is characterised by a bimodal rainfall also averaging 1300 mm annually, most of which falls between May and October. Average temperature fluctuates betwen 20 and 35°C with an annual mean of 26.5°C. Radiation is about 5285 MJ m-2 yr-1. The soil is slightly acidic alfisol. The third test environment, Onne (4° 43'N, 7° 01'E, 10 masl), in the rainforest zone, has a unimodal rainfall pattern with an annual average of 2400 mm falling between February to December. Relative humidity remains high throughout the year, with average values ranging from 78% in February to 89% in July and September. This site receives on average four hours of direct sunshine daily, reaching 5060 MJ m-2 yr-1. The soil is representative of highly leached acid ultisols. Detailed characteristics of Onne have been reported by Ortiz et al. (1997). Thirty-six genotypes representative of cultivated Musa spp. subgroups were used for this study, including 11 landraces and 25 hybrids. The landraces comprised three dessert bananas (AAA), three plantains (AAB) and five cooking bananas (ABB). The hybrids were obtained by introgressing genes for resistance to M. fijiensis from diploid accessions into landraces of the respective groups, i.e., 8 AAA x AA, 13 AAB x AA, and four ABB x AA. The genotypes were evaluated for two consecutive crop cycles in a sole cropping system at each test environment (location), but an additional alley cropping system in a natural multispecies hedgerow (Ortiz, 1995) was used at Onne, giving a total of eight environments. Planting was done on 8 August 1995 at Abuja and on 14 August 1995 at Ibadan. Planting dates at Onne were 19 and 20 June 1995 for the sole crop and alley-crop trials, respectively. The experimental design was a 6 x 6 simple lattice replicated twice with a planting distance of 3 m between rows and 2 m within rows. Each genotype was grown in a single-row plot with five plants per replication. Cultural practices were as recommended by Swennen (1990). Data collection. Data collected were number of days to flowering (DTF), number of days for fruit filling (DFF), plant height at flowering (PHT), determined as distance from ground level to the junction of the last two fully expanded leaves), height of the tallest sucker (HTS) at the time of harvest of the mother plant, and total number of leaves (TNL). The number of days to flowering was calculated as the time interval between planting and flowering in the crop, and the interval between harvest of the previous crop and flowering of the next in ratoon crops. Other characters include bunch weight (BWT), number of hands (nodal clusters) per bunch (HND), number of fruits per hand (FNH), fruit weight (FWT), fruit length (FTL) and fruit circumference (FCR). Statistical procedures. The data were subjected to a multivariate analysis of variance using the MANOVA option of the GLM procedure in SAS (SAS, 1989). Data were initially combined over sites and crop cycles, giving the following full statistical model:
where : Yijkl = observed performance of the kth genotype
in the lth crop cycle in the jth replication
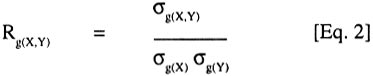
at the ith site Subsequently, reduced models sequentially excluding site effects (site-specific analysis) and crop cycle effects (separate analysis for each crop cycle at each site), were fitted to the data to estimate the corresponding specific values of heritability and correlation coefficients for each site or each cycle per site. This allowed for examination of the level of concordance between estimates based on combined analysis and those using data subsets for location or cycles within locations. The MANOVA option produces sum of squares and cross-product (SSCP) matrices of the variables for each component of the statistical model used (SAS, 1989). Mean squares and cross-products (MSCP) matrices were then calculated from the SSCP by dividing by the appropriate degrees of freedom. The resulting values were equated to their expectations, treating sites as fixed and genotypes and crop cycles as random, to obtain variance-covariance matrices. Thus, the variance-covariance matrix for genotypes defines the genetic relationships among variables. The variance-covariance matrices were then used to calculate the corresponding genetic correlation coefficients, following Searle (1961):
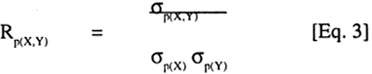
where: Rg(X,Y) is the genetic correlation coefficient between two traits X and Y, sg(X,Y) is the genetic covariance of X and Y, sg(X) is the square root of the genetic variance of X, and s(Y) is the square root of the genetic variance of Y. Pearson's simple correlation coefficients were calculated to estimate the phenotypic associations among the traits. Thus,
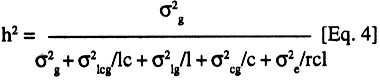
where: Rp(X,Y) is the phenotypic correlation coefficient between X and Y, s(X,Y) is the phenotypic covariance of X and Y, s(X,Y) is the square root of the phenotypic variance of X, and sp(Y) is the square root of the phenotypic variance of Y. Broad sense heritability was measured as the proportion of phenotypic variance that is due to genetic differences among genotypes and was calculated according to Hanson (1963) and Nyquist (1991) as follows:
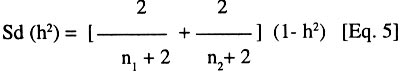
where h2 is the broad-sense heritability, s2g is the genetic variance, s 2lcg is the variance associated with genotype x site x crop cycle interaction, s2lg is the variance associated with genotype x site interaction and s 2cg is the variance associated with genotype x crop cycle interaction. While s2e is the experimental error. The terms l, c, g, and r indicate the number of sites, crop cycles, genotypes and replications, respectively. Thus, (l,c,g,r) = (4,2,36,2) for the full model used for the complete data set. For each data subset, Eq. 4 was adjusted by setting the irrelevant interaction variance terms to zero. The standard deviation of the heritability value was calculated following Vello and Vencovsky (1974):
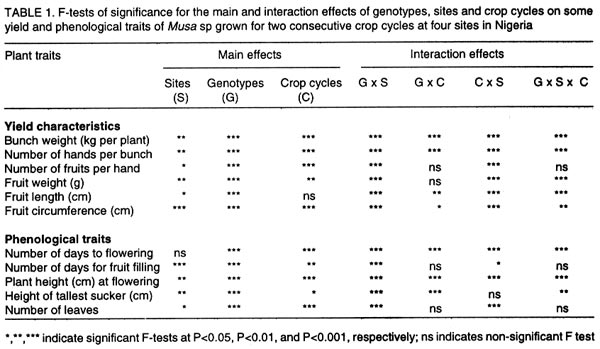
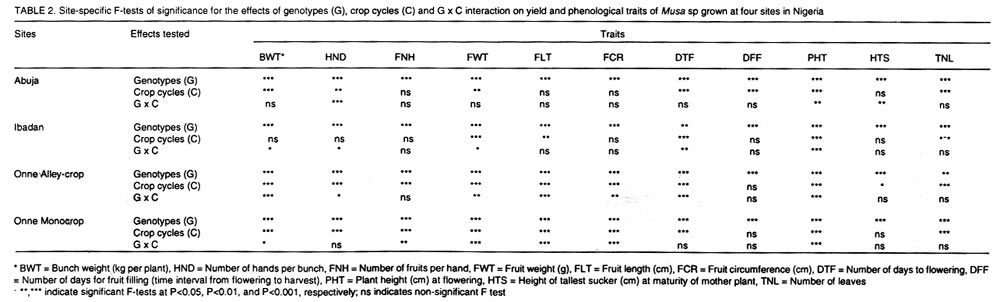
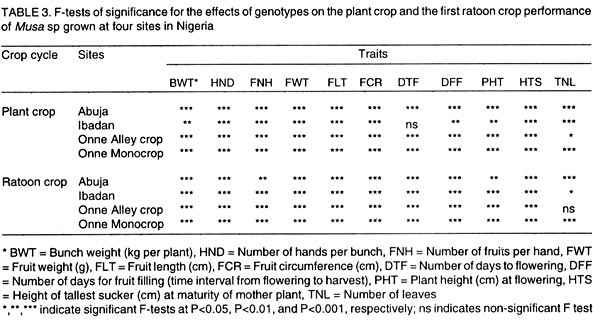
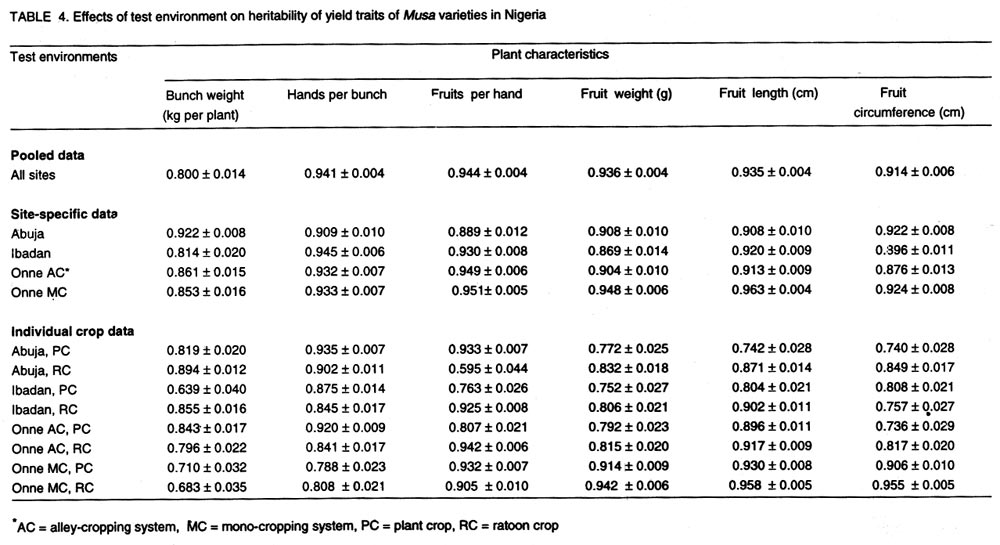
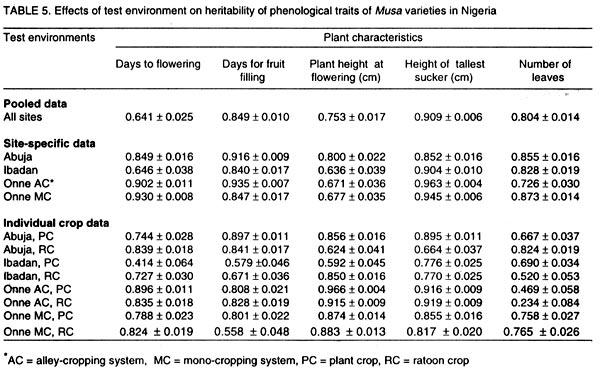
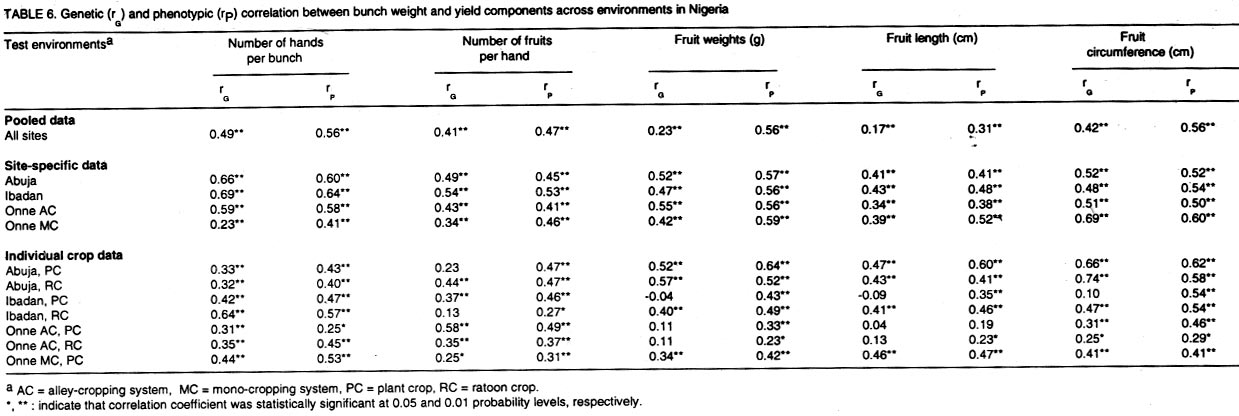
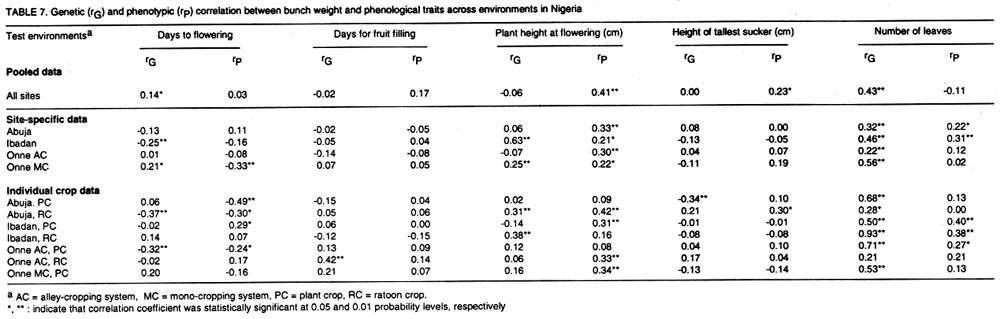
where n1 and n2 are the degrees of freedom of the genotypes and error sources of variation, respectively. Results and discussion Pooled analysis of variance. Significant main effects of genotypes (G), sites (S) and crop cycles (C) were found for most yield and phenological traits, except that there was no site effect on the number of days to flowering, and fruit length was not affected by crop cycles (Table 1). There were significant G x S and C x S interaction effects for all yield traits, whereas, G x C interactions did not affect fruit number and fruit weight (Table 1). Also, fruit number was not affected by the three-way interaction between G, S, and C, unlike other yield traits (Table 1). All 2-way and 3-way interaction effects were significant for days to flowering and plant height, but the number of leaves and fruit filling time were not affected by C x S or G x S x C interactions, while C x S effects were not significant for height of the tallest sucker (Table 1). These results, particularly the significant G x S effects on all traits studied, indicate that sites used for selection greatly influence selection of lines for advanced trials. In such cases, breeders are faced with the choice of either selecting for broad adaptation by searching for those genotypes with superior and stable performance across sites or, alternatively, selecting for specific adaptation whereby genotypes that perform best in each selection site are retained for these particular sites. The latter approach has been credited with the potential of achieving greater genetic gains by several researchers (Cecarelli,1989; Simmonds, 1991; Annichiarico, 1992). However, the results of Jackson and McRae (1998) clearly demonstrated that family selection on the basis of broad adaptation gave the highest gains in most environments. Multiple-environment testing and selection is an expensive process for Musa research, given the large land requirement (6 m2 per plant) and the long generation time of the crop. In such a situation, determining the site with maximum discrimination power among gentotypes could significantly reduce the costs and time required for cultivar selection and release. In this regard, it was important to determine the extent that genetic differences are expressed at various sites, and the magnitude of temporal effects on such factors, which was done by fitting reduced models for ANOVA, excluding site effects from Eq. 1. Site-specific analysis of variance. Significant differences among genotypes for all variables were expressed at all test sites regardless of whether data were combined over crop cycles (Table 2) or analysed separately for each crop cycle, with the exception of number of days to flowering in the plant crop at Ibadan and the number of leaves in the ratoon crop at Onne under alley cropping (Table 3). This indicates that phenotypic discrimination for yield traits and some phenological traits can be carried out in all test sites with assurance that the differences have a genetic basis, regardless of the crop cycles, with the restrictions mentioned above for days to flowering at Ibadan and number of leaves at Onne. It is useful to examine the effects of crop cycles on trait expression. In this study, crop cycle effects on trait expression varied from one location to another. At Abuja and Ibadan, there was no significant effect due to crop cycles for fruit number, fruit circumference, and height of tallest sucker. Fruit length was also unaffected by crop cycles at Abuja whereas at Ibadan additional traits not affected by crop cycles included weight, number of hands, number of fruits per hand, and days for fruit filling. Moreover, G x C interactions were not significant for the majority of traits at both locations, suggesting that selection at these sites could be done in either crop cycle. Ideally, selection at these sites should be carried out in the crop cycle that displays the best genetic variance for the traits under consideration. Contrasting with these results, at Onne, cycles effects were significant for all traits, except height of tallest sucker, under monocropping, and days for fruit filling under both alley-cropping and monocropping (Table 2). Furthermore, G x C interactions had significant effects on most traits, since only the days for fruit filling, sucker height and number of leaves were free of G x C effects in both cropping systems (Table 2). Under such circumstances, selection should be carried out in both crop cycles, which was also advocated by Ortiz (1997). Heritability and selection schemes. The extent that genetic gains can be made depends not only on the magnitude of genotypic variation allowing for unambiguous phenotypic discrimination, but also on the magnitude of this variation relative to the total variation, which is estimated by heritability. Broad sense heritability was measured as the proportion of phenotypic variance that is due to genetic differences among genotypes. Bunch weight was found to be a highly heritable trait (h2 = 0.8) as were all other yield attributes with h2 > 0.9 when data were combined over sites and crop cycles (Table 4). Heritability estimates for phenological traits (Table 5) were smaller for the number of days to flowering (h2 = 0.64) and plant height (h2 = 0.75) than for other traits, probably as a result of directional selection for earliness and short plant stature in previous generations as components of ideotype breeding (Vuylsteke et al., 1997; Tenkouano et al., 1998). Genetic differences accounted for more than 90% of the phenotypic variation for most yield traits regardless of the test site and the crop cycle (Table 4), indicating that selection can be successfully carried out at all sites and in any crop cycle. However, site-specific estimates for bunch weight were highest at Abuja, showing that the conditions at Abuja were most favorable for the expression of differences for yield among the genotypes, when selection is based on data from two crop cycles (Table 4). Heritability estimates for yield attributes based on data from two crop cycles were generally greater than those obtained with single cycle data, irrespective of test sites (Table 4). Thus, single cycle selections should not be encouraged. However, when this is unavoidable, our data indicate that selection for bunch weight would be more effective when carried out in the ratoon crop at Abuja and Ibadan, but in the plant crop at Onne (Table 4). This may reflect difficulties in establishing the crops at Abuja and Ibadan, due to less favorable weather conditions (less moisture and more heat), compared to Onne. Our results suggest that selection for bunch weight and other yield traits may not be dependable when only data from the plant crop or the ratoon crop are used, which supports earlier results from single-location analysis (Ortiz, 1997). However, the heritability estimate for bunch weight based on pooled data was less than the site-specific estimates. This probably suggest that greater genetic gains might be achieved by selecting at individual sites (over two crop cycles), i.e., for specific adaptation, which corroborates with other findings (Cecarelli, 1989; Simmonds 1991; Annichiarico, 1992). This also lends support to the concept of decentralisation of Musa breeding, whereby, hybrid seeds from predominantly tetraploid x diploid crosses can be germinated in vivo and evaluated in target sites for selection of genetic combinations most adapted to each environment (Tenkouano, 2001). Multivariate analysis and correlation among traits. Recurrent selection in a population can result in changes in traits other than those used directly as selection criteria and usually such changes are not easily predicted or understood because they may not occur in a consistent manner (Stojsin and Kannenberg, 1994). Therefore, it is important to determine the genetic causes of apparent associations between traits in order to develop appropriate selection schemes. In this study, we estimated the relationships of bunch weight to other traits based on phenotypic and genotypic correlation coefficients. The highest associations were observed between bunch weight and other yield traits (Table 6). The genetic correlation coefficients were nearly the same as the phenotypic correlation coefficients, suggesting that there was a neutral genotype x environment interaction effect on the relationships between bunch weight and yield components. Therefore, simultaneous change in bunch weight and its components can be achieved in the same direction, although the magnitude of the change may differ from one environment (site, cycle, or location x cycle) to another. These results also suggest that indirect selection for bunch weight could be achieved by selecting for yield components. In this regard, path coefficient analysis identified fruit number and fruit weight as the most reliable predictors of bunch weight (Baiyeri et al., 2000). Genetic correlations between bunch weight and phenological traits were very small across or within test sites, irrespective of crop cycles (Table 7), suggesting that phenology might not be a reliable predictor of yield. The only exception was the relatively high genetic correlations between bunch weight and the number of leaves, which was not surprising given the role of leaves in photosynthesis and in reaction to black sigatoka. Since Musa genotypes are determinate, several leaves at flowering may mean larger surface area for photosynthesis and, thus, more assimilate for fruit bulking, which will invariably affect the bunch weight. The existence of feed-forward effects of source (leaves) and sink (bunch) indicates that the two are interdependent (Evans, 1993), thus, increase in source capacity will likely increase the sink size. This corroborates with reports of 30 - 50% reductions in Musa yield due to black sigatoka disease (Mobambo et al., 1993), which essentially reduces both the number and size of photosynthetically active leaves. The genetic correlations between bunch weight and plant height at flowering, height of the tallest sucker at maturity of mother plant and number of days for fruit filling were smaller than phenotypic correlations, suggesting a synergistic effect of genotypes and environments on phenotypic relationship between bunch weight and the above traits (Table 7). However, the genetic correlations between bunch weight and the number of days to flowering or the number of leaves was higher than phenotypic correlations, suggesting an antagonistic effect of genotypes and environments on the phenotypic relationship between bunch weight and these traits (Table 7). However, this also indicates that indirect selection for yield could be achieved by manipulating leaf number and days to flowering. Different correlations were observed across environments, suggesting that different selection indices may be constructed to identify ideotypes best suited to specific agro-ecological niches, hence, emphasising in-situ selection for specific adaptation. This is of particular relevance for farmers who are often more interested in crop cultivars that exhibit reliable performance from year to year in their local environment and bother less about what happens at other locations (Rosielle and Hamlin, 1981; Evans, 1993). Thus, selecting for specific adaptation based on site-specific selection indices constructed from site specific genetic correlations may significantly enhance Musa breeding. References
©2002, African Crop Science Society The following images related to this document are available:Photo images[cs02011t4.jpg] [cs02011t3.jpg] [cs02011t7.jpg] [cs02011t5.jpg] [cs02011t2.jpg] [cs02011t6.jpg] [cs02011t1.jpg] |
| |||||||||
