 |
search
for |
| About Bioline | All Journals | Testimonials | Membership | News |
|
||||||
|
||||||
African Crop Science Journal, Vol. 10. No. 2, 2002, pp. 173-182 Glutenin Composition, Quality Characteristics, and Agronomic Attributes of Durum Wheat Cultivars Released in Ethiopia Efrem Bechere, R. J. Peña1 and Demisse Mitiku Ethiopian Agricultural Research Organization,
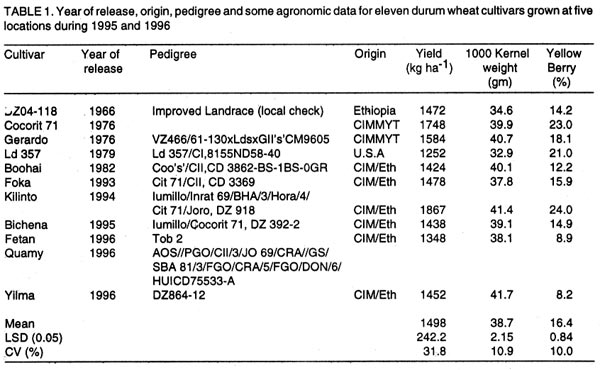
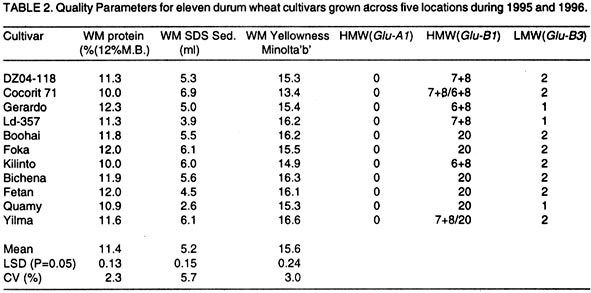
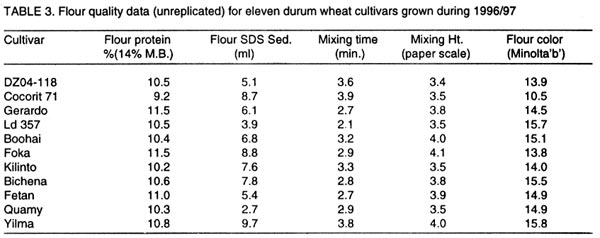
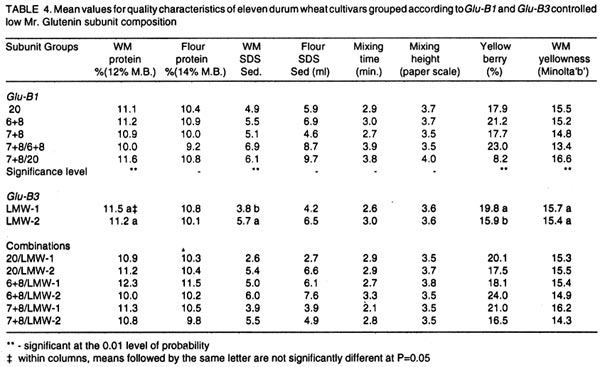
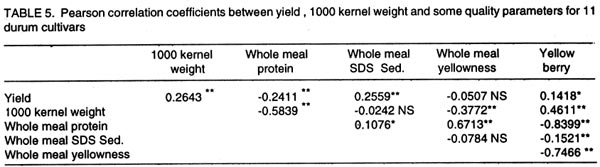
Debre Zeit Agricultural Research Center, P. O. Box 32, Debre Zeit, Ethiopia (Received 22 June, 2000; accepted 20 November, 2001) Code Number: cs02017 ABSTRACT Eleven cultivars of durum wheat (Triticum durum L. var. durum Desf.) were evaluated across five environments in Ethiopia for grain yield, 1000 kernel weight, protein concentration, gluten strength, mixing time, mixing height, colour and yellow berry to identify desirable traits for breeding purposes. Gluten strength was measured by the sodium dodecyl sulfate (SDS) sedimentation test. An electrophoretic study of gliadin and glutenin proteins was undertaken to investigate possible associations between these proteins and gluten strength. Significant genotypic differences were observed for grain yield, 1000 kernel weight, protein content, SDS-sedimentation volume, yellowness and yellow berry. Six high molecular weight (HMW) glutenin subunits patterns were identified with the combination of null and 20 being the most common. For Glu-B1, the alleles producing protein subunits of 20 and 7+8 were the most common. Alleles producing protein subunits of 6+8 were less frequently observed. Three cultivars had pattern LMW-1 while the remaining eight cultivars had pattern LMW-2. The strongest gluten strength corresponded to the mixed subunits 7+8/6+8 and 7+8/20, followed by subunits 6+8 and 7+8. Subunit 20 was associated with the lowest gluten strength. Pattern LMW-2 was strongly associated with higher gluten strength compared to LMW-1. The effects of low molecular weight (LMW) and HMW glutenin subunits were additive. In order to develop high quality durum wheats, it would be useful to discard lines with LMW-1 and HMW glutenin subunit 20 and to combine electrophoretic analysis with the SDS-sedimentation test. Key Words: Electrophoretic, gluten strength, proteins, sedimentation, Triticum durum Résumé Onze cultivars de blé dur (Triticum durum L. Var . durum dest) étaient évalués à travers cinq environnements d'Ethiopie en rendement en grains, le poids de 1000 grains, concentration en protéines, la résistance du gluten, temps de mélange, hauteur de mélange, la couleur et les baies jaunes pour identifier les traits désirables pour les semences. La résistance du gluten était mesurée par le dodecyl sulfate de sodium ( SDS) test de sedimention. Une étude éléctrophorétique du gliadin et proteines glutenines était entreprise pour chercher des possibles associations entre protéines et la résistance du gluten. Des différences significatives dues aux génotypes étaient observées pour le rendement en grains, poids de 1000 grains, contenu en protéines, SDS- Volume de sedimentation, le jaunissement et les baies jaunes. Six poids des molécules élévées de sous- unités de glutenin étaient identifiés avec la combinaison de nul et 20, étant la plus commune. Pour GLU- B1, les alléles produisant des sous-unités des protéines 6+8 étaient observées moins fréquemment. Trois cultivars avaient de tendances LMW-2. Le gluten le plus résistant correspondant au mélange des sous-unités 6+8 et 7+8. La sous-unité 20 était associée à la plus faible résistance du gluten. Le comportement du LMW-2 était fortement associé à la résistance élévée du gluten comparé au LMW-1. Les effets du faible poids moléculaires et le HMW glutenine sous-unité étaient additifs. Pour développer du blé dur aux qualités élevées, il est plus utile d'écarter les lignes avec LMW-1 et HMW glutenine sous-unités de 20 et de combiner l'analyse electrophoretique avec le SDS-test de sedimentation. Mots Clés : Eléctrophorétique, résistance du gluten, protéines, sedimentation, Triticum durum INTRODUCTION Durum wheat (Triticum turgidum L. var. durum Desf.) is widely known to be the best type of wheat for pasta products because of its kernel size, hardiness, and golden amber color. Pasta is the general term for foods such as macaroni, spaghetti and noodles. Cooked pasta made from durum wheat semolina retains good firmness and elasticity and is resistant to surface disintegration and stickiness. These characteristics depend more or less on the cultivars that are processed (Dexter and Matsuo, 1977; Autran et al., 1986; Feillet et al., 1989). Autran and Galterio (1989) pointed out the essential element of cooking quality to be the ability of durum wheat protein components to interact during pasta processing, to give insoluble aggregates and viscoelastic complexes able to entrap starch granules, and to limit the surface disintegration of pasta upon cooking. Gliadin and glutenin proteins interact in the presence of water to form glutenin, the protein complex responsible for the viscoelastic properties that make durum wheat important for pasta making (Peña et al., 1994). Durum pasta cooking quality, however, is a varietal characteristic (Dexter and Matsuo, 1977; Autran et al., 1986; Feillet et al., 1989). Viscoelasticity of cooked pasta correlates with protein content and type (Damidaux et al., 1980; Kosmolak et al., 1980; Du Cros, 1987). Adequate quantity of wheat protein is necessary if the final products are to have good tolerance to overcooking, low cooking loss, desirable organoleptic features and acceptable nutritional value. Researchers (Galterio et al., 1993; Mariani et al., 1995) have indicated that durum wheats with 13% protein could provide excellent products whereas wheats with protein contents below 11% give products of inferior quality. Nevertheless, the large differences in the rheological and cooking properties of gluten existing among varieties of similar protein content has posed the problem of gluten quality. Gluten composition is the main factor that determines the quality characteristics of durum wheat cultivars (Vazquez et al., 1996). Glutenins are subdivided into high (HMW) and low (LMW) molecular weight subunits. The HMW subunits are encoded by genes on the long arm of group 1 homologous chromosomes (Glu-A1, Glu-B1, Glu-D1) whereas the genes encoding the LMW subunits are clustered on the short arm (Glu-A3, Glu-B3 and Glu-D3) of the same chromosomes, tightly linked to the Gli-B1 complex loci which encode for -gliadin 42 and g-gliadin 45 (Payne et al., 1984; Shewry et al., 1986; Payne, 1987; D'Ovidio et al., 1992; ). Two LMW glutenin subunit patterns, LMW-1 and LMW-2, explained a large part of the quality differences between some durum wheat genotypes. It is the presence of LMW-2 glutenin subunits, in fact, which confers superior quality with respect to cultivars possessing LMW-1 (Vazquez et al., 1996; D'Ovidio, 1993). Ruiz and Carillo, (1995) generalised that, lines with the pattern LMW-2 had significantly greater SDS sedimentation value and better mixograms than those with patterns LMW-1. The g-gliadin components 42 and 45 are only genetic markers, without any direct involvement in dough quality. However, LMW glutenins are the direct causal agents of glutenin viscoelasticity and firmness (Pogna et al., 1988; Feillet et al., 1989; Pogna et al., 1990; D'ovidio et al., 1992).Autran and Galterio (1989) pointed out that genotypes belonging to the LMW-1 type tended to have higher tillering and black rust (Puccinia graminis) resistance and lower brown rust (Puccinia recondita) resistance, while the opposite is true with LMW-2 genotypes. In their study on the relationship between gluten strength and glutenin properties, Carillo et al. (1990) found that HMW subunits 6+8 and 7+8 were the most common and subunit 20 was less frequent. Results concerning the effect of HMW glutenin subunits on durum wheat quality are, however, conflicting. Some studies indicated that HMW glutenins were poor indicators of viscoelastic properties (Du Cros, 1987; Carrillo et al., 1990). Autran and Feillet (1987) reported no significant differences between SDS means of cultivars with subunit 6+8 or 7+8. Cultivars with subunit 20, however, seemed to have less gluten strength since their SDS was different from that of the other cultivars. Peña et al. (1995) pointed out that subunits 6+8 and 7+8 showed significantly better quality effects than subunit 20. According to them, the subunit pair 6+8 was associated with higher SDS values when combined with LMW-2, than with LMW-1. Pogna et al. (1990) indicated that gluten subunit 7+8 gave larger SDS sedimentation volume and higher elastic recoveries than subunits 6+8 and 20. The positive effects of LMW-2 gluten subunits and HMW subunit 7+8 were additive. These results were also corroborated by Ruiz and Carillo (1995) and Boggini et al. (1997). A deep, clear, yellow color in semolina and in the finished spaghetti or macaroni products are desirable characteristics of durum wheat. Durum is unique among wheats in that it contains adequate amounts of xanthophylls (yellow pigment) and low amount of the enzyme lipoxidase which destroys the yellow pigment during processing. Joppa and Walsh (1974), indicated that varieties differ from each other in quantity and quality of xanthophylls and lipoxidase. Ethiopia is the largest producer of durum wheat in sub-Saharan Africa. It is, in fact considered to be the center of genetic diversity for this type of wheat (Vavilov, 1951). However, very little emphasis has been placed on improving the nutritive quality of durum wheat although it is a major source of nutrition in the country. In this study, eleven durum wheat cultivars released in Ethiopia between 1966 and 1996 were evaluated in different environments to assess their agronomic and quality characteristics for possible utilisation for breeding purposes. The paper also recommends appropriate breeding method(s) for quality screening. MATERIALS AND METHODS Plant material. Eleven durum wheat cultivars officially released in Ethiopia between 1966 and 1996 were included in the study (Table 1). Separate check cultivars representative of each location were also included for comparison purposes. The materials were planted in five diverse and typical durum wheat growing environments (Debre Zeit, Akaki, Chefe Donsa, Bichena and Alem Tena) across the country during 1995/96 and 1996/97. Debre Zeit and Akaki are mid-altitude areas (1900-2300 metres above sea level (m.a.s.l) characterised by moderate yearly rainfall (700 to 900 mm) and well drained black vertisols. Chefe Donsa and Bichena are highland areas (>2300 m.a.s.l) characterised by high annual rainfall (>1000 mm) and black vertisols with poor drainage. Alem Tena is a lowland area (< 1900 m.a.s.l) located in the Rift Valley and with well-drained sandy soils. The yearly average rainfall at this location is 500 mm and is quite erratic. A randomised complete block design with three replicates was used. Plot sizes were 6 m x 2 m. Fertiliser was applied at the rate of 100 kg ha-1 diammonium phosphate (DAP) and 100 kg ha-1 urea. The DAP fertiliser was all applied at planting time whereas urea was split-applied especially at the high rainfall sites. Other agronomic practices were based on local recommendations. Electrophoretic analysis. Total grain protein extracts were separated by sodium dodecyl sulfate-polyacrylamide gel electrophoresis (SDS-PAGE), using 10% polyacrylamide gels. High and low-molecular weight glutenin subunits were designated according to the numbering system of Payne and Lawrence (1983) and Payne et al. (1984). Quality evaluation. Whole meal samples were generated with a "Udy Cyclone" mill (Udy CO., Colorado, USA), fitted with a 0.5 mm screen, while flour samples were produced with a Brabender Jr. (Brabender OHG, Duisburg, Germany), fitted with 9XX mesh sieve. Gluten strength was estimated by the SDS-sedimentation test on 1-g meal of flour samples as described by Peña et al. (1990). This test is used in many laboratories as an indicator of gluten firmness and elastic recovery because of its simplicity, small sample size requirement, rapidity and high degree of precision (Dexter and Matsuo, 1980; Dick and Quick, 1983; Autran et al., 1986). Grain and flour protein were determined by NIR analysis using an Infralyzer 350 (Technicon Instruments Corp., Tarrytown, New York, USA) equipment, calibrated for protein (N X 5.7) as determined by the Kjeldahl procedure of the AACC (1983). Grain and flour yellowness was determined with Minolta (Minolta CO., N. Jersey, USA) color meter ("b" value), following manufacturer's instructions. Dough mixing time and mixogram peak height (recording paper size), were determined on 10-g flour samples with a Mixograph (National Mfg, Co. Chicago, Ill., USA) following method 54-40A of the American Association of Cereal Chemists (AACC, 1983). Yellow berry percentage was determined visually in 20-g grain samples. Statistical analysis. Data were analysed using the SAS statistical program (SAS Institute, 1985). Fisher's Protected Least Significant Difference (LSD) was used for mean separation where the F-test was found significant for genotypes. Pearson's correlation coefficients were calculated to determine relationships between the various parameters. Correlation was calculated based on the means of the eleven cultivars common to all locations. For flour quality only second year (1996/97) data of testing was presented. Samples from the three field replicate were combined to generate flour quality data. Hence, no statistical analysis were carried out on flour quality data. Homogeneity of error variance was tested before combining data across locations. RESULTS AND DISCUSSION The list of varieties included in the study with their year of release, origin, pedigree, 1000 kernel weight and yellow berry are given in Table 1. Yield levels were lower than normal and this was probably because of the low amount of rainfall received during the 1995/96 growing season across locations. At every location, a check was grown separate from the trial for observation. The local check at Akaki and Chefe Donsa (DZ04-118) gave better yields than the improved varieties because of its adaptation to microenvironment area. Among the improved varieties, Kilinto and Cocorit 71 gave the highest yield. The highest amount of yellow berry arose from these two varieties. This might be due to the negative association between protein concentration and yield. High yielding cultivars tend to have lower protein, than the latter which causes yellow berry. Quality parameters. Summaries of the quality parameters are given in Tables 2 and 3. On a wholemeal basis (Table 2), there were significant (P<0.05) differences between cultivars for protein concentration, SDS sedimentation volume and yellowness. For the released cultivars, grain protein ranged from 10 to 12.3%. Two of the local checks gave 13.4 and 14.2% protein, respectively, at Debre Zeit and Alem Tena. Cultivars Gerardo, Foka and Fetan gave grain protein concentration of 12% or higher. Cultivar Cocorit 71 gave a significantly (P<0.05) higher SDS sedimentation volume than the rest of the cultivars based on whole meal data. Foka, Yilma, and Kilinto also gave relatively high SDS values. Cultivars Quamy, Ld 357 and Fetan had the lowest SDS values. From the quality analysis of the flour carried out on bulked sample across replicates during 1996/97, flour protein concentration, though lower in values, correlated positively with whole meal protein (Table 3). Flour SDS values were higher but in general all follow a similar pattern. Cultivars Yilma, Foka and Cocorit 71 gave the highest flour SDS values. The longest mixing time was also observed in Cocorit 71 and Yilma. Cultivar Yilma, again, with Foka and Boohai gave the highest mixing height. Cultivars Ld 357, Bichena, Boohai, Fetan and Yilma exhibited the highest whole meal yellowness (Table 2) and flour color (Table 3). Pasta from these cultivars, therefore, should have good bright yellow color. Joppa and Walsh (1974) indicated that semolina and spaghetti colours are generally closely related, except when high lipoxidase levels destroy the pigment during processing. High molecular weight (HMW) and low molecular weight (LMW) glutenin subunits. Six different patterns were identified for HMW glutenins with the combination of null and 20 being the most common. For Glu-B1, the alleles producing protein bands 20 and 7+8 were the most common. Alleles producing bands of 6+8 were less frequent. Cultivars Yilma and the check from Bichena had the combination of bands 20/7+8 and Cocorit 71 had subunit combinations 7+8/6+8. With regard to LMW glutenin subunits, the cultivars studied could be classified into two groups: (i) Gerardo, Ld 357, and Quamy having pattern LMW-1 and (ii) the remaining eight cultivars had pattern LMW-2. All the check cultivars also had LMW-2 (Table 2) The relationship between HMW and LMW glutenin subunits and durum wheat quality is given in Table 4. Significant differences were observed among the six HMW subunits for whole meal protein, whole meal SDS, yellow berry, and yellowness. The most gluten strength was imparted by the subunit pair 7+8/6+8 (Cocorit 71), followed by 7+8/20 (Yilma) and 6+8(Kilinto), while subunit 20 was associated with the lowest gluten strength (Quamy and Fetan) (Table 2). Autran and Feillet (1987) and Kovacs et al. (1993) also reported that subunit 20 was negatively associated with gluten quality. Cultivars with LMW-2 had significantly higher gluten strength than those with LMW-1 as indicated by their SDS sedimentation volumes (Table 4). Various researchers (D'Ovidio, 1993; Ruiz and Carillo, 1995; Porceddu et al., 1998) have also reported that band LMW-2 is responsible for endowing semolina with better properties. The effects of the LMW and HMW glutenins on gluten quality appear to be additive because cultivars showing glutenin patterns LMW-2 in association with HMW glutenin subunits 6+8 and 7+8 were among those identified by the best gluten quality (Cocorit 71 and Kilinto) (Table 2 and Table 4). This type of additive response was also reported by Boggini et al. (1997). Correlation. Pearson's Correlation Coefficients for some of the quality and agronomic characteristics of the study materials are presented in Table 5. Grain yield and 1000-kernel weight were positively correlated. A negative correlation of moderate magnitude was found between yield and protein concentration, whereas grain yield and SDS sedimentation volume were positively correlated. Boggini et al. (1997) also reported similar results. Protein concentration and SDS sedimentation volume were positively but weakly correlated (r= 0.11, P < 0.05). Fowler and De La Roche (1975); Autran and Galterio (1989); Novaro et al. (1997); Porceddu et al. (1998) and Galterio et al. (1993), all reported positive correlation between protein concentration and SDS sedimentation volume. A negative correlation of moderate magnitude was, however, reported by Autran et al. (1986) and Boggini et al. (1997). Some researchers, on the other hand, concluded that protein and gluten quality are independent traits with no association between them (Grzybowski and Donnelly, 1979; Lukach, 1979; Quick and Donnelly, 1980). The highest positive correlation (r = 0.67, P < 0.01) was observed between protein concentration and color (yellowness). Dexter and Matsuo (1977), also reported high positive correlation (r = 0.93) between semolina protein concentration and semolina pigment content. A weak negative correlation was observed in this study between SDS sedimentation volume and yellowness. Autran et al. (1986) reported similar results. Stenvart (1973) associated high gluten content with poor spaghetti color. He concluded that the desirable firm, chewy character of spaghetti can only be obtained at the expense of color. However, Mungarro (1988) argued that SDS microsedimentation value and pigment content are two genetically independent characteristics and that pigment content could be selected without relying on the electrophoretic banding pattern. As expected, the association between kernel weight and protein content was negative and highly significant (r = -0.58, P<0.01). The result also showed significant, negative correlations between yellow berry and protein concentration, and yellow berry and SDS sedimentation volume. The results of Novaro et al. (1997) and Dexter (1988) corroborated this observation. CONCLUSION Although high protein (> 13%) is not essential in pasta processing, products made from durum wheats require adequate level of protein for proper processing characteristics, nutritional value and overall quality. Most lines evaluated in this study had adequate levels of protein. In spite of the fact that qualitative traits such as protein content and gluten strength neither conferred any adaptive advantage nor underwent a human selection pressure in Ethiopia, a large genetic variation for SDS sedimentation volume was also found in the materials studied (2.6 - 6.9 ml). In general, cultivars with glutenin subunit patterns LMW-2 show superior gluten strength to cultivars possessing LMW-1. Cultivars Cocorit 71, Foka, Kilinto and Yilma had the highest gluten strength as determined by the whole meal SDS sedimentation test. Flour SDS sedimentation data also showed similar results. Overall, cultivar Foka gave superior performance across most quality parameters. On the other hand, Gerardo, Ld 357 and Quamy, with their low molecular subunit 1 (LMW-1) glutenin gave poor gluten strength. This study has shown that in a breeding programme of durum wheat quality, it is safer to use low molecular weight glutenin patterns (LMWG), the real casual proteins, because the same high molecular weight glutenins (HMWG) can be associated with two different patterns of LMWG as has been demonstrated in this study. In a breeding programme for quality, it would be useful to discard lines with LMW-1 and HMW glutenin subunit 20, and to combine electrophoretic analysis with SDS sedimentation test to develop cultivars of durum wheat with good viscoelasticity and firmness of cooked pasta. The SDS test and the mixogram are effective in detecting the genetic variance related to gluten properties. During breeding, it is advantageous to select for SDS in early generations because lines chosen for high SDS values maintain good characteristics when grown in different locations and years. Protein content, on the other hand, is highly influenced by the environment. Genetic expression of a trait such as protein content must, therefore, be measured with reference to a set of environmental conditions. In a breeding programme, selection for protein content must be done during the later generations when seeds are sufficient for growing the trial in many environments. ACKNOWLEDGEMENT The authors thank the International Center for Wheat and Maize Improvement (CIMMYT) in Mexico and the Regional CIMMYT office in Ethiopia for providing assistance in the quality analysis of the durum wheat cultivars. REFERENCES
©2002, African Crop Science Society The following images related to this document are available:Photo images[cs02017t3.jpg] [cs02017t5.jpg] [cs02017t4.jpg] [cs02017t1.jpg] [cs02017t2.jpg] |
| |||||||||
