 |
| About Bioline | All Journals | Testimonials | Membership | News |
|
||||||
|
||||||
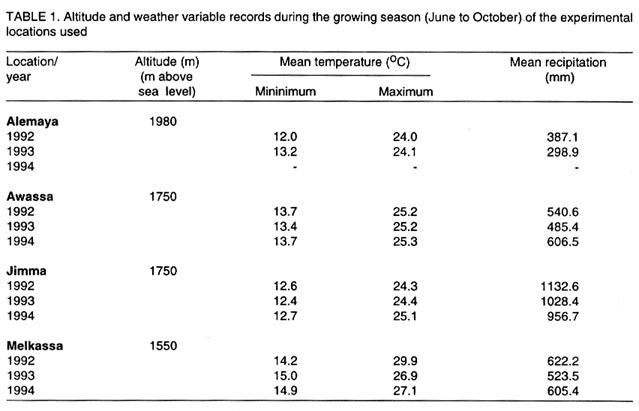
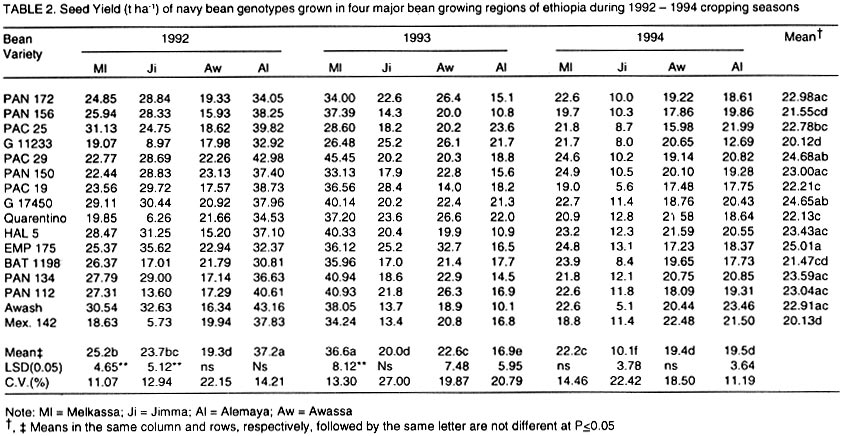
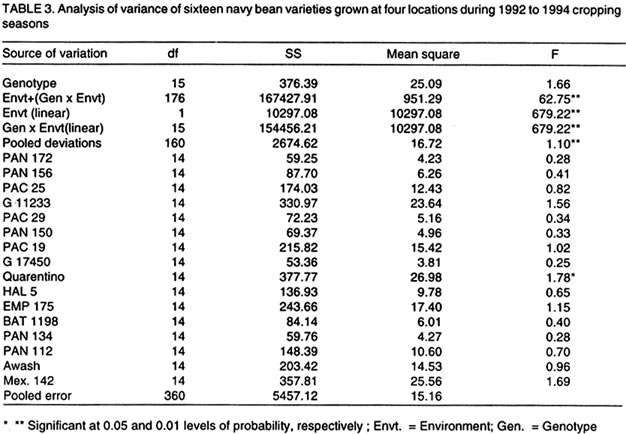
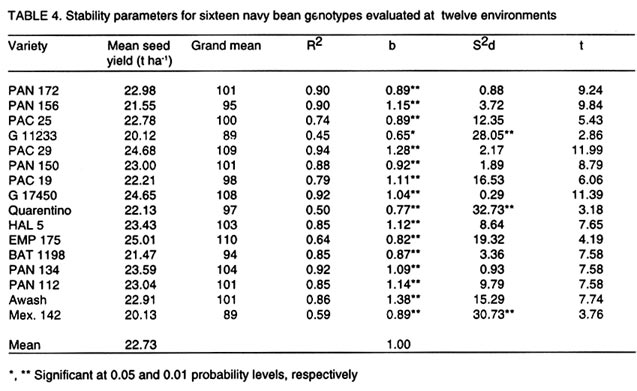
African Crop Science Journal, Vol. 11. No. 1, 2003, pp. 1-7 Genotype X Environment Interaction and Stability Analysis of Seed Yield in Navy Bean Genotypes Setegn Gebeyehu and Habtu Assefa National Lowland Pulse Research Program, Melkassa Agricultural Research Center, P. O. Box 436, Nazareth, Ethiopia Received 30 August, 2002 Code Number: cs03001 ABSTRACT Genotype x environment interactions, genotype response to environments and stability for seed yield of navy bean genotypes (Phaseolus vulgaris L.) were studied. Sixteen genotypes were grown in a randomised complete block design with three replications at four locations in Ethiopia. Genotype x environment (G X E) interactions were analysed using linear regression. There was considerable variation in seed yield within and across environments. Genotype x environment interaction was present, the highest being the linear component. The significance of the linear proportion demonstrated the adequacy of the regression model in describing the stability of the bean genotypes. Two genotypes, G 17450 and PAN 134 with respective regression coefficient values of 1.04 and 1.09, smaller S2d values, and a relatively high seed yield could be considered the most widely adapted genotypes. The other test genotypes were sensitive to production-limiting factors, their wider adaptability, stability and general performance to the fluctuating growing conditions within and across sites being lowered. Key Words: Adaptation, Phaseolus vulgaris, regression coefficient, seed yield Résumé Les intéractions génotype et environnement, la réponse du génotype aux environnements et la stabilité du rendement en graine des génotypes de haricots commun (Phaseolus vulgaris L.) étaient étudiés. Seize génotypes étaient germés dans un block completement au hasard avec trois réproductions en quatre endroits en Ethiopie. Les intéractions génotype x environnement (GXE) étaient analysées en utilisant une régression linéaire. Il y avait une variation considérable en rendement en graine dans et à travers les environnements. L'intéraction génotype x environnement était présente et la plus élévée était la composante linéaire. L'importance de la proportion linéaire a demontré le caractère adéquat du modèle de régression dans la description de la stabilité des génotypes de haricots. Deux génotypes, G 17450 et PAN 134 avec des coéfficients de régression de valeurs respectives 1,04 et 1,09 , les petites valeurs de Sd2, et un haut rendement en graine relatif pourraient être considérés comme les génotypes les plus largement adaptés. Les autres épreuves des génotypes étaient sensibles aux facteurs limitant la production, leur large adaptabilité, stabilité et performance générale aux fluctuantes conditions de croissance dans et à travers les sites étant diminuées. Mots Clés: Adaptation, Phaseolus vulgaris, coéfficient de régression, rendement en graine INTRODUCTION Cultivar testing programmes generate phenotypic data for seed yield and other traits that enable us obtain the most accurate estimates of cultivar performance that are possible, within the limitations imposed by time and costs. Baker (1968) indicated that in the quantitative genetic sense and in accordance with available resources, the goal of cultivar testing is to minimise the variance of a cultivar mean. Decreasing the variances of a cultivar mean improves the probability of detecting significant differences among cultivars (Cramer and Beveredrof, 1984). Knowledge of the size of the variance components associated with G X E interactions can be used in conjunction with combination of years, locations and replications, to determine the most efficient allocation of resources for cultivar testing (Rasmusson and Lambert, 1961). Different attempts have been made to solve the problems created by G X E interactions (Hanson et al., 1956; Comstock and Moll, 1963). Most of the estimates, however, only provide information on their existence and magnitude, but give no measurements of the individual genotypes with the environment, and therefore no measurements of stability of individual cultivars. Interest has been focused on the regression analysis, an approach originally proposed by Yates and Cochran (1938) and later modified by Finlay and Wilkinson (1963) and Eberhart and Russel (1966). Regression analysis has been widely used in comparing and measuring genotypic performances of common bean cultivars (Francis et al., 1978a, b; Beaver at al., 1985; Kelly et al., 1987). Allard and Bardshaw (1964) have categorised environmental factors which lead to G X E interactions as predictable and unpredictable. The contribution of predictable environmental fluctuations to genotype x location interactions can be reduced by allocating specific cultivars to specific environments (Allard and Bardshaw, 1964). Unpredictable environmental variation is more difficult and often leads to large genotype x year and genotype x year x location interactions (Allard and Bardshaw, 1964). Selection of stable cultivars that perform consistently across environments can reduce the magnitude of these interactions. Although common beans are grown in diverse environments in Ethiopia, there is currently inadequate information on the stability and response of different cultivars in different agroecologies. It is hopped that a better understanding of G X E interactions in beans lead to more efficient allocation of resources in our multi-environment cultivar testing program. This experiment was, therefore, designed to measure and determine the nature of G X E interactions and study the response and stability of navy bean cultivars grown in diverse bean growing regions of Ethiopia using different parameters. MATERIALS AND METHODS Experimental design. Sixteen varieties grown in navy bean National Variety Trials during 1992-1994, at four locations representing different agroclimatic zones of Ethiopia (Table 1) were used in this study. A randomised complete block design with four replications was used at each location. The plots consisted of six rows of 4 meter length spaced at 0.4 by 0.1 meter. The central four rows were harvested to determine seed yield. Data analysis. The analysis of variance was used using MSTAT-C statistical package. The number of replications, years and locations that would be most efficient for navy bean cultivar testing were estimated by determining their effect on the magnitude of the theoretical variance of a cultivar mean (s2g). The variance is given by the formula: (s2x) = (s2e)/RLY + (s2gly)/LY + (s2gl)/L + (s2gy)/Y where R, L and Y are the numbers of replications, location and years, respectively (Rasmusson and Lambert, 1961). The variance components estimated from the analysis of variance and a range of values for R, L and Y were used to estimate the standard error of a cultivar mean (s2x). The stability parameters suggested by Finlay and Wilkinson (1963) and Eberhart and Russel (1966) were also calculated. Each location in a given year was considered as an individual environment. Two stability parameters were measured: (1) the linear regression (b value) of variety mean yield in each environment on the average yield of all varieties in each environment, (2) the mean square deviation from the regression for each variety (S2d value). Significance of regression coefficients (b values) was tested by the Student's t-test (Steel et al., 1997). Coefficients of determination (r2 values) were computed from individual linear regression analysis (Pinthus, 1973). To demonstrate interrelationships of the stability statistics estimated, correlation coefficients (r) between pairs of stability statistics and between each statistic and the mean yield were calculated. The overall efficiency of the regression analysis in estimating G X E interaction was measured as the linear proportion of variance accounted for by the regression (Fripp and Caten, 1971). Simulation of current experiment by varying the number of years, locations and replications were used to determine the most efficient combination for navy bean cultivar testing. RESULTS AND DISCUSSION The effect of genotypes and the environments (locations) were significant (Table 2). The test genotypes exhibited significant differences only in seven out of the twelve environments. The lowest yield (5.05 t ha-1) was produced by PAC 19 at Jimma in 1994 and the highest (45.45 t ha-1) by PAC 29 at Melkassa during the 1993 cropping season. Yield of genotypes varied from 20.12 t ha-1 for genotype G 11233, to 25.01 t ha-1 for EMP 175. Yield was also greatly influenced by the environments. The range was 10.1 t ha-1 at Jimma in 1994, to 37.2 t ha-1 at Alemaya in1992. Main effects due to years (y), genotypes (g) and locations (l), genotype x year (gy), genotype x location (gl) and genotype x location x year (gly) interactions were highly significant (p<0.01) (Data not shown). When individual variances were expressed as a percent of the total variation (s2g + s2gl + s2gy + s2gly + s2e), the variance component accounted by genotype, genotype x location, genotype x year and genotype x year x location were 28, 21, 27, and 18 %, respectively. Similarly, a high contribution of genotypes to the total variance was reported for barley (Rasmusson and Lambert, 1961) and oilseed rape (Brandle and McVetty, 1988). The estimate of s2gy (27%) was higher than s2gl (21%) indicating that performances of cultivars were less consistent over years than over locations. Also, the genotypes responded differentially to one or more of the environmental factors, which differed between years. The relative importance of year as a factor affecting G X E interaction has been repeatedly reported, suggesting the need for testing in more years, rather than more locations (Brandle and McVetty, 1988; Biarnes-Dumoulin et al., 1996; Espitia-Rangel et al., 1999). The significant s2gl component obtained in this study reveals that the bean genotypes are not fully adapted to the wide array of bean growing environments in the country, as such, recommendation of specific genotypes for specific regions is necessary. Although the relative contribution is lower when compared with that of the s2gy and s2gl components, s2gly was also considerable (18 %) suggesting an important differential response to environmental variation not accounted for either the year or location groupings. Disease incidence, precipitation and temperature are among the factors often reported to lead to conditions unique to each year-location combination giving rise to differential response of cultivars to these varying conditions (Brandle and McVetty, 1988; Haji and Hunt, 1999). Increasing the number of years from three to six, keeping the number of locations and replications constant has reduced cultivar variance mean by 33% but 15% reduction when the number of locations were raised to six, keeping the number of years and replications unchanged. Increasing the number of locations to six and reducing the number of years to two raised the variance by 117%, where as the reduction of locations to two and increasing the number of years to six raised the variance only by 105%. Therefore, years are more important than locations in determining the standard error of a cultivar mean. The estimated variance of cultivar means was not altered when the number of replication was decreased or increased by one. Thus, replication could be reduced by one without seriously affecting the precision of cultivar mean. For the joint regression analysis, the G X L, G X Y and G X Y X L interactions were summed and partitioned into linear and non-linear components (Table 3). The G X E (linear) including the linear effect due to environments showed significant differences between regression coefficients pertaining to the regression of genotype yields on environmental yields. The result demonstrated that there were differences among slopes of regression lines and the regression model was adequate in describing the stability of the navy bean genotypes. The regression lines gave a good fit (92%) to the actual seed yields from the different environments and the usefulness of b is, therefore, pronounced. The significant contribution of the linear component to the variation in yields were also reported for oats genotypes (70 to 90%) (Langer et al., 1978), Brassica campastris (83 to 87%) (Joarder et al., 1978) and forage vetches (82%) (Abd-El Moneim et al., 1988). Although smaller in magnitude compared to the linear component, the highly significant deviation from the regression demonstrated the presence of a degree of non-linearity in the G x E interactions; the latter resulted from either interactions specific to certain genotype-environmental combinations or change in the expression of the interaction from environment to environment (Tai et al., 1982). Regression coefficients ranged from 0.65 (for var G 11,233) to 1.38 (for var Awash) (Table 4). Five genotypes (PAN 156, PAC 29, PAC 19, HAL 5 and Awash) had regression coefficients significantly greater than 1.0; they were, therefore, sensitive to environmental changes. Three of these genotypes, PAC 29, HAL 5 and Awash, had higher seed yields than the grand mean and, hence, could be recommended for cultivation under productive environments. Four genotypes (G 11233, Quarentino, BAT 1198 and Mexican 142) had regression coefficients significantly less than 1.0 with seed yields below the grand mean. These genotypes were relatively better adapted to poor environments and were insensitive to environmental changes. Such genotypes could be recommended only for cultivation in unfavorable conditions. Similarly, the genotype EMP 175 with the highest mean seed yield of 25.01 t ha-1 and regression coefficient of 0.82, was also insensitive to environmental changes and, hence, could successfully be cultivated under a more unfavourable growing environment. According to Eberhart and Russel (1966), a variety considered as stable should meet criteria of high mean yields, with b equal to unity and s2d approaching zero. Using these criteria, two varieties, G 17450 and PAN 134, with regression coefficients of 1.04 and 1.09, respectively, S2d approaching zero and with relatively high mean seed yields (Table 4) could be considered widely adapted and stable; they have the ability to express their yield potential in a range of environmental conditions. In general, the highest yielding genotypes appeared less stable than the average of all lines, and selection solely for seed yield could result in discarding many stable genotypes. Similarly, selection indices identified genotypes that were stable, but these genotypes yielded slightly less than genotypes selected solely for yield. For simultaneous selection of genotypes that are stable and also high yielding, methodologies other than those employed here would be of more benefit. Correlation between mean seed yield and the three stability parameters varied considerably (Table 5). The association between mean yield and S2d (significant and negative), and mean yield and r2 (significant and positive) were similar in value (r = 0.53). Similarly, the association between b and r2, and S2d and r2 were strong and highly significant (p<0.01) with correlation coefficient (r) values of 0.73 and -0.93, respectively. The positive and significant correlations between mean seed yields and r2, and b and r2 suggest that the parameter, r2 shall be considered only in measuring dimensions of seed yield but could not adequately detect stability and, hence, its efficiency in selecting desirable genotypes is limited when used alone. The usefulness of the coefficients of determination (r2) was, however, demonstrated by Abd El-Moneim (1993) because it is standardized, the results are comparable between experiments, and independent of scale. The non- significant correlation between mean seed yield and b suggests that many high yielding genotypes did not respond to increased environmental productivity at a rate greater than the mean of all genotypes evaluated. CONCLUSIONS The investigation of G X E interaction and stability of navy bean genotypes in this study has clearly showed that the test genotypes were sensitive to production-limiting factors. Hence, their wider adaptability, stability and general performance to the fluctuating growing conditions within and across sites were considerably lowered. Not disregarding the possibility of obtaining genotypes with wide adaptation at the expense of exceptionally high yield at specific sites (Singh, 1991), the decentralised navy bean cultivar testing approach, currently employed by the national bean improvement programme as a silent breeding strategy for the development of varieties with specific adaptation and maximum yield in the major growing regions, is a justifiable allocation of resources. REFERENCES
© 2003, African Crop Science Society The following images related to this document are available:Photo images[cs03001t5.jpg] [cs03001t2.jpg] [cs03001t3.jpg] [cs03001t1.jpg] [cs03001t4.jpg] |
| |||||||||
