 |
| About Bioline | All Journals | Testimonials | Membership | News |
|
||||||
|
||||||
African Crop Science Journal, Vol. 11. No. 1, 2003, pp. 9-15 GENOTYPE X ENVIRONMENT INTERACTION STUDIES ON YIELDS OF SELECTED POTATO GENOTYPES IN UGANDA G. ABALO, J. J. HAKIZA1 , R. EL-BEDEWY2 and E. ADIPALA
Department of Crop Science, Makerere University, P.O. Box 7062, Kampala, Uganda
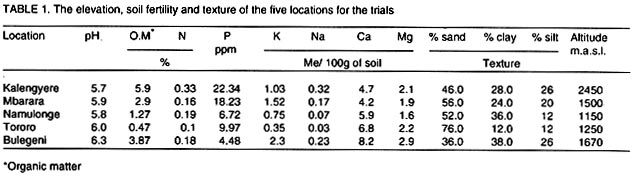
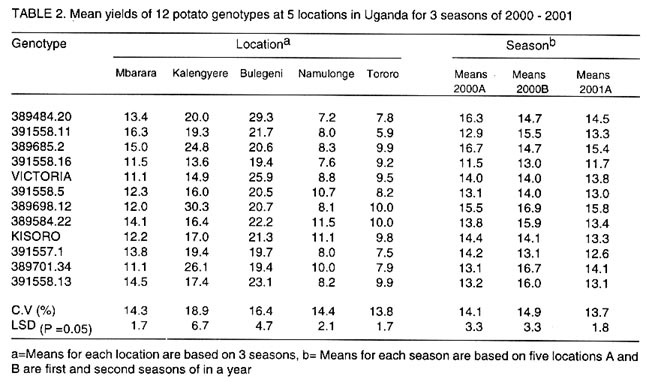
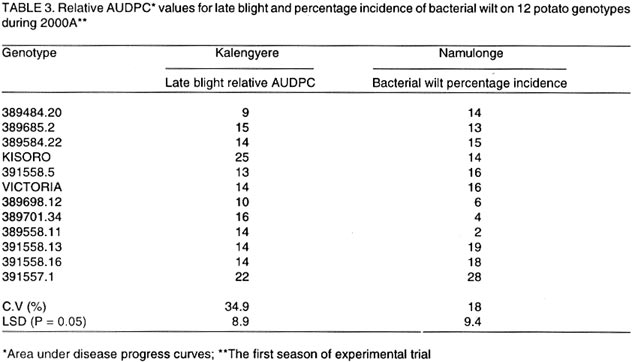
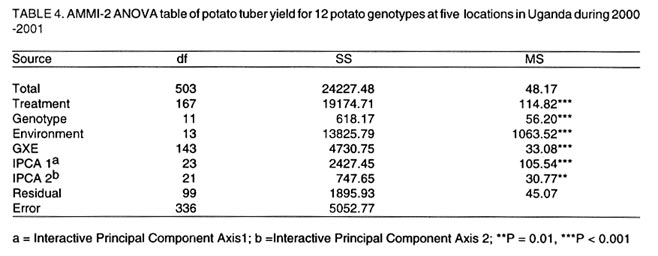
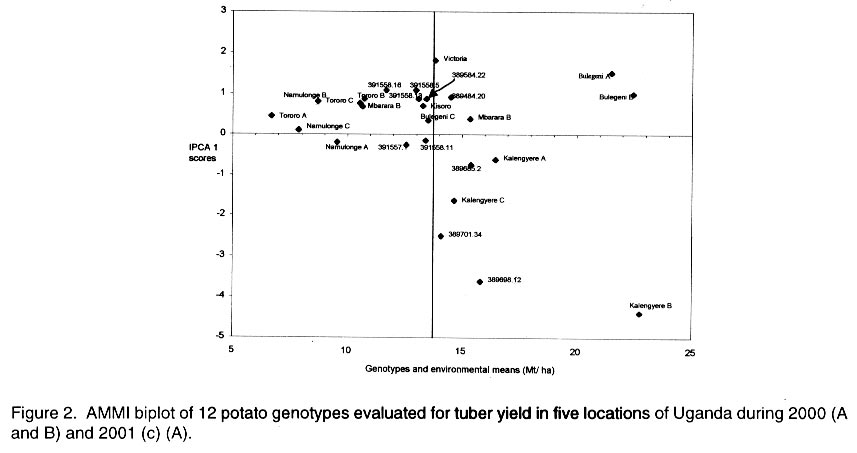
Received 15 January, 2001; Code Number: cs03002 ABSTRACT High yielding potato (Solanum tuberosum) genotypes with good levels of resistance to late blight were identified at Kalengyere Research Station in southwestern Uganda. The yield stability of these genotypes, however, remains uncertain. For instance, the performance of these genotypes varied over 4 seasons of evaluation and when tested at Kachwekano site. Genotype x environment interaction study was therefore required to determine their adaptation in the different agroecologies where the genotypes would be grown. Five sites in Uganda at different elevations were selected for the study and these were Kalengyere (2450 masl), Bulegeni (1670 masl), Mbarara (1500 masl), Tororo (1250 masl) and Namulonge (1150 masl). The trials were conducted for three seasons: namely 2000 (A and B) and 2001 (C) being the first (A) and second (B) and third (C) seasons of the trials. Each location for a particular season was regarded as one environment. Genotypes 389484.20, 389685.2, 389698.12, 389584.22 and 389701.34 performed better than the other genotypes in all the five locations. The G x E analysis was done using Additive Main effects and Multiplicative Interaction (AMMI) and the biplot identified genotypes 389484.20, 391558.16, Victoria, 391558.5, 389584.22, Kisoro and 391558.13 as adapted to Bulegen C, Mbarara B, Namulonge B and C and Tororo A, B and C. Genotypes 391558.11, 389685.2 and 391558.1 were adapted to Kalengyere A. Namulonge B and C and Tororo A, B and C were identified as similar environments basing on their responses. Key Words: Adaptation, AMMI analysis, Phytophthora infestans, Solanum tuberosum, yield stability RÉSUMÉ Les génotypes de patates à haut rendement (Solanum tuberosum) avec des bons niveaux de résistance à la brunissure tardive étaient identifiés à la station de recherche de Kalengyere en sud-ouest de l'Ouganda. La stabilité du rendement de ces génotypes, cependant, reste incertaine. Par exemple, la performance de ces génotypes a varié au delà de 4 saisons d'évaluation et au moment de l'épreuve au site de Kachwekano. L'étude d'intéraction génotype x environnement était ainsi donc nécessaire pour déterminer leur adaptation dans les différentes zones agro-écologiques où les génotypes seront germés. Cinq sites en Ouganda aux élévations différentes étaient séléctionnés pour l'étude notamment Kalengyere (2450 masl), Bulegeni (1670 masl), Mbarara (1500 masl), Tororo (1250 masl) et Namulonge (1150 masl). Les essais étaient conduits pour trois saisons : nommément 2000 (A et B) et 2001 (C) étant la première (A) et la seconde (B) et la troisième (C) saisons d'essais. Chaque emplacement pour une saison particulière était regardée comme un environnement. Les génotypes 389484,20 ; 389685,2 ; 389698,12 ; 389584,22 et 389701,34 ont eu une bonne performance que les autres génotypes dans tous les cinq emplacements. L'analyse de GxE était faite utilisant les principaux effets additifs et multiplicatifs d'intéraction (AMMI) et les génotypes double identifiés 389484,20 ; 391558,16 ; Victoria, 391558,5 ; 389584,22, Kisoro et 391558,13 comme adaptés à Bulegen C, Mbarara B, Namulonge B et C et Tororo A, B et C. Les génotypes 391558,11; 389685,2 et 391558,1 étaient adaptés à Kalengyere A. Namulonge B et C et Tororo A, B et C étaient identifiés comme des environnements similaires en se basant sur leurs réponses. Mots Clés: Adaptation, analyse AMMI, Phytophthora infestans, Solanum tuberosum, stabilité de rendement INTRODUCTION Selection for potato genotypes with high yield and resistance to late blight (Phytophthora infestans) continues to be a priority objective of most National Potato Programs in sub-Saharan Africa, Uganda inclusive. Uganda participates in the International Late Blight and Coordinated Regional Yield Trials in a bid to identify high yielding and late blight resistant varieties for the sub Saharan Africa region (Hakiza et al., 1997). In 1992 and 1993, the Uganda National Potato Program received two cohorts of diverse potato genotypes from the International Potato Centre (CIP), Lima, Peru. Only five promising genotypes were selected from each of the cohorts for advanced yield trials at Kalengyere in Southwestern Uganda in 1998 and 1999. The 10 potato genotypes were identified as high yielders (average of 20.2 t ha-1) with good resistance to late blight (average relative areas under disease progress curves, AUDPC of 12 %) (Abalo et al., 2001). The performance of genotypes varied significantly from season to season and location to location when tested at Kachwekano and Kalengyere (Abalo et al., 2001), which suggested the presence of genotype x environment (G x E) interaction. The G x E studies are of paramount importance in the specific environments in which the genotypes are to be grown (Ortiz and Ilse de Cauwer, 1999). The potato genotypes were therefore subjected to multilocational trials. The objectives of the study were twofold. Firstly, to determine the effect of G x E interaction on the yields (t ha-1) of elite potato genotypes. Secondly, to identify stable and adapted genotypes for the different agroecologies in Uganda. MATERIALS AND METHODS The multilocational trials were carried out at five locations that differed with respect to soil fertility, soil texture and elevations (Table 1). The trials were done for three seasons; namely 2000 (A and B) and 2001 (C) being the first, second and third seasons of the trials. At each location the genotypes were planted on ridges in a randomised complete block design with three replications. A spacing of 0.7 m x 0.3 m in 4-row-plots were adopted at all locations. The agronomic practices carried out included regular weeding, earthing up, three applications of Dithane M45 (Mancozeb 80% WP) at a rate of 2.5 kg ha-1 and dehaulming at maturity. Although the genotypes were selected on the basis of high yields and good levels of resistance to late blight, the genotypes had to be subject to applications of dithane M45. The spray was done because three of the five locations of the trials do not favour late blight epidemics and this could lead to a biased comparison of the genotypes from the different locations. Late blight severity (Henfling, 1987) and bacterial wilt incidence were recorded at Kalengyere and Namulonge, respectively. At harvest, tuber yields were assessed according to number of tubers per plant and mean tuber weight; these values together with plot size (4.5 m x 2.8 m) were used to calculate the overall yield (t ha-1). Temperature and rainfall data were recorded during the experimental period (Fig. 1). Late blight severity data were used to calculate areas under disease progress curves (AUDPC), which were subsequently standardized to give relative AUDPC (Campbell and Madden, 1990). AUDPC values, bacterial wilt incidence and yield data were subjected to analysis of variance (ANOVA) using the Mstatcpackage (Russell, D. Freed, Michigan State University, USA). Where the "F" statistics indicated significance, the means were separated using Fisher's protected Least Significance Difference test (LSD) at P= 0.05. To determine the effects of genotype x environment interactions on yields, the data were subjected to Additive Main effects and Multiplicative Interaction (AMMI) analysis using Matmodel Version 2.0 computer package (Gauch, 1990) and the biplot drawn. AMMI analysis was preferred in this study because of the advantage accrued to it over the usual breeders way of apportioning the variance of G x E. Regression analysis assumes linearity in the response of genotypes to the environments but AMMI analysis takes into account the non-linear response of genotypes to environmental variances making it an appropriate tool especially where the characteristic response of the environments are not known. In many situations, the major micro-environmental variables are not known exactly but they often include location and season effects in addition to the continual improvement in field fertility and change in plant handling techniques (Kearsey and Pooni, 1996). Because there was no physical measure of some of the climatic and edaphic factors, the approach used was to let the genotypes themselves access the environment. Therefore, a season in a particular location was considered as one environment. The AMMI biplot was developed by placing both genotype and environment means on the x-axis or abscissa, and the respective eigenvectors or scores (IPCA 1) on the y-axis or ordinate (Zobel, 1990). Genotypes or (environments) which appear almost on a perpendicular line have similar means, those falling on a horizontal line have similar interaction patterns. Genotypes (or environments) with large first IPCA scores (either plus or minus) have large interaction; those with values close to zero have small interaction (Hill et al., 1998; Steyn et al., 1993), and are considered stable. RESULTS AND DISCUSSION Yield performance of the genotypes. The study was based on mainly yields while other agronomic traits such earliness of maturity was not included in the study because the genotypes were all of similar maturity group. The analysis of variance (not shown) showed that the genotypes were significantly (P = 0.01) different in tuber yield over seasons and locations. There were also significant (P = 0.001) interactions for genotypes x location, location x season (P = 0.001) and season x genotype x location (P = 0.01). The highest yields were recorded at Bulegeni and Kalengyere with average yields of 22 and 19.6 t ha-1, respectively (Table 2). Lower yields were obtained at Namulonge and Tororo where yields averaged only 9.0 and 8.8 t ha-1, respectively. Genotypes 389484.20, 389685.2, 389698.12, 389584.22 and 389701.34 performed better than the other genotypes in all the five locations. The combined means over locations identified 389685.2 (16.7 t ha-1) as the best yielding genotype and 391558.16 (11.5 t ha-1) as poorest genotype for 2000A. Genotypes 389698.12 (16.9 t ha-1), 389701.34 (16.7 t ha-1) and 391558.13 (16.0 t ha-1) ranked best in 2000B and least yields were observed from genotypes 391558.16 (13.0 t ha-1) and 391557.1 (13.1 t ha-1). The results of the study satisfied one of the breeders' goals of selecting for such varieties with acceptable yield. Yield performance at Kalengyere and Bulegeni in all the seasons ranged from 13.6 to 30.3 t ha-1 and 19.4 to 29.3 t ha-1, respectively. These yield ranges are above the Uganda national average yields of 7.0 t ha-1 (Abalo et al., 2001; Adipala et al., 2001a; Adipala et al., 2001b). For Tororo site, yields were low during all the seasons, however, the best genotypes were 389698.12 and 389584.22 each with average yields of 10 t ha-1. Potato yield during 2000B and 2001A were better than during the 2000A. This was because first season was affected by the long drought and late rainfall. High temperature and little rainfall amount are known to limit tuber bulking (Steyn et al., 1993; Abalo et al., 2001). Tuber yields for the genotypes at Namulonge were low during 2000A. This was partly due to bacterial wilt infestation, which hit the trial during the season (Table 3). The inoculum was probably in the soil since the seed tubers were obtained from Kalengyere Research Station and were bacteria wilt-free. Besides, wilt only attacked the trial at Namulonge site and no wilting was observed at other locations. Stability and adaptation of the genotypes. Analysis of stability and adaptation of genotypes for yields were done using Additive Main effect and Multiplicative Interaction (AMMI) model. The AMMI analysis of variance for tuber yield (Table 4) indicated that genotypes and environments were significantly (P < 0.01) different and G x E interaction was also very significant (P < 0.001). The AMMI2 model supplied an adequate fit to the data since only two interaction principal component axes (IPCA) were significant (P < 0.001). The sum of squares for genotypes, environment and IPCA 1 and 2 provided 92% of treatment sum of squares indicating that AMM12 model effectively partitioned treatments sum of squares (Steyn et al., 1993). Hence the treatment sum of squares contains 92% pattern related to treatment design and 8% noise related to experimental design. The AMMI analysis also revealed that the environment (obtained as location by season combined), genotypes and G x E were highly significant (P < 0.05) for tuber yield and accounted for 72.1 %, 3.2 % and 24.7 % of the treatment sum of squares, respectively. This result indicated that the proportion of environmental and G x E interaction variation for tuber yield was much larger than that due to genotypes main effects. These results concurred with results of many studies on G x E (IITA, 1993; Gauch and Zobel, 1996; Dixon and Nukenine, 1997), which have shown that the proportion of sum of squares due to difference among sites ranged from 40 - 90 % and G x E was usually larger than genotypes main effects. It also implied that yield was affected by both the environment and the G x E interaction effects (Ntawuruhunga et al., 2001). The analysis of the biplot (Fig. 2) revealed that genotypes 389484.20 and 391558.5 were high yielding and positively interactive. Likewise, Bulegeni A and B and Mbarara A were identified as high yielding environments with positive IPCA 1 values. Conversely, Kalengyere A, B and C were identified as high yielding but with negative interactions. The biplot also ranked Mbarara B, Namulonge B and C, Tororo A, B and C and Bulegeni C as low yielding environments but with positive IPCA scores. The results identified genotypes 389484.20, 391558.16, Victoria, 391558.5, 389584.22, Kisoro and 391558.13 as adapted to Bulegeni C, Mbarara B, Namulonge B and Tororo A and B as they had positive values for IPCA 1 (Steyn et al., 1993). Genotypes 391558.11, 389685.2, and 391557.1 were observed to be adapted to Kalengyere A. Soil fertility levels (Table 1), average temperatures and rainfall distribution (Fig. 1) were probably the main factors that affected the genotypes. The environments with cool temperatures and high rainfall amount (Kalengyere A and B) favoured late blight infection causing a large negative contribution to G x E effects (Table 3). Environment Namulonge A contributed negatively to the interaction because of warm temperature and presence of bacterial wilt in the soil, which affected the yield. The AMMI analysis helped in classifying the test sites. Both first and second seasons of 2000 at Bulegeni were classified as similar environments. Tororo A, B and C, Namulonge B and C and Mbarara B were grouped together by AMMI. Site selection according to similarity of response helps in elimination of expensive and inaccessible sites from multilocational trial sites (Hill et al., 1998). The biplot for tuber yields facilitated the identification of the stable genotypes and those adapted to specific locations. The study identified two stable genotypes, 391558.11 and 391557.1. No high yielding genotype showed stability and this collaborates earlier findings of Hill et al. (1998) that yield stability can only be expected from low yielding genotypes that do not benefit from favourable environments. CONCLUSION The study showed that the proportion of environmental variance and the G x E interaction were greater than genotypic variance indicating that the genotypes were closely related but responded differently to the differences in environments. It is apparent that one could rely more on crop management and suitability of the environment to attain high yields rather than the genotypic differences. The similarities identified in the trial sites will be useful for future regional and even international multilocational trial sites. The best genotypes identified in the study should be tested on-farm under farmers' own practices. This is to assess their performance and compare the genotypes with the local cultivars. They could perhaps be grown under traditional cropping system so that farmers can select varieties that would satisfy their needs and expectations. ACKNOWLEDGEMENT The study was funded by The Rockefeller Foundation (Grant RF 99006#145) and the International Potato Centre (CIP). Thanks are due to NARO-Uganda, P. Ntawuruhunga and B. Mateeka for their technical support. REFERENCES
©2003, African Crop Science Society The following images related to this document are available:Photo images[cs03002t4.jpg] [cs03002t2.jpg] [cs03002t1.jpg] [cs03002f1.jpg] [cs03002t3.jpg] [cs03002f2.jpg] |
| |||||||||
