 |
| About Bioline | All Journals | Testimonials | Membership | News |
|
||||||
|
||||||
African Crop Science Journal, Vol. 11. No. 2, 2003, pp. 75-85 ASSESSMENT OF GENETIC VARIATION AMONG EAST AFRICAN Cercospora zeae-maydis P. Okori, J. Fahleson, P.R. Rubaihayo1, E. Adipala1 and C. Dixelius
Department of Plant Biology, Swedish University of Agricultural Sciences, P.O. Box 7080, (Received 7 March, 2003; accepted 2 May, 2003) Code Number: cs03010 ABSTRACT Rapid flagement length polymorphism (RFLP) and amplified flagement length polymorphism (AFLP) analyses were used to study genetic diversity of Cercospora zeae-maydis isolates collected from Uganda, Kenya and Rwanda. For comparative purposes, isolates from Zimbabwe and the United States of America (USA) were included. Phylogenetic analysis of AFLP data revealed two major clusters. One large cluster comprised of 75 African and US group II isolates and the second comprised cluster of 4 USA group I isolates. Similar groupings were observed with RFLP data. Analysis of molecular variation (AMOVA) based on AFLP data revealed a significant population structure between American and African populations (φ FST = 0.07). No population structure was detected, among African isolates (φ FST = 0.01), while a strong and significant structure was obtained between the two pathotypes (φ FST = 0.19). The AMOVA using RFLP data, showed absence of a population structure among African populations (φ FST = 0.01), and gene flow among African populations was high (49.5). These findings suggest that group II pathotype is predominant in East Africa and gene flow appears to be the fundamental evolutionary force accounting for the current genetic structure. A regional approach to abate epidemics is most suitable. Key Words: AFLP, AMOVA, gene flow, isolates, RFP, Zea mays RÉSUMÉ Les analyses de polymorphisme rapide de flagellation de longueur (RFLP) et le polymorphisme amplifié e flagellation de longueur (AFLP) étaient utilisées pour étudier la diversité génetique des substances de Cercospora zeae-maydis collectées à partir de l'Ouganda, Kenya et Rwanda. Pour des raisons comparatives, les substances de Zimbabwe et des Etats-unis d'Amérique étaient inclues. L'analyse phylogénique de donnée de l'AFLP a révélée deux bouquets majeurs. Un large bouquet a compris des substances de 75 Africaines et groupe II des US et le second bouquet a compris des substances de 4 USA groupe I. Des groupements similaires étaient observés avec la donnée de RFLP. L'analyse de variation moléculaire (AMOVA) basée sur la donnée d'AFLP a révelé une structure significative de population entre les population Américaine et Africaine (φ FST =0,07). Aucune structure de population était détectée parmi les substances Africaines (φ FST =0,19). L'AMOVA utilisant la donnée de RFLP, a montré une absence d'une structure de population parmi les populations Africaines (φ FST =0,01), et un volume des génes parmi les populations Africaines était élevé (49.5). Les résultats suggèrent que le pathotype de groupe II est prédominant en Afrique de l'Est et le volume de gènes apparait être la force évolutive fondamentale comptant pour la structure génetique courante. Une approache régionale de baisser les épidémies est plus valable. Mots Clés: AFLP, AMOVA, volume de gènes, substances, RFP, Zea mays INTRODUCTION Maize (Zea mays L.) is a major staple and cash crop in sub-Saharan Africa. Over the past decade, grey leaf spot, a foliar disease caused by the Deuteromycete Cercospora zeae-maydis Tehon and Daniels, has emerged as a major threat to maize production in the region (Okori et al., 2001). The disease causes yield losses of up to 65% (Pratt et al., 1997; Ward et al., 1999). In the USA corn belt, grey leaf spot has progressively destroyed maize since it was first reported in 1925 (Latterel and Rossi, 1983; Ward et al., 1999). Spread of this disease in USA and other temperate regions has been attributed to wide-scale adoption of conservation tillage and monoculture. In sub-Saharan Africa, epidemics could be attributed to changes from long rotation cycles to short ones and continuous cropping, promoting rapid inoculum build up (Bigirwa et al., 1998). Such changes in cropping patterns may impact on pathogen populations by influencing evolutionary processes, speeding up emergence of novel genotypes which favour severe disease outbreaks. This makes genetic studies of outmost importance to unravel genetic structures and evolutionary forces influencing pathogen population as a first step in development of appropriate and efficient control measures. Population studies can be executed speedily and accurately using a wide array of selectively neutral DNA-based markers, like the amplified fragment length polymorphism (AFLP) and restriction fragment length polymorphism (RFLP). Genetic structure may be studied using single markers or multiple genetic markers. However, simultaneous analyses using neutral marker systems increase the power to disentangle effects of different evolutionary forces such as gene flow (Mitton, 1994; Neigel, 1997; Ross et al., 1999). Cercospora zeae-maydis populations in USA have been studied using AFLP, and restriction analysis of 5.8S ribosomal DNA, and internal transcribed spacer regions (Wang et al., 1998; Dunkle and Levy, 2000). These studies revealed the occurrence of two C. zeae-maydis pathotypes, group I and II, and demonstrated presence of the group II pathotype in Africa. However, no extensive studies of East African C. zeae-maydis populations have been done. Hence, to make comparisons possible, AFLP analysis was applied on an extended African C. zeae-maydis collection in the present investigation, together with evaluations based on RFLP analysis. Simultaneous use of AFLP and RFLP analysis is envisaged to generate data on key evolutionary forces operative in a population together with other important properties (Leung et al., 1993; Milgroom and Fry, 1997; Ross et al., 1999). Thus, the goal of the present investigation was to investigate the genetic diversity of East African C. zeae-maydis populations by comparing genetic data from AFLP and RFLP analysis to learn if coherent and complementary views of the roles of different evolutionary forces can be obtained, and applied in the design of control strategies. MATERIALS AND METHODS Sampling and culture of the pathogen. Infected maize leaves were collected from maize fields in Uganda, Kenya, Rwanda, and for comparative purposes, isolates from USA and Zimbabwe were included (Table 1). At each sampling site, 2 to 5 leaf samples were collected at 20 m intervals in cases of large fields or from neighbouring fields in the same location. The leaf samples were air dried for between 4 to 7 days and then stored at room temperature. One lesion was cut out from each leaf sample, surface sterilised using 0.5% sodium hypochlorite, rinsed twice in sterile distilled water, placed on moist paper in a Petri dish and incubated for 12 to 48 h to stimulate sporulation. Conidia were dislodged from the leaf tissue using sterile distilled water and distributed on potato dextrose agar (PDA) plates (Difco, Becton Dickinson, Microbiology Systems, MD, USA), and cultured under light for 16 h at 22 °C and in darkness for 8 h at 16 °C. Using hyphal tip transfer from distinct colonies to fresh V8 juice agar plates (Beckman and Payne, 1983), monoconidial cultures of the isolates were established.
*Roman numerals designate isolates collected either from same field or from different fields in the same location aIsolates that persistently produced cercosporin on PDA DNA isolation. To obtain mycelium for DNA isolation, a culture plug of each isolate was used to inoculate 100 ml of potato dextrose broth media (PDB) (Difco). The cultures were placed on a rotary shaker and allowed to grow for 10-14 days under the same light and temperature regimes as described above. Mycelium was harvested by draining off excess media and freeze-dried for 48 h using an Edwards freeze dryer (Edwards High Vacuum International, West Sussex, England). Dried samples were sealed in Petri dishes and stored at 4 °C or directly used for DNA isolation as described by Möller et al. (1992) or by modification of the CTAB method developed by McDonald and Martinez (1990). The extraction buffer used contained 1.4 M NaCl, 1% 2-mecaptoethanol (v/v), 2% CTAB (w/v) and 10 mM Tris-HCl pH 8.0 and the extraction time was increased to 45-60 min. The first chlorofom: isoamlyalcohol (24:1) incubation was performed for 30 min on a shaker before spinning the emulsion at 1655 x g. Isolated DNA was treated with RNaseA as described by Steventon et al. (2002). AFLP analysis. The AFLP analysis was performed by modification of the AFLP procedure of Fahleson et al. (2003). All primers used in different steps are listed in Table 2. For the selective amplification step, five primer combinations were used (Table 3). In general, 100-150 fragments (observed as peaks on electrophorograms) were amplified by each of the selected primer combination. The AFLP peaks were analysed using GeneScan AnalysisTM, 2.1 and GenotyperTM, version 2.0 (Perkin Elmer/Applied Biosystems). GeneScan was used to generate a data matrix in form of electrophorograms from the gel run and Genotyper was used to generate a binary data matrix from GeneScan files. In order to generate high quality fragments from the electro-phorograms, the window for analysis was set to between 100-450 base pairs. Overlapping peaks, ambiguous peaks and noise signals were eliminated by selecting peaks that attained a scaled height of 100 and by using the overlap skip function as described by the manufacturer (Perkin Elmer/Applied Biosystems). Selected peaks were scored and recorded in a binary matrix that was used for all the analyses.
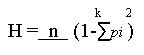
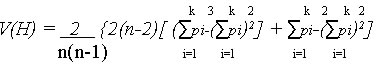
Development of RFLP probes. A genomic library was constructed using one East African C. zeae-maydis isolate CZm2a. Both fungal DNA and the plasmid pUC18 were digested with EcoRI (MBI Fermentas AB, Labassco, Sweden). DNA was subsequently ligated and transformed into competent cells of the E. coli strain DH5a following standard procedures (Sambrook et al., 1989). Successful transformants were selected using α-complementation as demonstrated in earlier studies (Sambrook et al., 1989). Three hundred clones were obtained and randomly selected as probes for use in RFLP analysis. Restriction digests, Southern blotting and hybridisation. Total genomic DNA (5 µg) from all the 30 C. zeae-maydis isolates was digested with either EcoRI, or HindIII and separated on 0.8% agarose gels using 1 x TAE buffer system (Sambrook et al., 1989). Alkaline blotting was done using Hybond N+ nylon membranes (Amersham Pharmacia Biotech, Uppsala, Sweden) as described by the manufacturer. The fungal DNA cloned in pUC18 were used as probes after EcoRI restriction and gel purification. The probe DNA was labelled using a random priming α-32P dCTP oligolabelling kit (Amersham Pharmacia Biotech) and hybridised to the DNA of the samples at 65°C overnight, as described by the manufacturer. The filters were washed twice with 2 x SSC, 0.1% SDS at 65°C for 15 minutes, followed by two washes in 0.2 x SSC, 0.1 % SDS for 30 min at room temperature. The filters were exposed to Kodak X-OMAT AR film (Eastman Kodak Company, Rochester, New York, USA) for a period of up to 2 weeks and scored for polymorphism. Two types of data were obtained, single or low copy (with less than five bands) and repetitive or multi-copy with more than 5 bands. Each probe and enzyme combination was treated as a different RFLP locus and the fragment size variants detected by each probe treated as alleles at that locus. Alleles at different loci were first screened and later combined to constitute multi-locus RFLP genotypes. In cases where isolates exhibited the same multi-locus RFLP genotype, only one isolate was used in analysis for purposes of eliminating the effect of repeated sampling of similar genotypes. Phylogenetic and population structure analysis. Data generated from the AFLP and RFLP analysis was subjected to phylogenetic analysis by employing the Neighbour-joining method in TREECON version 1.3b (Van de Peer and De Wachter, 1994). Robustness of the dendogram was tested by bootstrap analysis of 1000 replicates. For genetic analyses, the AFLP data was treated as haplotypic, comprising of a combination of alleles at one or several loci (Schneider et al., 2000). Each fragment was considered as a single locus. For the RFLP data, the pooled multi-locus RFLP genotypes were used. The data was tested for presence of population or genetic structure by analysis of molecular variation (AMOVA) (Excoffier et al., 1992) using Arlequin version 2 (Schneider et al., 2000). For this purpose, C. zeae-maydis populations were structured following three criteria 1) country wise (within African populations, 2) continent wise (African and USA) and 3) pathotype wise as group I and II. Gene flow among the populations was investigated by estimating Nm values that is the number of immigrants per generation from Wright's Fst (Slatkin and Barton, 1989). Fst and Nm values were computed following an "island model" using Arlequin (Schneider et al., 2000). Nm was derived from the relationship M = absolute number of emigrants exchanged between two populations. For haploid populations M is divided by 2 = Nm. Gene diversity (H) i.e. the probability that two randomly chosen haplotypes are different in a sample was also calculated. Gene diversity has been recommended as an appropriate measure of genetic variability especially among inbred populations as is the case for C. zeae-maydis (Weir, 1996). and its sampling variance were computed as:
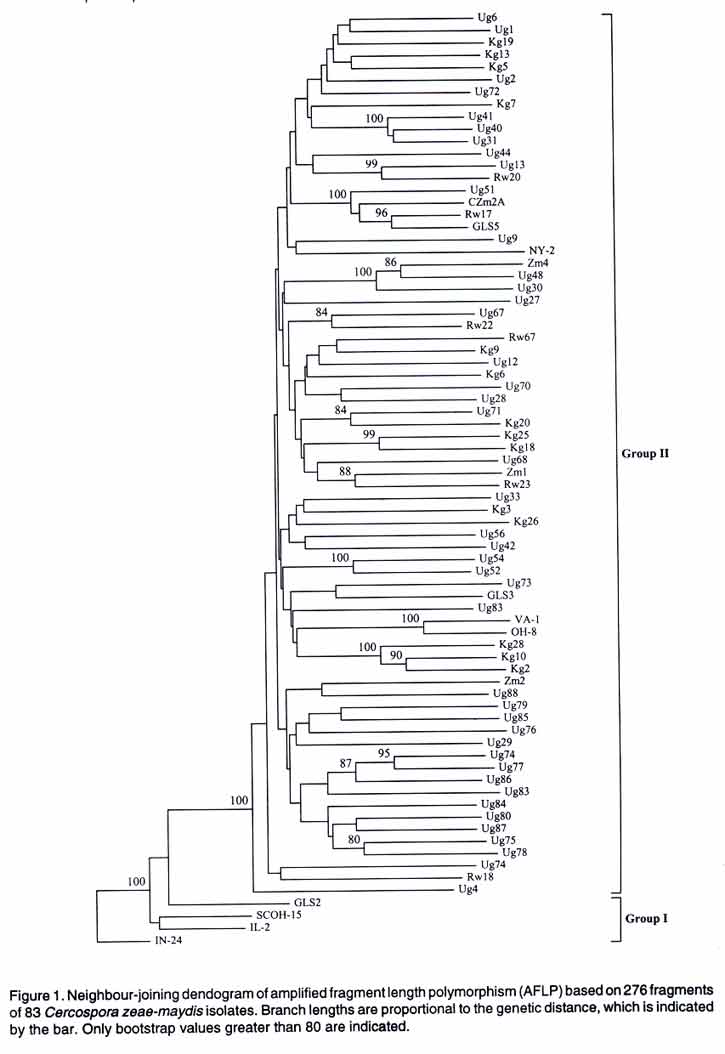
where n is the number of gene copies in the sample, k is the number of haplotypes and Pi is the sample frequency of the ith haplotype (Nei, 1987). The values were compared by t-test as suggested by Nei (1987). RESULTS Phylogenetic analysis. Neighbour-joining analysis of AFLP data based on 83 isolates revealed two major groups. The major group with 75 African isolates clustered with 5 USA group II isolates. The remaining USA isolates (IN24, IL2, SCOH 1-5, GLS2) clustering into a small but distinct second group, known as pathotype I supported by bootstrap value of 100 (Fig. 1). Both pathotype clusters were variable with subgroups supported by bootstrap values of over 95. Group II isolates had more polymorphic loci and a significantly higher gene diversity than group I (t = 2.78, P < 0.001) (Table 4).
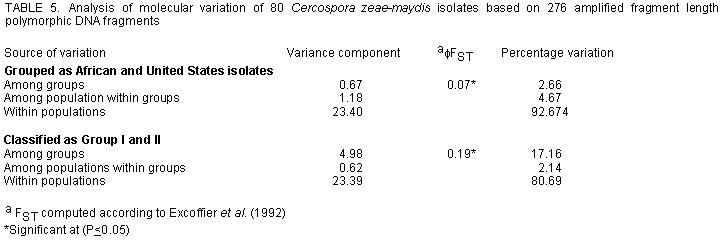
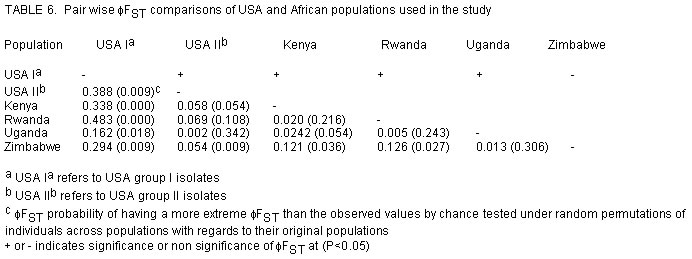
aComputed as described by Nei (1987). RFLP data generated a dendogram similar to that drawn from AFLP data (data not shown). The number of polymorphic loci varied among populations or pathotypes that is, American or African and group I or II, respectively. These variations did not follow the same pattern as AFLP data and were in general higher than AFLP polymorphic levels (Table 4). Gene diversity for the three test groups was not significantly different (t = 6.314, P = 0.08), but was higher than those obtained from AFLP data (Table 4). In the RFLP analysis 87 probes corresponding to 87 loci were analysed. Alleles per locus ranged from 1 to over 10 with an average number of 4.4. Population structure. Analysis of molecular variation (AMOVA) of AFLP data on the basis of geographic locations (Africa vs. USA) revealed the presence of a population structure (φ FST = 0.07, P = 0.002) (Table 5). Conversely, no population structure was detected within African group II isolates (0.01, P= 0.07). Comparison on basis of pathotype (group I and II, respectively) provided strong support for the existence of these pathotypes (φ FST = 0.19, P = 0.001) (Table 5). Pair-wise φ FST comparisons revealed non-significant differences among and between African and US group II but significant differences when the two groups were compared with USA group I isolates (Table 6). Due to the small sample size of group I isolates, AMOVA of RFLP data was restricted to continent level (Africa and USA). The AMOVA results provided no support for a population structure (φ FST = 0.01, P = 0.17). Gene flow between African populations was 49.5 calculated from φ FST. DISCUSSION The main objective of this work was to investigate genetic diversity of East African C. zeae-maydis populations by comparing information derived from AFLP and RFLP data. Results showed for the first time the amount of genetic diversity of C. zeae-maydis in this region. Clearly there is a genetic structure between American and African populations of C. zeae-maydis with the latter population consisting mainly of one pathotype, group II. Moreover, in spite of the small sample size in the case of group I isolates, both phenetic and AMOVA analysis suggests a relatively higher genetic diversity in the group II pathotype indicative of larger evolutionary potentials. The high gene diversity found is similar to results reported for other Deuteromycete fungi e.g., Collectorichum graminicola whose gene diversity was reported to be 0.215 and classified as high (Rosewich et al., 1998). Furthermore, spatial distribution of genetic diversity among and within East African populations was limited. A similar pattern was reported for US group II isolates, which are, geographically restricted to the eastern coast, unlike group I that is widely distributed in the US and other parts of the world (Wang et al., 1998; Dunkle and Levy, 2000). It is not clear what might account for this similarity in spatial distribution of group II C. zeae-maydis in Africa and USA. The remarkable genetic similarity observed suggests, however, that genetic responses of the two populations to evolutionary forces may be analogous. Within East Africa the absence of a population structure indicates a common source of this pathogen or population homogenising effects of gene flow. It has been shown that Nm values greater than 1 imply that gene flow is strong enough to prevent substantial fixation of selectively neutral alleles in populations, preventing development of genetic structures (Wright, 1951; Slatkin and Barton, 1989). East African populations had an Nm value of 49.5, implying a strong gene flow may have occurred or is prevalent. Gene flow within East Africa or between continents could be attributed to seed trade both locally, and internationally and be liable for the rapid spread of the disease in many parts of the continent. Most cultivars grown are susceptible and given unrestricted movement of maize, disease spread is inevitable. Examples of pathogens where gene flow reportedly plays a significant role in disease epiphytotics and limits population differentiation include Rhizoctonia solani in Texas, USA (Rosewich et al., 1998) and Erysiphe graminis in Europe (Wolfe et al., 1992). The data from the AFLP and RFLP analyses were concordant in most cases and phenetic analyses generated similar tree typologies. However, the RFLP approach detected more variability than AFLP analysis as shown by the relatively higher gene diversities and larger numbers of polymorphic loci scored per locus. In spite of the low levels of polymorphism usually detected by AFLPs, they provide for simultaneous analysis many bands per lane. Our data shows that RFLPs had up to 8 bands per locus while AFLP had an average of 50. Simultaneous analysis of many bands such as those produced by AFLP are useful for intra-species analysis (Powel et al., 1996). Similar reports have been made in population analyses of fire ant (Ross et al., 1999) and barley accessions (Russel et al., 1997) using AFLP, RFLP, RAPDs and other molecular markers. Concordance in patterns of genetic structure among neutral nuclear markers, as was the case in this investigation, indicates the role of gene flow in the population (Lewontin and Krakauer, 1973; Mitton, 1994; Estoup et al., 1998; Ross et al., 1999). Indeed, indirect estimates of gene flow were high in this study, providing a strong basis to speculate on the possible role of material movement between the two continents or within East Africa as being the major factor in observed spatial patterns of C. zeae-maydis genetic structure. The present study employed a multiple marker approach to identify the key evolutionary force acting upon East African populations. This approach is particularly useful in cases where there is limited bio-geographical data regarding a given pathogen as is the case with C. zeae-maydis in Africa. This investigation showed absence of a genetic structure among populations, prevalence of one pathotype and a possible role of gene flow within and across national frontiers. Since grey leaf spot is endemic to most African countries, and given that gene flow is the major evolutionary force active in C. zeae-maydis populations, a regional approach to abate epidemics is most suitable. In cereals host resistance is the economical way to control diseases and pests. As such, it is suggested that breeding programmes should preferably test lines at multi-regional locations to offset the pathogens' movement effects. Breeding programmes should also include rotation of varieties as a core part of their activities to stem resistance breakdown resulting from any new fungal incursion. ACKNOWLEDGEMENTS This study was funded by the Sida/SAREC East African Biotechnology Network (BIO-EARN) project number 771799. The USA isolates were kindly provided by Dr. L. D. Dunkle, USDA, Department of Botany and Plant Pathology, Purdue University West Lafayette, Indiana. The Zimbabwe isolates were provided by Dr. Kevin Pixley, the International Maize and Wheat Improvement Center (CIMMYT), Harare, Zimbabwe. REFERENCES
©2003, African Crop Science Society The following images related to this document are available:Photo images[cs03010t6.jpg] [cs03010t5.jpg] [cs03010f1.jpg] |
| |||||||||
