 |
| About Bioline | All Journals | Testimonials | Membership | News |
|
||||||
|
||||||
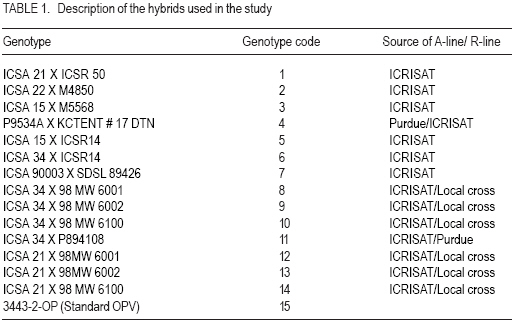
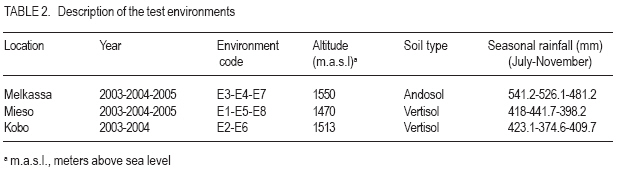
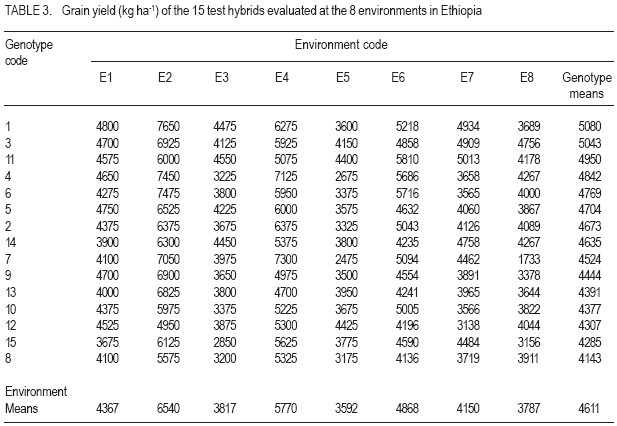
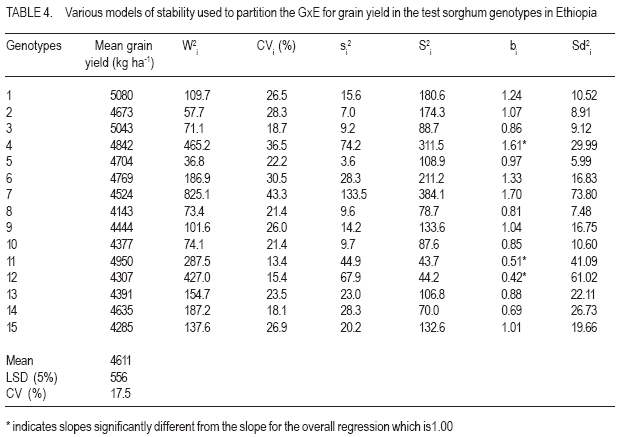
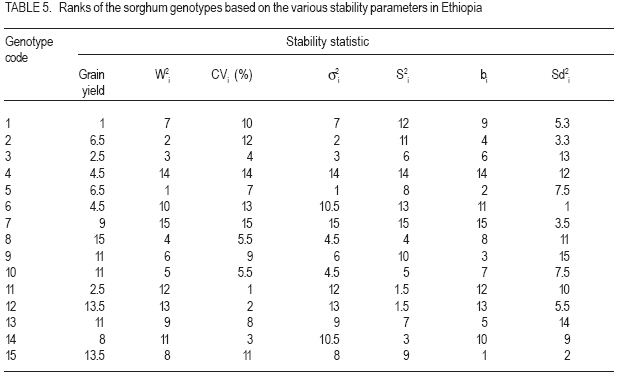
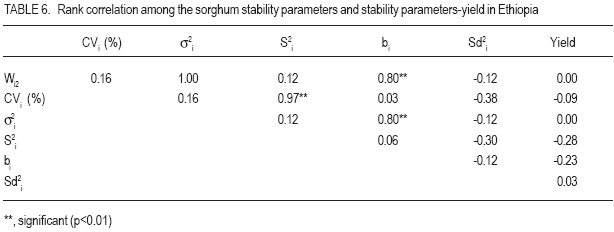
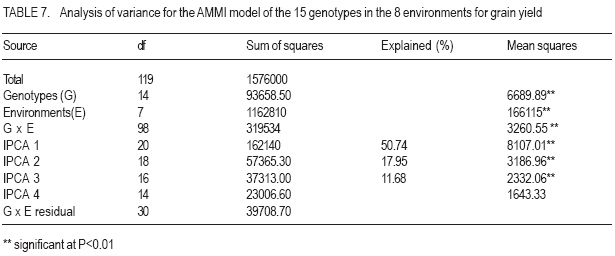
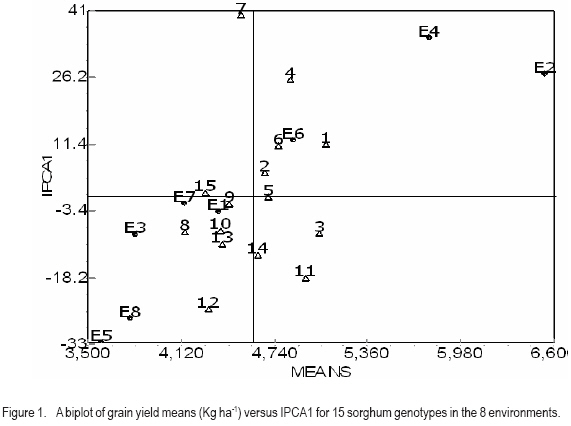
African Crop Science Journal, Vol. 15, No. 2, June, 2007, pp. 83-92 Assessment of Yield Stability in Sorghum Asfaw Adugna Melkassa Agricultural Research Center, P.O.Box 436, Nazareth, Ethiopia Received 29 November 2006; accepted February, 2007 Code Number: cs07010 ABSTRACT Sorghum (Sorghum bicolor L. (Moench)) is the third major cereal crop in Ethiopia in terms of area and production next to tef (Eragrostis tef) and maize (Zea mays). It is the major crop in drought stressed lowland areas that cover 66% of the total arable land in the country. Yield stability is one of the setbacks facing plant breeders in developing widely adapted varieties with superior yield. The present study was carried out to investigate the effect of genotype by environment (GxE) on the yield stability of sorghum (Sorghum bicolor) using fifteen genotypes in eight environments (Locations x years combination). There were significant differences among the genotypes, the environments and GxE interactions. Thus, the three types of univariate stability models: Type1 (CVi and S2i), Type-2 (W2i, s2i, and bi) and Type-3 (Sd2i) were compared for ranking of the genotypes. The parameters of W2i and si2 had perfect positive correlation (r=1.0) and strong positive correlation with bi (r=0.80), but either weak or no correlation with the rest of the parameters. Similarly, CVi and S2i had strong rank correlation (r=0.97) but both had either very weak or no rank correlation with the rest of the parameters tested. The Sd2i had very weak negative correlation with the remaining parameters. Based on the three stability statistics, the different genotypes were classified as stable. To compliment and verify findings of this univariate approach, the GxE which uses a mulivariate approach was used. The multivariate approach (AMMI model) gives a broader inference. Based on the AMMI model, genotypes 2 and 5 were the most stable, although genotypes 1 and 3 had satisfactory levels of yield performance as well as stability. Therefore, these four genotypes with wider adaptation are recommended for sorghum growing dry lowlands of the country. Key Words: AMMI model, Ethiopia, GxE, hybrids, Sorghum bicolor RÉSUMÉ Le Sorgho (Sorghum bicolor L. (Moench)) représente la 3e principale céréale en Ethiopie, en termes de superficie de production, après le Tef (Eragrostis tef) et le maïs (Zea mays). Il est par ailleurs la culture majeure dans les zones de stress due à la sécheresse au sein des basses terres couvrant 66% de la superficie arable totale du pays. La stabilité du rendement constitue l’une des difficultés que rencontrent les agriculteurs dans le développement de variétés largement adaptées et présentant un rendement supérieur. La présente étude était menée dans le but d’établir par investigations l’effet du genotype et de l’environnement (GXE) sur la stabilité du rendement du sorgho (Sorghum bicolor) par l’utilisation de 15 génotypes au sein de huit environnements (sites x combinaisonannées). Il y avait des différences significatives parmi les génotypes, les environnements ainsi que les interactions GXE. Par conséquent, produisant les 3 types de modèles de stabilité à variable unique: Type -1 (CVi et S2i), Type - 2 (W2i S2i et bi) et type -3 (sd2i) étaient comparés pour un classement de génotypes. Les paramètres de W2i et Si2 avaient une corrélation positive parfaite (r = 1,0) et une forte corrélation positive avec bi (r = 0,80), mais présentaient une faible ou aucune corrélation avec le reste des paramètres. De façon similaire, CVi et S2i avaient une forte corrélation de classement (r = 0,97) mais le deux avaient soit une très faible ou aucune corrélation de classement avec le reste de paramètres testés. Le sd2i avait une corrélation négative très faible avec les autres paramètres restants. Se basant sur les 3 statistiques de stabilité; les différents génotypes étaient classifiés comme stables. En vue de pouvoir compléter et vérifier les résultants par cette approche à variable unique, le GXE qui utilise une approche à multi variants a été utilisé. Cette dernière approche (AMMI Model) donne une large déduction. Se basant sur le modèle MMI, les génotypes 2 et 5 étaient les plus stables bien que les génotypes 1 et 3 montraient des niveaux satisfaisants de performance en matière de rendement et de stabilité. Ainsi ces 4 génotypes a plus stable adaptation sont recommandes pour la culture de sorgho dans les région sèches et a basse altitude dans le pays. Mots Clés: Modèle AMMI, Ethiopie, GxE, hybrides, Sorghum bicolor INTRODUCTION Sorghum (Sorghum bicolor L. (Moench)) is the third major cereal crop in Ethiopia in terms of area and production next to tef (Eragrostis tef) and maize (Zea mays). It is the major crop in drought stressed lowland areas that cover 66% of the total arable land in the country (Gebeyehu et al., 2004). These areas are characterised by limited and erratic rainfall, and hot temperature. A major challenge of sorghum production in these parts of the country is lack of high yielding and stable varieties. Variety development for these parts of the country has focussed on selection of early maturing varieties that can escape drought. For the last nearly half a century, a number of early sorghum open-pollinated varieties were developed and released for these areas. The concepts of GxE and yield stability have been issues to the breeders and biometricians for a long of time. A significant GxE for a quantitative trait is known to reduce the usefulness of the genotype means over all locations or environments for selecting and advancing superior genotypes to the next stage of selection (Pham and Kang, 1988). If there were no GxE associated with the genotypeenvironment system relevant to a breeding objective, selection would be greatly simplified because the ‘best’ genotype in one environment would also be the ‘best’ genotype for all target environments (Basford and Cooper, 1998). Furthermore, variety trials would be conducted at only one location to provide universal results (Gauch and Zobel, 1996). Though the concept of stability is largely unclear in the plant breeding literature partly due to the myriad of definitions that have been used to represent this concept (Basford and Cooper, 1998), it is a powerful tool to partition the GxE into mean squares responsible for its occurrence. High yield stability usually refers to a genotype’s ability to perform consistently, whether at high or low yield levels, across a wide range of environments (Annicchiarico, 2002). The ultimate reason for differential stability among genotypes and for differential results from various test environments is non-repeatable GxE (Yan and Hunt, 2002). So far, a vast number of univariate and multivariate, parametric and non-parametric stability models, have been suggested to asses the causes of GxE. The model that has been in frequent use by breeders is one that is based on linear regression. This was first proposed by Finlay and Wilkinson (1963). Eberhart and Russel (1966) later modified it and suggested a different selection measure of stability of a genotype based on high mean yield, unit linear regression and low deviation from regression. This concept of selecting a genotype based on high mean yield and stability was later given the term yield reliability (Kang and Pham, 1991; Eskridge, 1990 and Evans, 1993). A reliable genotype is characterized by consistently high yield across environments (Annicchiarico, 2002), though its occurrence is rare and its measurement is difficult or uncertain. According to Kang (1998) and Piepho (1998) the assessment of yield reliability requires numerous test environments (at least eight). Lin et al. (1986) revised the previous stability models and grouped them into four: namely, groups A, B, C and D, which they further grouped into 3 types of stability: Type-1, Type-2 and Type 3. According to these authors a genotype has Type-1 stability if its environment variance is small. A genotype is considered to have type-2 stability if its response to environments is parallel to the mean response of all genotypes in the trial. On the other hand, a genotype is considered to have type-3 stability if the residual MS from the regression model on the environmental index is small. Type-1 stability, which is analogous to the biological concept of homeostasis, is useful for measuring stability in a limited range of environments, which may be useful for selecting genotypes for specific adaptation. This type of stability was later termed as static (Becker and Léon, 1988). Type-2 stability is based on the genotypes included in the test set (it is a relative measure). As a result, a genotype which was found to be stable in a given set, may not be so if it is organized with another set of genotypes. Becker and Léon (1988) called this type of stability dynamic. Type-3 stability depends on the measurements of unpredictable irregularities in the response to environment as provided by the deviation from regression (because the regression part is predictable (Eberhart and Russel, 1966)). Static (Type 1) stability may be more useful than dynamic in a wide range of situations, which characterise farming systems in developing countries (Simmonds, 1991). These types of stability are all univariate as opposed to the GxE which is multivariate. Therefore, the GxE provides a more robust inference based on multivariate stability approaches. The objective of the study was to investigate the effect of GxE on sorghum yield performance in the drought stressed parts of Ethiopia. MATERIALS AND METHODS The experiment consisted of 14 sorghum hybrids and one released open-pollinated variety, Teshale (a standard Check OPV, adapted to the moisture stressed lowland areas of Ethiopia), hereafter referred to as genotypes. The parents for the hybrids were originally received from International Crops Research Institute for the Semi Arid Tropics (ICRISAT) and Purdue University, USA (Table 1). The genotypes were evaluated at three locations: Melkassa (E39°21’, N08°24’), Mieso (E39°22’, N08°41’) and Kobo (E39°37’, N12°09’) representing the dry hot lowlands of Ethiopia (Table 2). The experiment was conducted during the rainy seasons of 2003, 2004 and 2005 at Melkassa and Mieso and 2003 and 2004 at Kobo. As a result, there were a total of eight environments (location x year combinations). For all trials the design used was RCBD with four replications. Plot size was 5 m x 0.75 m x 3 rows (11.25m2). Sowing was by hand drilling in rows. Later the plants were thinned to a spacing of 15cm giving a total density of 88888 plants ha-1. Management practices were uniformly applied at all locations x years following standard agronomic recommendation for sorghum in the dry lowlands. Data were recorded for grain yield plot-1, which was latter, converted to ha-1. Analysis of variance was done separately for each environment followed by combined analysis of variance using IRRISTAT for Windows Version 4.0. (IRRI, 1999). Because the genotype-by-environment interaction was significant, five out of the nine stability models, which were grouped into four groups and latter, divided in to three types of stability by Lin et al. (1986), were analysed and compared for their effectiveness in partitioning the GxE into parameters that permit a study of phenotypic stability of the sorghum genotypes. These were: environmental variance, S2i (Lin et al., 1986); Coefficient of variation, CVi (Francis and Kannenbert, 1978); Regression coefficient, bi (Finlay and Wilkinson, 1963), deviation from regression, Sd2i (Eberhart and Russel, 1966); Ecovalence, W2i (Wricke, 1962); and Stability variance, si2 (Shukla, 1972). The additive main effects and multiplicative interaction (AMMI) analysis was also performed separately as an individual multivariate model using IRRISTAT for Windows Version 4.0. (IRRI, 1999). Moreover, rank correlation coefficients were calculated between all possible pairs of computed stability parameters and stability parameters and mean yield of the genotypes. RESULTS AND DISCUSSION Differences among the environments were significant indicating that they were diverse (Table 3). The GxE was significant showing variable performance of the genotypes in the various environments. The grand mean yield was 4611 kg ha-1. Eight genotypes were above mean yield. The highest genotype yield was produced by genotype 1 followed by genotype 3. Stability analysis and rank correlation. Because the GxE mean square was significant further analysis was done to disaggregate the kg ha-1 causes responsible for the variation. The three types of stability statistics: Type-1 (S2i and CVi), Type-2 (W2i, s2i and bi) and Type-3 (Sd2i) were compared for ranking of the genotypes. The results of stability models are presented in Table 4. Genotypes with similar ranks received the average value (Table 5). The W2i and si2 had perfect positive rank correlation (r=1.0) and ranked the genotypes in exactly the same way (Table 6). This was in conformation to the findings of Lin et al. (1986), Kang et al. (1987) and Pham and Kang (1988). These two stability parameters had strong correlation with bi (r=0.80) but very weak correlation with CVi (r=0.16), S2i (r=0.12) and Sd2i (-0.12). CVi and S2i had strong rank correlation (r=0.97) but both had either very weak or no rank correlation with the rest of the parameters tested. This was in agreement with the results of Jalaluddin and Harrison (1993). The Sd2i had very weak negative correlation with the remaining parameters. Type-1 stability parameters (CVi and S2i) ranking indicated that the genotypes are similar. Type-2 parameters (W2i, s2i and bi) ranking also indicated similarities among genotypes. However, Type-3 stability parameter (Sd2i) ranked the genotypes differently. Accordingly, genotypes 11, 12 and 14 had Type-1 stability. Genotypes 2, 3, and 5 had the highest Type-2 stability; while genotypes 6 and 15 had the highest Type-3 stability. No single stability parameter had significant rank correlation with mean grain yield of the genotypes. The absence of positive correlation with bi and yield is in agreement with the finding of Sudaric et al. (2006) but conflicts with earlier findings of Weber and Wricke (1990), Helms (1993), Sneller et al. (1997), and Mekbib (2003). This was probably due to the fact that five of the eight environments were considered unfavourable and thus causing poor response of the genotypes. Type-1 stability is often associated with a relatively poor response and low yield in environments that are high yielding for other cultivars though it has broad inferential base, because its stability definition does not depend on the other genotypes included in the test and is thus unambiguous (Lin et al., 1986). However, it does not provide information on the response pattern over the range of test environments that is so vital for cultivar recommendations (Lin et al., 1986). According to Kang (2002), this type of stability would not be beneficial for the farmer because a genotype in this sense would not respond to high levels of inputs. Type-2 stability is useful for comparing a specific set of genotypes, but by being a relative measure, it does not have a sufficiently broad inferential base for general assessment (Lin et al., 1986). This parametric approach gives only the individual aspects (Types 1, 2, 3) of stability but cannot provide an overall picture of the response (Lin et al., 1986). In this study, the three types of stability parameters declared different genotypes to be the most stable. As a result of this inconsistency, it was difficult to reach a conclusion on producing genotype recommendation. Similar inconsistency in ranking using a univariate approach was previously suggested to be difficult to reconcile into a unified conclusion by Lin et al. (1986). According to them, the basic reason for the difficulty is that a genotype’s response to environments is multivariate, yet the parametric approach tries to transform it to a univariate problem via a stability index. Furthermore, Lin et al. (1986) suggested that clustering of genotypes according to their response structure emerged as a different line of thought to escape the difficulty imposed by the univariate approach. A disadvantage of clustering analysis, however, is that it gives no insight into the yield response of genotypes across environments (Flores et al., 1998). This problem has been overcome by using the AMMI model (Romagosa and Fox, 1993). In this study, the AMMI analysis of variance for grain yield of the 15 genotypes in the eight environments revealed that 73.8% of the total sum of squares was attributable to environmental effects (Table 7). Only 5.9% of the total sum of squares was attributable to genotype effects and the remaining 20.3% was due to GxE effects. The large sum of squares for environments indicated that the environments were diverse, with large differences among environmental means causing most of the variation in grain yield. The magnitude of the GxE sum of squares was 3.41 times larger than that of the genotypes, indicating, that there were substantial differences in genotype response across environments. According to Crossa et al. (1990), AMMI with two, three or four IPCA axes is the best predictive model. Similarly, in the present study, the AMMI analysis further revealed that the first two interaction principal component axes (IPCA 1 & IPCA 2) explained 68.7% of the GxE sum of squares. This was in agreement with Sneller et al. (1997), who suggested that GxE pattern is collected in the first principal components of analysis. The first interaction principal component axis (IPCA 1) alone captured 50.7% of the GxE sum of squares with 20.41% of the GxE degrees of freedom. The third interaction principal component axis (IPCA 3) was also significant. However, according to Zobel et al. (1988) the first two IPCA axes best explain the GxE sum of squares and the remaining can be considered as noise. Therefore, in the present study 31.3% of the GxE sum of squares was considered as noise (Table 7). The AMMI1 biplot, showing main effects means on the abscissa and IPCA 1 values as the ordinates, genotypes (or environments) that appear almost on a perpendicular line have similar means and those that fall almost on a horizontal line have similar interaction patterns (Crossa et al., 1990). According to these authors, genotypes (or environments) with large IPCA 1 scores (either positive or negative) have high interactions, whereas genotypes (or environments) with IPCA 1 scores near zero have small interactions. Similarly, in the biplot (Fig. 1) that reveals 90% of the total sum of squres, five of the eight environments had below average main effects and were unfavourable. Environments E2 (Kobo in 2003) and E4 (Melkassa in 2004) had the highest main effects and were favorable to the performance of most of the genotypes. On the contrary, environments E5 (Mieso in 2004), E3 (Melkassa in 2003) and E8 (Mieso in 2005) were the most unfavourable environments. In general Kobo showed higher main effect values in both years (E2 and E6), whereas Mieso showed consistently below average (poor) main effect values. However, Melkassa showed below average main effects in 2003 and 2005 (E3 and E7) but above average main effects in 2004 (E4). The interaction was also variable from year to year. This inconsistency in interaction at Melkassa poses difficulty in producing variety recommendation for that particular location. Genotypes 5, 9, and 15, and environments E1 and E7 were least interactive. Genotypes 2 and 5 placed closer to the biplot origin and were, therefore, the most stable but had average main effects of close to the grand mean. Genotypes 1 and 3 had higher average main and similar lower interaction which makes them most stable genotypes. On the contrary, genotypes 4, 6 and 11 had similar main effects but genotype 4 had larger IPCA 1 score and is more unstable. CONCLUSION In this study, attempts have been made to compare the various stability models and with which to select the stable sorghum genotypes in the lowlands of Ethiopia. There are remarkable inconsistencies with the univariate stability estimates (Types 1, 2 and 3), which create difficulty in producing genotype recommendation. However, the multivariate approach, the AMMI model is better for partitioning the GxE into the causes of variation. As a result a more robust inference is that genotypes 2 and 5 are the most stable but genotypes 1 and 3 have very good level of yield performance as well as stability. Therefore, these four genotypes are recommended for the drought stressed sorghum growing areas. ACKNOWLEDGEMENT This research was funded by the Ethiopian Institute of Agricultural Research (EIAR). All Research Staff at Melkassa, Mieso and Kobo Research Centers are duly acknowledged for handling the experiment. REFERENCES
The following images related to this document are available:Photo images[cs07010t3.jpg] [cs07010t4.jpg] [cs07010f1.jpg] [cs07010t7.jpg] [cs07010t5.jpg] [cs07010t1.jpg] [cs07010t2.jpg] [cs07010t6.jpg] |
| |||||||||
