 |
| About Bioline | All Journals | Testimonials | Membership | News |
|
||||||
|
||||||
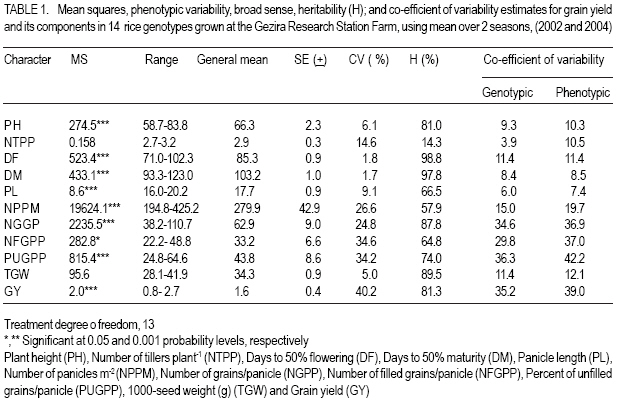
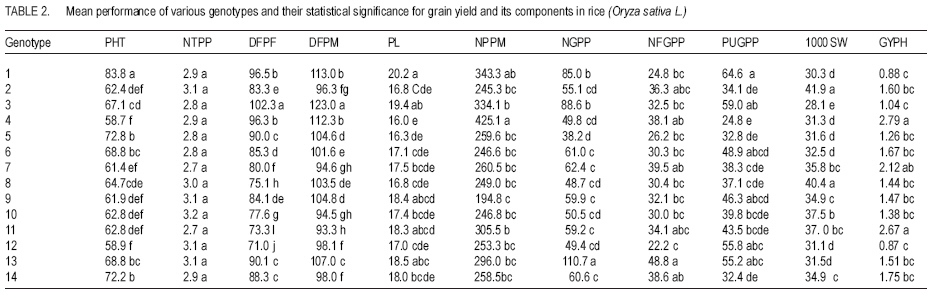
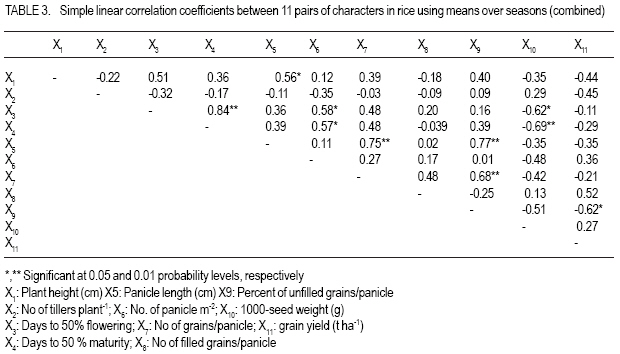
African Crop Science Journal, Vol. 15, No. 4, Dec, 2007, pp. 183-189 Variability, Correlation And Path Co-Efficient Analysis for Yield and its Components in Rice M. Ahmed Mustafa and M.A. Yassir Elsheikh Rice Research Program, Gezira Research Station, Agricultural Research Corporation, Wad Medani, Sudan Code Number: cs07019 ABSTRACT Direct selection based on crop yields is often a paradox in breeding programmes because yield is a complex polygenically inherited character, influenced by its component traits. Breeding programmes should, therefore, take into consideration character association of various component traits with yield and among themselves. In this study, fourteen rice (Oryza sativa L.) genotypes at the Gezira Research Station Farm (GRSF), Sudan were assessed for genetic variability and correlations between yield and yield components among phenotypic markers and polygenic trait analysis. A wider genetic variability was observed among the genotypes for most of the characters studied. The highest genotypic coefficient of varation was recorded for grain yield, percent unfilled grain panicle-1, number of grains panicle-1 and number of filled grain panicle-1. Phenotypic correlations between grain yield and number of filled grain panicle-1, number of panicle m-2 and 1000 grain weight were 0.52, 0.36 and 0.27, respectively. These results suggested that improvement in yield could be attained by selecting rice plants for higher number of filled grain panicle-1, number of panicle m-2, and 1000 grain weight. The path analysis revelead that number of filled grains panicle-1 had direct positive (0.87) contribution to the grain yield ha-1 and positive (0.33) indirect effect on grain yield ha-1 through days to 50% maturity and number of grains panicle-1 (0.089); while number of filled grains per particle had negative (-0.30) and (-0.21) indirect effect on grain yield ha-1 through number of tillers plant-1 and number of panicles m-2, respectively. The relative contribution of characters towards variability and results of correlation and path coefficient indicated the importance of number of grain panicle-1, number of filled grain panicle-1 and number of panicle m-2. Genotypes having these characters would offer a good possibility for the improvement of rice through conventional selection. Key Words: Oryza sativa, phenotypic markers, polygenic trait, Sudan RÉSUMÉ Diriger la sélection fondée sur les rendements de récoltes est souvent un paradoxe parce que le rendement est un caractère polygénique complexe hérité, influencé par ses traits des composants. Elever les émissions doit, donc prendre dans l’association de caractère de considération de divers traits parmi se composant et avec le rendement. Dans cette étude, les quatorze génotypes de riz (Oryza sativa L.) à la Ferme de Station de Recherche de Gezira (GRSF) au Soudan, a été évalué pour la variabilité et les corrélations génétiques entre les composants de rendement et rendement parmi les « bornes » phénotypiques et l’analyse de trait polygénique. Une variabilité génétique plus large a été observée parmi les génotypes pour la plupart des caractères étudiés. Le plus haut coefficient génotypique de variation a été enregistré pour le rendement de grains, le pourcentage de panicules des grains vide, le nombre de panicule de grains et nombre de panicules des grains rempli. Les corrélations phénotypiques entre le rendement de grain et le nombre de panicule remplie des grains, le nombre de panicules par m2 et 1000 poids de grain étaient 0,52, 0,36 et 0,27, respectivement. Ces résultats ont suggéré que cette amélioration de rendement pourrait être atteinte en choisissant des plantes de riz pour le plus haut nombre de grain rempli par panicule, le nombre de panicule m2, et 1000 poids de grain. Le processus d’analyse a révélé que le nombre de panicule rempli de grains avait une contribution de 0,87 et était positivement corrélé (0,33) au rendement de grain par ha. L’effet indirect sur le rendement de grain par ha à travers les jours à 50% de maturité et nombre de grains par panicule (0.089); pendant que nombre des panicules de grains rempli a eu un effet négatif indirect (-0.30) et (-0.21) sur rendement de grain par hectare et par le nombre de plantes par tillers. La contribution relative de caractères vers la variabilité et les résultats de coefficient de corrélation et le chemin ont indiqué l’importance de nombre de grains par panicule, le nombre des panicules des grains remplie et nombre de panicule par m2. Les génotypes ayant ces caractères offriraient une bonne possibilité pour l’amélioration de riz par la sélection conventionnelle. Mots Clés: Oryza sativa, marqueurs phénotypiques, trait polygénique, Soudan INTRODUCTION Yield is a complex polygenically inherited character, influenced by its component traits, hence, direct selection for yield often misleads breeders. Character association of various component traits with yield and among themselves is, therefore, very important. The estimation of character association could identify the relative importance of independent character(s) that may be useful as indicator(s) for one or more characters. Associations of various yield components in rice (Padmavathi et al., 1996; Sharaan and Ghallab, 1997; Luzikihupi, 1998) indicate that the plants with large panicles tend to have a high number of fertile grains. Similarly, a positive correlation was observed between number of panicle/plant and panicle length. Path coefficient analysis partitions the genetic correlation between yield and its components into direct and indirect effects. In rice, path analysis has been effectively used in identifying useful traits as selection criteria to improve grain yield (Ramalingam et al., 1993; Gopalakrishnan and Ganapathy, 1996; Mehetre et al., 1996; Padmavathi et al., 1996; Rao et al., 1997; Gonzales and Ramirez, 1998; Samonte et al., 1998; Luzikihupi, 1998). More emphasis has been directed towards rice genetic variability (Hemareddy et al., 1994; Singh and Chaudhary 1996; Reddy and De, 1996; Sarma et al., 1996; Anand et al., 1998; Prasad et al., 2001). The present study aimed at assessing rice genetic variability, phenotypic and genotypic associations between various components of grain yield to provide basis for selection and yield improvement. MATERIALS AND METHODS This study was carried out for two rainy seasons (2002/03 and 2003/04) in the Gezira Research Station Farm (GRSF) (latitude 14° 24’N and longitude 33° 29’E) of the Agricultural Research Corporation (ARC), Wad Medani, Sudan. Fourteen rice genotypes were obtained from the West Africa Rice Development Association (WARDA) namely; BR 1890-6-1-1-2, IDSA17 (IRAT267), R 55411-53, RPCB2B-849 (IET 1444), VANDANA, WAB 32-133, WAB 99-1-1, WAB 995, WAB 99-14, WAB 99-17, WAB 181-18, WAB 450-11-1-1-P41-MB, WAB 515-B-16A2-10 and WAB C165 (IAC 165). These genotypes were tested in the field in a randomised complete block design with three replications. Plot size was 5 m x 3 m, comprising of 14 rows spaced 20 cm apart. Planting was performed by drilling the dry seeds at rate of 120 kg ha-1. Fertilisers were applied in the ratio of 43:86 P2O5; N. Nitrogen was applied as urea in two splits at 10 and 40 days after sowing during both seasons. Hand-weeding was performed 3 times per season. At harvest, a random sample of 5 plants in each plot was taken to measure the following parameters: number of tillers plant-1, number of grains panicle-1, number of filled grains panicle-1, percent of unfilled grains panicle-1, panicle length, plant height (cm), number of paniclesm-2 1000seed weight and grain yield. Grain yield m-2 was then converted to grain yield ha-1. Days to 50% flowering and 50% maturity were also recorded. Analysis of variance was used to ascertain differences among genotypes. Genotypic variances and their coefficients, heritability in the broad sense were computed according to the formula described by Singh and Chaudhary (1985). Means over seasons were used to compute simple linear correlation coefficients, stepwise multiple regression analysis and path analysis using appropriate computing programmes. RESULTS AND DISCUSSION Mean squares, range, general means, standard error of means (SE+), coefficient of variation (CV), heritability, genotypic and phenotypic coefficient of variation for the different characters of 14 rice genotypes are presented in Table 1. The mean squares for all characters were significant (P<0.05) except for number of tillers per plant. The significant genotype variance component indicated that genotypes differed in their genetic potential for these characters. A wide range of variability was exhibited by most of the characters. High coefficients of variation were shown by the number of panicles m-2, number of grains panicle-1, number of filled grains panicle-1, percent of unfilled grains panicle-1 and grain yield (t ha-1). Plant height, days to 50% flowering, days to 50% maturity, panicle length and 1000-seed exhibited relatively low coefficients of variation weight. Results of analysis of variance, range and coefficient of variation indicate potential genetic variability and diversity in the material under consideration. Therefore, genetic improvement through conventional selection methods would be effective. The GCV ranged from 2.9 for number of tillers/plant) to 37.5 for grain yield, whereas, (PCV) ranged from 3.7 for panicle length to 53.1 for grain yield. Higher heritability estimates in broad sense (h2b) were exhibited by plant height, days to 50% flowering, days to 50% maturity and 1000-seed weight, but they had low GCV. Similar results were reported by Kaul and Kumar (1982); Mehetre et al. (1996) and Sarma et al. (1996). Number of tillers/plant had low heritability estimate. This low heritability might be due to the variation of environmental component involved in this trait. The moderate heritability estimate for grain yield may possibly be due to the influence of the environment on the polygenic nature of this trait. Plant height, days to 50% flowering, days to 50% maturity and 1000-seed weight had high heritability estimates. These findings agreed with those of Vange and Ojo (1997). Genotypes 1, 5 and 14 had the maximum plant height (72.2-83.8 cm), while genotypes 4, 12, 7 and 9 had minimum (58.7-61.9 cm) (Table 2). The highest number of tillers/plant (3.1-3.2) was observed for genotype 10, 12, 2, 9 and 13 and the lowest (2.7-2.8) was observed for genotype 11, 7, 3 and 6 (Table 2). The fastest growing genotypes were 12, 11 and 8, which reached 50% flowering in about 71-75 days from emergence, while the slowest genotypes were 3, 1, 4 and 13, which reached 50% flowering after 90 days (Table 2). Genotype 11 had the shortest (93) 50% maturity period from emergence, while genotype 3 had the longest (123) 50% maturity period (Table 2). The maximum panicle length (20.3 cm) was observed for genotype 1, while the minimum length (16.0 cm) was recorded for genotype 4 (Table 2). The highest number of panicles m-2 (306-426) was exhibited by genotypes 4, 1, 3 and 11, while the lowest number of panicle m-2 (195) were exhibited by genotype 9 (Table 2). The highest number of grains/panicle (86-111) was showed by genotypes 13, 3 and 1, while the lowest (39-50) was showed by genotypes 5, 8, 12 and 4 (Table 2). Genotypes 13, 7, 1 and 4 showed the highest number of filled grains/panicle (39-49), while the lowest (23-27) was exhibited by genotypes 12, 1 and 5 (Table 2). Highest percentage of unfilled grains panicle-1 (48.9-64.6) was shown by genotypes 1, 3, 13 and 6, while the lowest (24.832.8) was given by genotypes 4, 14 and 5, (Table 2). The highest 1000-seed weight (37.0-41.9) was shown by genotypes 2, 8, 10 and 11, while the lowest (28.1-31.1) was shown by genotypes 3, 1 and 12 (Table 2). Genotypes 4, 11 and 7 showed the highest seed yield ha-1 (2.1-2.8); while the lowest grain yield genotypes were 12, 1, 3 and 5 (0.9-1.3), (Table 2). Simple linear correlation coefficients among 11 pairs of characters are presented in Table 3. Grain yield was significantly negatively correlated with percent of unfilled grains panicle-1. This result confirmed earlier findings reported by Mehetre et al. (1996). Grain yield was negatively correlated with number of tillers plant-1, though, Mehetre (1996) reported positive correlation between grain yield and number of tillers. Number of grains/panicle was significantly positively correlated with panicle length. Days to 50% maturity was also significantly positively correlated with days to 50% flowering confirming Mehetre et al.’s (1996) earlier results. Presumably, the negative correlation between grain yield and number of tillers plant-1, panicle length and number of grains panicle-1 was due to the highest correlation with percent of unfilled grains panicle-1. Grain yield was negatively correlated with percent of unfilled grains panicle-1, while 1000-seed weight was significantly negatively correlated with days to 50% maturity. Days to 50% maturity was significantly positively correlated with days to 50% flowering. Number of filled grains panicle-1 had the highest (0.86) direct positive contribution to the grain yield ha-1 and also had positive (0.32) indirect effect on grain yield ha-1 through days to 50% maturity and number of grains panicle-1 (0.09), while number of filled grains per panicle had negative (-0.30) and (-0.21) indirect effect on grain yield ha-1 through number of tillers plant-1 and number of panicles m-2, respectively. The high positive correlation of number of filled grains panicle-1 with grain yield ha-1 resulted in a positive direct effect. Many research workers reported similar findings (Luzikihupi, 1998; Prasad et al. 2001). The direct effect of number of panicles m-2 on grain yield/ha was the second largest (0.61). It had positive indirect effect on grain yield through number of tillers plant-1 (0.28), and also had negative indirect effect on grain yield through days to 50% maturity (-0.32), number of filled grains panicle-1 (-0.300) and number of grains panicle-1 (-0.18). These results are in conformity with those of Gravois and Helms (1992). The number of grains panicle-1 had negative (-0.46) direct effect on grain yield ha-1 and negative indirect effect on grain yield ha-1 through days to 50% maturity (-0.25) and number of filled grains panicle-1 (-0.17) and positive indirect effect on grain yield ha-1 through number of tillers plant1 (0.32) and number of panicles m-2 (0.24). This result disagreed with that reported by Suarez et al. (1989). Number of tillers plant-1 had negative (-0.58) direct effect on grain yield ha-1 and a positive indirect effect on grain yield ha-1 through number of filled grains panicle-1 (0.45), days to 50% maturity (0.34) and number of grains panicle1 (0.25). Also it had a negative indirect effect on grain yield ha-1 through number of panicles m-2 (0.29). This result agreed with Prasad et al. (2001) but disagreed with that reported by Rao et al. (1997). It indicates that for increasing effective tillers plant-1, other causal factors must be considered simultaneously. The days to 50% maturity had negative direct effect on grain yield ha-1 (-0.46) and a positive indirect effect on grain yield ha-1 through number of tillers plant-1 (0.43) and number of panicles m-2 (0.41). Also, it had negative indirect effects on grain yield ha-1 through number of filled grains/panicle (-0.61) and number of grains panicle-1 (-0.24). This result disagreed with that reported by Chaudhary and Das (1998). The present study showed that the number of filled grains panicle-1 was the most important character that contributed directly to the grain yield. Similar results were reported by (Gravois and Helms, 1992; Luzikihupi, 1998). Number of panicle m-2 was the second important character. These characters should be considered while selecting for yield improvement in rice. Path analysis revealed that number of filled grains panicle-1 was the most important character related to grain yield, confirming the correlation results. On the other hand, the results of the path analysis disagreed with the correlation results in identifying the importance of number of panicles m-2 as the second important character related to grain yield. CONCLUSIONS There is high variability in the 14 rice genotypes assessed for genetic, phenotypic and genotypic associations. Hence, genetic improvement of the material through conventional methods would be effective. The genotypes RPCB2B-849 (IET 1444) and WAB 181-18 give the highest grain yield. High heritability estimates for number of grains panicle-1 predicted the transmission of this trait from parents to their progenies, suggesting greater scope for selection. Number of filled grains/panicle is the most important character for selection to improve grain yield as suggested by association analysis. While, Path coefficient analysis identifies number of filled grains/panicle and number of panicles/m2 as the most important characters for selection to improve grain yield/ha. REFERENCES
©2007, African Crop Science Society The following images related to this document are available:Photo images[cs07019t2.jpg] [cs07019t3.jpg] [cs07019t4.jpg] [cs07019t1.jpg] |
| |||||||||
