 |
| About Bioline | All Journals | Testimonials | Membership | News |
|
||||||
|
||||||
African Crop Science Journal, Vol. 17, No. 2, 2009, pp. 61-69 Relationship of status of polymorphic RAPD bands with genotypic adaptation in early finger millet genotypes S. Das, R. C. Misra, G.R. Rout1, M.C. Pattanaik and S. Aparajita1 Department of Plant Breeding and Genetics, College of Agriculture, Orissa University of Agriculture and
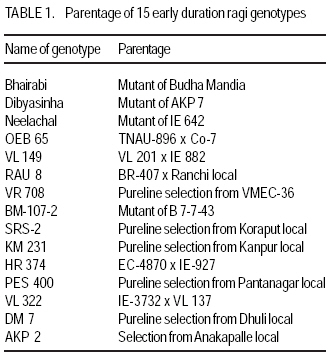
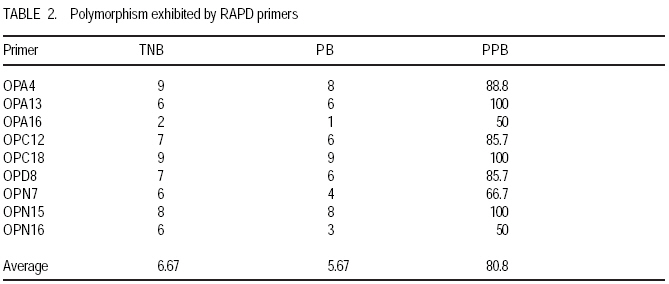
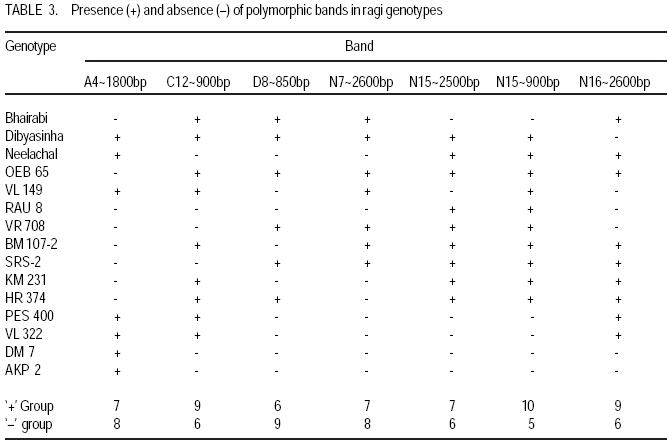
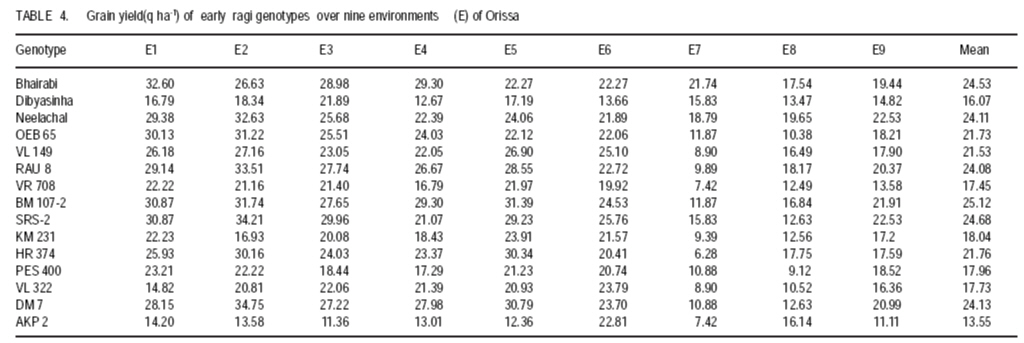
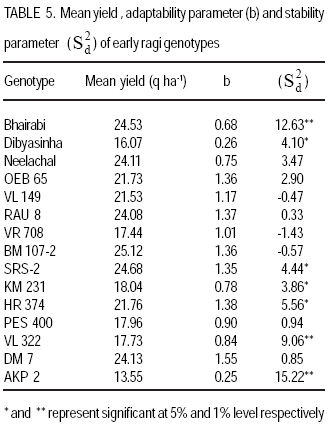
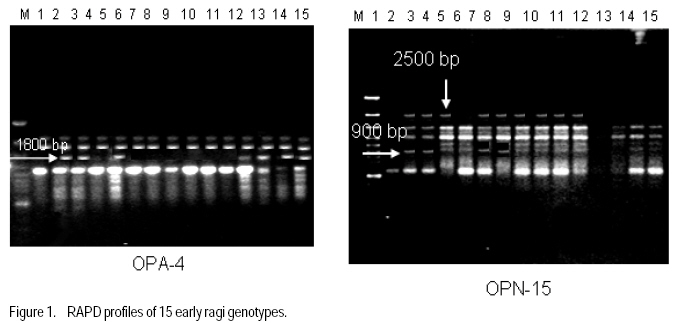
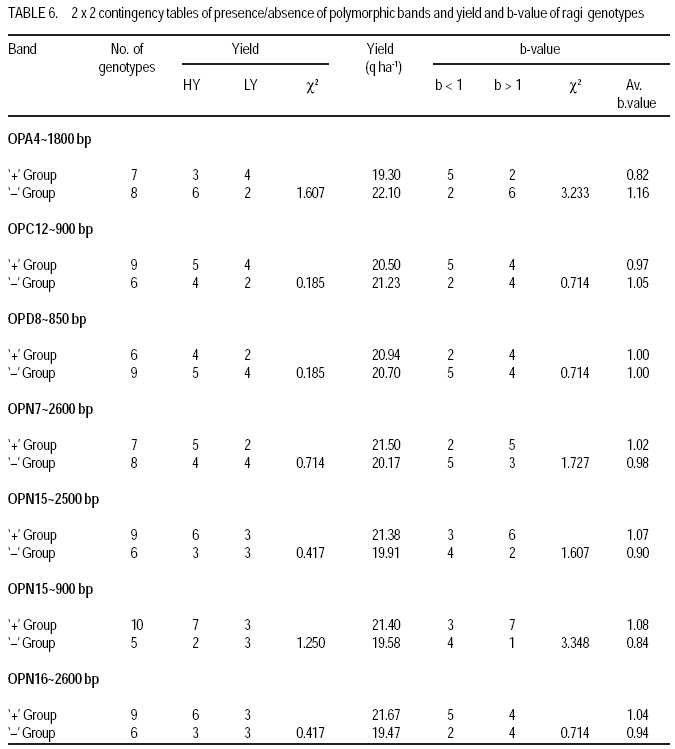
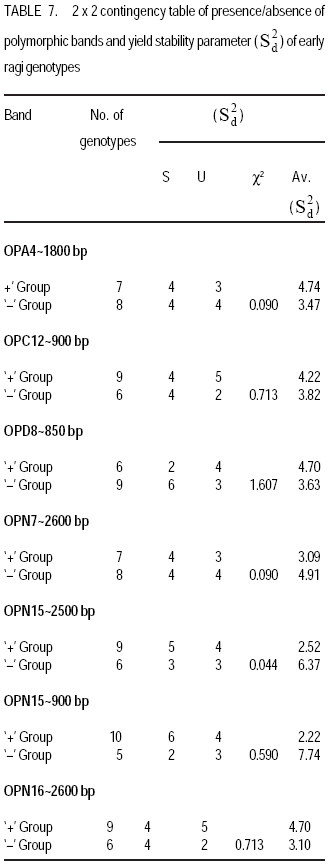
Technology, Bhubaneswar- 751003, Orissa, India (Received 3 April, 2009; accepted 20 July, 2009) Code Number: cs09006 ABSTRACT Molecular characterisation of the 15 early duration finger millet (Eleusine coracana G) genotypes was done through RAPD markers. Twenty-five decamer primers were used for initial screening. Of these nine primers (OPA4, OPA13, OPA16, OPC12, OPC18, OPD8, OPN7, OPN15 and OPN16) showed polymorphic banding pattern for the genotypes. Total number of bands produced ranged from 2 to 9 bands per primer. The nine primers produced 60 amplification products, of which 9 were monomorphic and 51 were polymorphic. The primers OPA4, OPC18 and OPN15 produced a greater number of polymorphic bands than OPA16 and OPN16. Polymorphism ranged from 50 to 100%. Primers OPA13, OPC18 and OPN15 revealed 100% polymorphism, whereas OPA16 and OPN16 showed 50%. In order to study the relationship of presence/absence of a polymorphic band with genotypic adaptation, the 15 early finger millet genotypes were classified into `+' group for presence and '-' group for absence of the band-OPA4~1800 bp, OPC12~900 bp, OPD8~850 bp, OPN7~2600 bp, OPN15~2500 bp, OPN15~900 bp and OPN16~2600 bp. The genotypes were also classified into high-yielding (HY) and low-yielding (LY) classes, two adaptability classes, i.e. specifically adapted to rich environments and specifically adapted to poor environments and into two stability classes, i.e. stable(S) and unstable (U). This experiment revealed that the presence of OPA4~1800 bp and absence of OPN15~900 bp bands in finger millet may give some indication about specific adaptability of genotypes to poor environments. Absence of OPA4~1800 bp and presence of OPN15~900 bp would indicate specific genotypic adaptation to rich environments. These findings may help to predict the genotypic adaptation of different genotypes before going for multilocation trial. Key Words: Eleusine coracana, genotypic adaptation, molecular markers RÉSUMÉ Une characterisation moléculaire des 15 génotypes de millet (Eleusine coracana G) à maturité précoce avait été faite à l'aide des marqueurs RAPD. Vingt-cinq apprêts avaient été utilisés pour une sélection initiale. De ceux-ci, neuf apprêts (OPA4, OPA13, OPA16, OPC12, OPC18, OPD8, OPN7, OPN15 et OPN16) s'étaient révélés de modèle de repartition en groupes de niveau dans le primaire polymorphique pour les génotypes. Un nombre total de bandes produites rangés de 2 à 9 bandes par apprêts. Les neuf apprêts avaient produit 60 produits d'amplification, dont 9 étaient monomorphiques et 51 étaient polymorphes. Les apprêts OPA4, OPC18 et OPN15 avaient produit le plus grand nombre de bandes polymorphiques que OPA16 et OPN16. Le polymorphisme allait de 50 à 100 %. L'apprêts OPA13, OPC18 et OPN15 s'étaient révélés d'un polymorphisme de 100 %, alors que OPA16 et OPN16 d'un polymorphisme de 50 %. Afin d'étudier la relation entre la présence/absence de bande polymorphique avec adaptation génotypique, les 15 génotypes de millet étaient classés en groupe `+' pour la présence et en groupe '-' pour l'absence de bande-OPA4 ~ 1800 bp, OPC12 ~ 900 bp, OPD8 ~ 850 bp, OPN7 ~ 2600 bp, OPN15 ~ 2500 bp, OPN15 ~ 900 bp et OPN16 ~ 2600 bp. Les génotypes étaient également classifiés en classes à haut rendement (HY) et à faible rendement (LY), deux classes d'adaptabilité, c'est-à-dire spécifiquement adaptées aux environnements riches et spécifiquement adaptés aux environnements pauvres ; également en deux classes de stabilité, c'est-à-dire stables (S) et instable (U). Cette expérimentation avait révélé que la présence de OPA4 ~ 1800 bp et l'absence de OPN15 ~ 900 bp bandes dans le millet (Eleusine coracana G) peuvent donner d'indication sur l'adaptation spécifique des génotypes aux environnements pauvres. L'absence de OPA4 ~ 1800 bp et la présence de OPN15 ~ 900 bp indiquerait une adaptation génotypique spécifique aux environnements riches. Ces conclusions peuvent aider à prédire l'adaptation génotypique de différents génotypes avant de procéder à un essai multilocal. Mots Clés: Eleusine coracana, adaptation génotypique, marqueurs moléculaires Introduction Finger millet or ragi (Eleusine coracana G.) is the third most important millet crop of India. It is also an important food crop in South Asia and Africa. Its wide adaptability to diverse environments and cultural conditions makes it a potential food crop. Finger millet covers an area of 1.7 million hectares in India, with a production of 2.44 million tonnes and productivity of 1,481 kg ha-1 (Economic Survey, 2007). It makes a component of dryland, tribal and hill agriculture where yield stability is a major consideration. Selection of finger millet genotypes adapted to different agro-ecological conditions demands presence of genetic variability with regard to genotypic adaptation in the base population. Among the several methods used to assess genetic variability, DNA-based molecular marker technique is most efficient in detecting genetic variability among genotypes. PCR-based markers such as RAPD (Random Amplified Polymorphic DNA) have been extensively used to study genetic diversity (Salimath et al., 1995). Development of crop varieties with high yield potential is a major plant breeding objective and a large number of high-yielding varieties of different crops have been released for cultivation. But a large chunk of released varieties disappear out of cultivation in a few years due to unstable performance over wide range of environmental conditions. Indeed, only a few varieties with stability and wide adaptability persist over years. Thus, multilocation testing of genotypes under diverse agro-ecological conditions for evaluation of yield potential, adaptability and stability is essential before recommending a genotype for release as variety. But multilocation trials involve considerable effort, time and expenditure. It would be of great help and immense value if some method could be developed to screen genotypes for their adaptability and stability before taking them to multilocation trials. In the present investigation, molecular characterisation of early finger millet genotypes was done using RAPD technique and an attempt was made to study the relationship of presence / absence of polymorphic bands with yielding ability, adaptability and yield stability of the genotypes. Materials and methods Fifteen early finger millet genotypes collected from different places of India were used for the present study (Table 1). DNA extraction was done following Cetyl-trimethly Ammonium Bromide (CTAB) protocol (Doyle and Doyle, 1990) with some modification. For each genotype, 20 mg of young leaves was collected from 7-day old seedlings; cut into small pieces, grinded in liquid nitrogen and homogenised. Ten ml of preheated extraction buffer [2 % CTAB (w/v), 0.2% b-mercaptoethanol (v/v), 100 mM Tris-HCl of pH 8.0, 2 mM EDTA, 1.4 M NaCl] was added per 20 mg of powdered material and incubated for 2 hours at 60 oC. After incubation, an equal amount (10 ml) of isoamyl alcohol: chloroform (24:1) was added and centrifuged at 10,000 rpm for 20 minutes. The supernatant was collected and precipitated by using equal volume of chilled isopropanol. Crude DNA pellet was made by adding chilled ethanol. The DNA pellet was resuspended in 200 ml of Tris-EDTA (TE) buffer (10 mM Tris-HCl of pH 8.0 and 0.1 mM EDTA) for overnight. For purification of DNA and to remove contaminant RNA, the sample was treated with 3 ml RNase (10 mg ml-1) and incubated in water bath for 1 hour at 37 oC. DNA purification was done by using equilibrated phenol two times. The pure DNA was reprecipitated with 0.1 volume of 3 M sodium acetate and 2 volumes of cold absolute ethanol. The precipitated DNA was spooled, rinsed with 70% ethanol and dissolved in 1 ml of TE buffer for further analysis. DNA quantification was done by visualising under UV light after electrophoresis on 0.8% (w/v) agarose gel. The DNA was again diluted in TE buffer to 5 mg ml-1 concentration for use in polymerase chain reactions. Twenty-five decamer primers of A, C, D and N kits of Operon Technologies (Alameda, California, USA) were used for initial screening. Primers producing distinct, clear polymorphic amplified products were selected for PCR study. Polymerase chain reactions were carried out in a final volume of 25 ml containing 20 ng template DNA, 100 mM each deoxy-nucleotide triphosphate, 20 ng of primers, 1.5 mM MgCl2, 1x Taq buffer (10 mM Tris-HCl of pH 9.0, 50 mM KCl, 0.01% gelatin) and 0.5 U Taq DNA polymerase. Amplification was achieved in a PTC-100 thermal cycler (M.J. Research, USA) programmed for a preliminary 2-minute denaturation step at 94 oC, followed by 40 cycles of denaturation at 94 oC for 20 seconds, annealing at 38 oC for 1 minute and extension at 72 oC for 2 minutes and finally at 72 oC for 10 minutes. Amplification products were separated alongside a molecular weight marker (100 kb ladder, MBI Fermentas, USA) by electrophoresis on 1.2% agarose gel run in 0.5x TAE (Tris Acetate EDTA) buffer, stained with ethidium bromide and visualised under UV light. Gel photographs were scanned through Gel Doc system (Gel Doc, 2000, BioRad, USA) and the amplification product sizes were evaluated using the software Quantity (Bio Rad). RAPD analysis was done in the Plant Biotechnology Division, Regional Plant Resource Centre, Bhubaneswar, India during the year 2005. Field trials. The finger millet genotypes were evaluated in nine different environments of Orissa, India during the year 2005 in kharif season using a randomised block design with three replications. Normal cultural practices and plant protection measures were followed to raise the crop and data on net plot grain yield was recorded. The yield data were subjected to stability analysis following the linear regression model of Eberhart and Russell (1966) to estimate regression coefficient / adaptability parameter b and stability parameter. Relationship of RAPD banding with yield potential, adaptability and yield stability. The genotypes that were analysed by RAPD were classified into `+' and '-' groups on the basis of presence/absence of certain polymorphic bands. The genotypes were also classified into high-yielding (HY) and low-yielding (LY) classes on the basis of their yield performance over nine environments, two adaptability classes, i.e. b>1 and b<1 and into two stability classes, i.e stable (S) and unstable (U). Number of HY and LY genotypes, number of genotypes having b>1 and b< 1 and number of S and U genotypes falling into the `+' and '-' groups for an individual polymorphic band were estimated and the relationship of presence/absence of a polymorphic band with yield potential, adaptability and stability in yield performance was analysed from the 2 × 2 contingency tables and tested by ?2 test. Results Table 2 presents detailed information about the primers used, total number of bands (TNB), number of polymorphic bands (NPB) and percentage of polymorphic bands (PPB). Total number of bands produced ranged from 2 to 9 with an average of 6.7 bands per primer. The nine primers produced 60 amplification products, of which 9 were monomorphic and 51 were polymorphic (85%). The primers OPA4, OPC18 and OPN15 produced greater number (8-9) of polymorphic bands, compared to OPA16 and OPN16 which produced only 1 and 3 polymorphic bands, respectively. Different primers showed variation in their ability to detect polymorphism. Polymorphism ranged from 50 to 100%. Primers OPA13, OPC18 and OPN15 revealed 100% polymorphism where as OPA16 and OPN16 showed 50% polymorphism. All the nine primers were effective in bringing out differences among the 15 ragi genotypes. In order to study the relationship of presence/absence of a polymorphic band with yield potential, adaptability and stability in yield performance , the 15 early ragi genotypes were classified into `+' group for presence and '-' group for absence of the polymorphic band. The polymorphic band of a primer that was present or absent in at least 5 of the 15 genotypes were considered for grouping of the genotypes. In all, seven polymorphic bands: OPA4~1800 bp, OPC12~900 bp, OPD8~850 bp, OPN7~2600 bp, OPN15~2500 bp, OPN15~900 bp and OPN16~2600 bp of six of the nine primers were found to satisfy the above criterion for classification of the genotypes into `+' and '-' groups (Table 3). The yield data (Table 4) to stability analysis showed that the mean yield (averaged over nine environments) and regression coefficient b of early finger millet genotypes varied from 13.55 - 25.12 q ha-1 and 0.25 - 1.55, respectively (Table 5). Nine out of fifteen early finger millet genotypes had above group average yield (> 20.83 q ha-1) and were considered as high yielder and others were low yielder. Eight genotypes of early group had regression coefficient (b) value greater than unity and seven had b<1. The stability parameter i.e. deviation from regression () of the genotypes ranged from 1.43 to 15.22. The value of the genotypes Neelachal, OEB 65, VL 149, RAU 8, VR 708, BM 107-2, PES 400 and DM 7 were not significantly different from zero, indicating stability of performance of these genotypes over environments (stable genotypes). of the remaining seven genotypes were significantly greater than zero indicating that these genotypes lacked stability of performance (unstable genotypes i.e. U). Relationship of polymorphic band with yielding ability, adaptability and stability of genotypes. The group of genotypes showing absence of OPA4~1800 bp ('-' group) included 8 genotypes, while the `+' group included 7 genotypes (Table 3 and Fig. 1). Six of the 8 genotypes in the '-' group were high yielders, whereas in the `+' group 3 genotypes were high yielders (Table 6). The contingency chi-square value was though high, but not significant (P>0.05) (χ2= 1.607). However, the '-' group had higher average yield of 22.10 q ha-1 compared to the average yield of 19.30 q ha-1 of the `+' group. So, the absence of the OPA4~1800 bp band may give some indication about the high yielding ability of genotypes. In the case of the OPN15~900 bp band, the `+' group had higher average yield (21.40 q ha-1) than the '-' group (19.58 q ha-1). A majority (7 of the 10) genotypes included in the `+ group were high yielders, while 3 of the 5 genotypes in the '-' group were low yielders. But the contingency chi-square value was not significant (P>0.05) (χ2= 1.25). Considering the remaining five bands (OPC12~900 bp, OPD8~850 bp, OPN7~2600 bp, OPN15~2500 bp and OPN16~2600 bp), the groups of genotypes showing presence (`+' group) and absence ('-' group) for each band had quite similar average yields. Moreover, the `+' and '-' groups included a similar number of genotypes with HY and LY. The contingency chi-square values were non-significant (χ2= 0.185 to 0.714), indicating the distributions to be random. Thus, presence or absence of these bands does not have a significant relationship with yielding ability of finger millet genotypes. In 15 early duration finger millet genotypes, 7 had b<1 and 8 had b>1. To find a relationship of RAPD banding pattern with adaptability of genotypes, number of genotypes having b<1 and b>1 falling into `+' and '-' classes for each band was found out and χ2 test of the 2x2 contingency were done (Table 6). In addition, average b-value for `+' and '-' classes of each band was also computed for comparison. The group of genotypes showing presence (`+' group) of OPA4~1800 bp (Fig. 1) had low average b-value of 0.82 and the '-' group had high average b- value of 1.16 (Table 6). Five of the 7 genotypes included in `+' group had b < 1. On the other hand, 6 of the 8 genotypes in '-' group had b > 1. The contingency chi-square value, though not significant (P>0.05) was quite high (c2 = 3.233). In the case of OPN15~900 bp, the `+' group had higher b-value (1.08) and the '-' group had low b-value (0.84). Seven of the 10 genotypes included in the `+' group had b > 1. On the other hand, 4 of the 5 genotypes of '-' group had b < 1. The contingency chi-square value, though not significant (P>0.05) was quite high (χ2= 3.348). Considering the remaining five bands (OPC12~900 bp, OPD8~850 bp, OPN7~2600 bp, OPN15~2500 bp and OPN16~2600 bp), the groups of genotypes showing presence (`+') and absence ('-') for each band had quite similar b-values. Moreover, the `+' and '-' groups included similar number of genotypes with b< 1 and b >1 in all cases. The contingency chi-square values in all five cases were not significant (χ2= 0.714 to 1.727) and quite less than the above two bands. The relationship of polymorphic RAPD bands with stability parameter is presented in Table 7. The contingency chi-square values in all seven polymorphic bands varied from 0.044 to 1.607 and were not significant. The highest chi-square value was observed in OPD8~850 bp. The group of genotypes showing absence of OPD8~850 bp ('-') included 9 genotypes, while the `+' included 6 genotypes. Six of the 9 genotypes in the '-' group were stable yielder, whereas in the `+' group 2 genotypes were stable yielder and 4 genotypes were not stable. The '-' group had higher average value of 4.74 as compared to the average of 3.47 of the `+' group. Discussion In finger millet, RAPD analysis using nine primers viz., OPA4, OPA13, OPA16, OPC12, OPC18, OPD8, OPN7, OPN15 and OPN16 was effective in bringing out polymorphic banding in the 15 genotypes. With these primers, the genotypes produced a total of 60 amplification products (bands) of which 9 were monomorphic and 51 were polymorphic. Thus, the primers used were effective in bringing out the differences among the 15 ragi genotypes in terms of presence or absence of the 51 polymorphic bands. Molecular characterization and detection of genetic variability among finger millet genotypes using RAPD technique have also been reported by Fakrudin et al. (2004) and Das et al. (2006). The RAPD polymorphic banding pattern analysis has been successfully used for molecular characterisation and detection of genetic variability of genotypes in various crop plants. But to the best of the author's knowledge there is no report on relationship of banding pattern with such characteristics of genotypes as yielding ability and adaptability. The 15 finger millet genotypes studied by RAPD showed greater polymorphism for seven bands viz., OPA4~1800 bp, OPC12~900 bp, OPD8~850 bp, OPN7~2600 bp, OPN15~2500 bp, OPN15~900 bp and OPN16~2600 bp; and the genotypes were classified on the basis of presence and absence of these bands. The '-' group of OPA4~1800 bp and the `+' group of OPN15~900 bp band included more number of genotypes with high yield and the groups had high average yield. The `+' and '-' groups on basis of other five bands included similar number of genotypes with high and low yield. The finger millet genotypes were classified into b > 1 and b < 1 classes on basis of adaptability parameter (b) of genotypes. The `+' group for OPA4~1800 bp and '-' group for OPN15~900 bp included more genotypes with b<1 and the average b-value for the groups were less than unity. Conversely, the '-' group for OPA4~1800 bp and `+' group for OPN15~900 bp included more genotypes with b>1 and average b-value for the groups was greater than unity. The `+' and '-' groups for other five polymorphic bands included similar number of genotypes with b <1 and b > 1. Recently Das et al. (2008) reported that presence of the RAPD bands OPD5~750 bp and OPD18~2000 bp in some rice genotypes indicated their genotypic adaptation to poor environments and absence of these two bands indicated genotypic adaptation to rich environments. The relationship of presence/absence of polymorphic bands with yielding ability and stability in yield performance was not conclusive. However, presence of OPA4~1800 bp and absence of OPN15~900 bp bands may give some indication about the genotypic adaptation to poorer environments and absence of OPA4~1800 bp and presence of OPN15~900 bp bands may give some indication about the genotypic adaptation to rich environments. Further investigations are being carried out to find out the basic relationship between molecular marker and genotypic adaptation References
Copyright © 2009, African Crop Science Society The following images related to this document are available:Photo images[cs09006t4.jpg] [cs09006t1.jpg] [cs09006t7.jpg] [cs09006t2.jpg] [cs09006t6.jpg] [cs09006f1.jpg] [cs09006t5.jpg] [cs09006t3.jpg] |
| |||||||||
