 |
| About Bioline | All Journals | Testimonials | Membership | News |
|
||||||
|
||||||
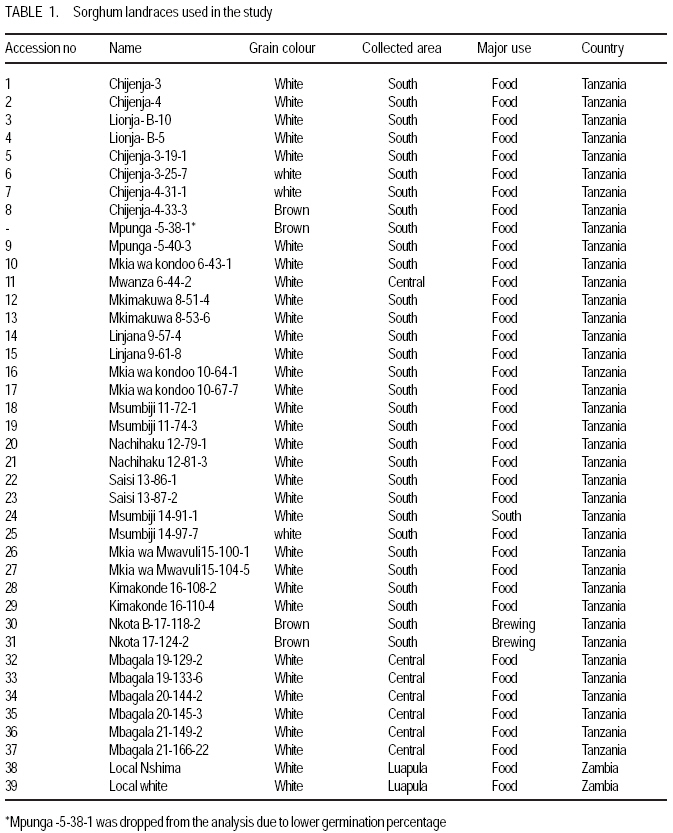
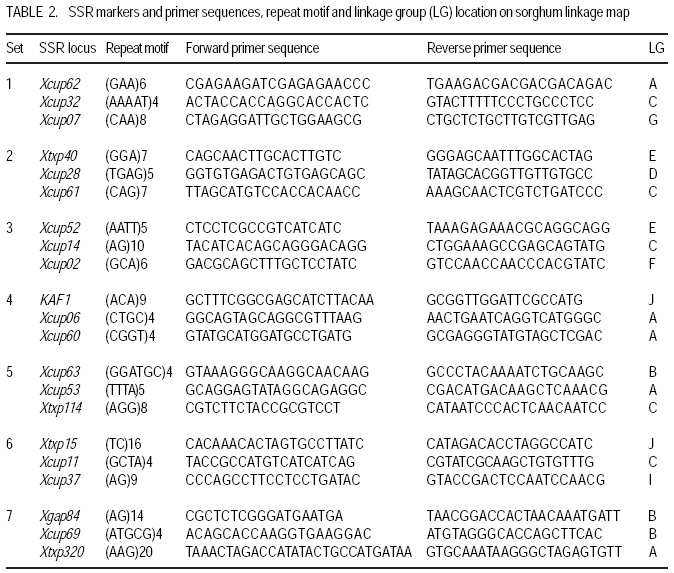
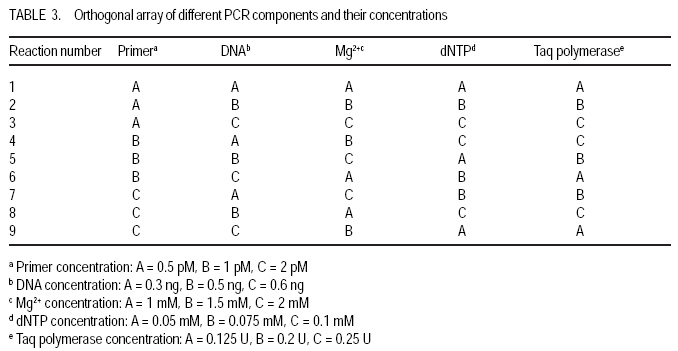
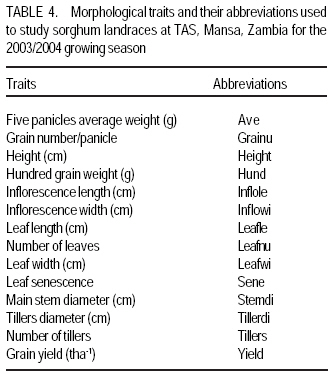
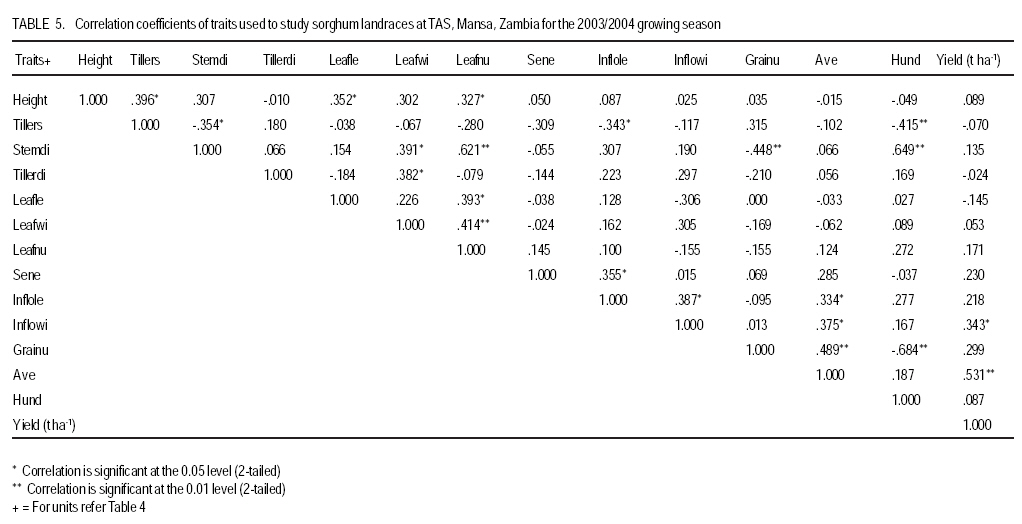
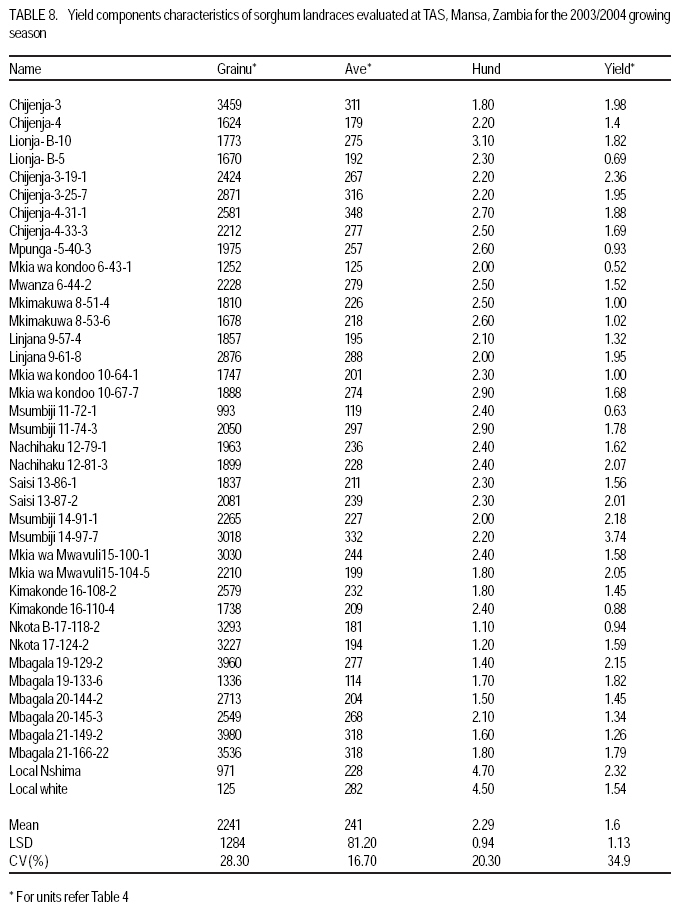
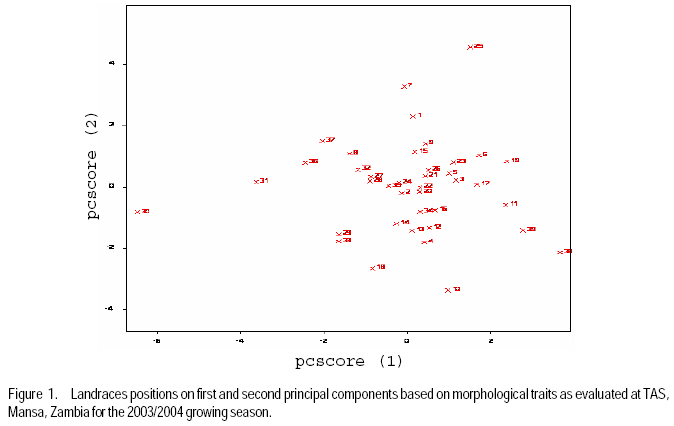
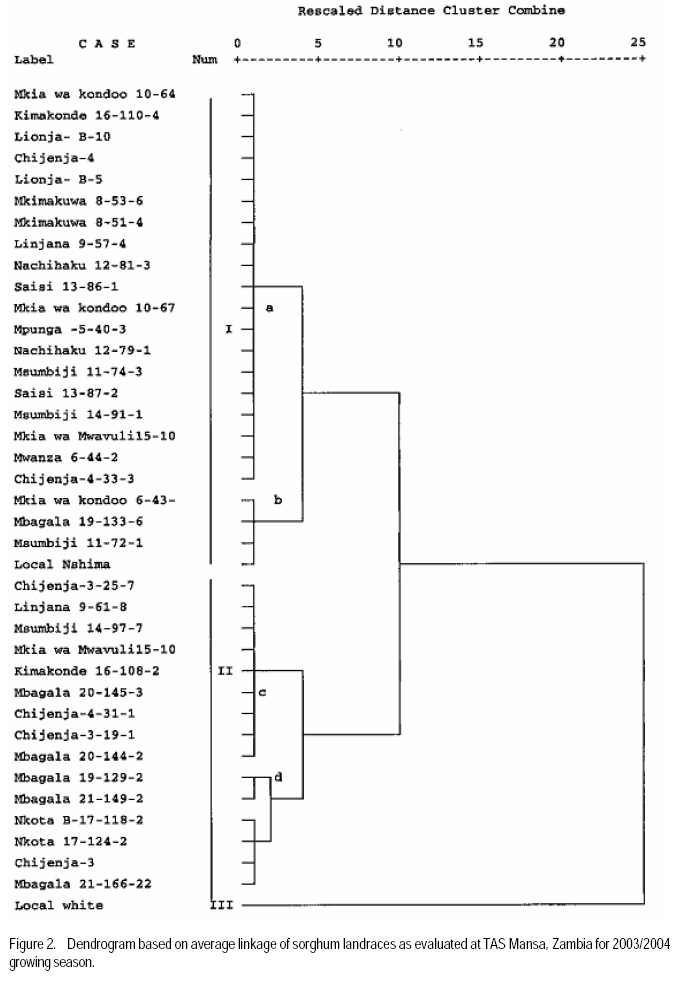
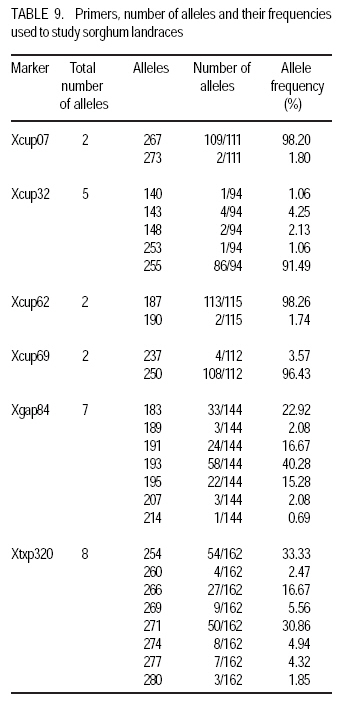
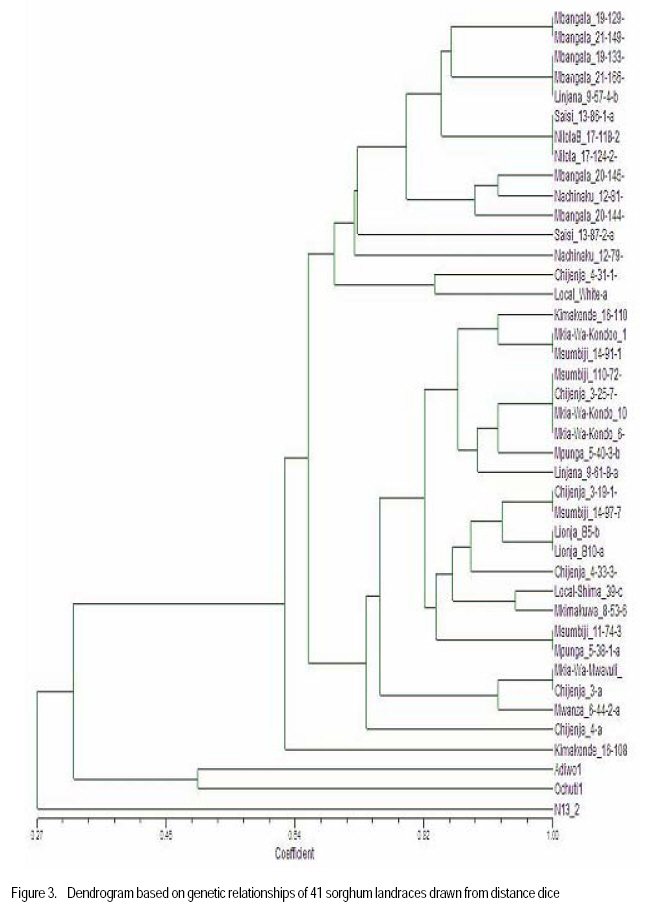
African Crop Science Journal, Vol. 17, No. 2, 2009, pp. 71-86 Genetic variability characterisation of Tanzania sorghum landraces based on simple sequence repeats (SSRs) molecular and morphological markers Tulole Lugendo Bucheyeki ,C. Gwanama1, M. Mgonja2 , M. Chisi3, R. Folkertsma4 and R. Mutegi4 University of KwaZulu-Natal, Room 116, Rabie Saunders, Carbis Road, Pietermaritzburg, KwaZulu-Natal, South Africa (Received 13 May, 20008; accepted 29 August, 2009) Code Number: cs09007 ABSTRACT Morphological and molecular markers were employed to study the genetic variability among 40 sorghum landraces collected from Tanzania and two from Zambia. A total of 14 morphological markers and seven simple sequence repeats (SSRs) primers were used to (i) determine the genetic relationships among landraces, and (ii) assess important agronomic traits. Five principal components accounted for 73.60% of the total variability. There were positive significant correlation between yield and inflorescence width (r = 0.343*), five panicles averages and plot yields (r = 0. 531*), leaf senescence and inflorescence length (r = 0.355*). Negative significant correlation between tiller numbers and inflorescence length (r = -0.343*) was recorded. Cluster analysis based on morphological traits revealed three major distinct groups with one landrace forming independent cluster. Based on molecular markers, eleven clusters were observed. Sorghum controls, N13, Ochuti and Adiwo each formed independent clusters. Markers Xgap84 and Xtxp320 had high alleles than other markers. These had seven and eight alleles respectively. Molecular markers clearly separated landraces within and between groups than morphological markers. There were no genotype specific makers with the exceptions of Ochuti and N13 controls. Key Words: Landraces, Sorghum bicolor, SSRs, Zambia RÉSUMÉ Les marqueurs morphologiques et moléculaires ont été utilisés pour étudier la variabilité génétique de 40 variétés locales du sorgho collectées en Tanzanie et 2 en Zambie. Au total 14 promoteurs pour les marqueurs morphologiques et 7 pour les marqueurs microsatellites ou SSRs (simple sequence repeats) ont été utilisés pour (1) déterminer les rapports génétiques des variétés (2) évaluer les traits à importance agronomique. Cinq composantes principales correspondaient à 73.6% du total de variabilité. Des corrélations linéaires positives ont été trouvées entre les le rendement et la largeur de l'inflorescence (r=0.343*) ; Cinq moyennes de panicules et le rendement parcellaires (r=0.531*) ; et la sénescence des feuilles et la longueur de l'inflorescence (0.355*). Une corrélation négative a été enregistrée entre le nombre de talles et la longueur de l'inflorescence (r=0.343*). L'analyse cluster basée sur des traits morphologiques a révélé 3 groupes distinctifs majeurs avec une variété locale formant un cluster indépendant. En se basant sur les marqueurs moléculaires, onze clusters été observes. Les varietes témoins, N13, Ochuti et Adiwo chacune formaient des clusters indépendants. Les marqueurs Xgap84 and Xtxp320 avaient des allèles plus élevés que les autres marqueurs, avec respectivement, sept et 8 allèles. Les marqueurs moléculaires ont sépare clairement les varietes parmi et dans les groups distinctifs que mieux les marqueurs morphologiques. Il n'y avait pas de marqueurs phénotypiques spécifiques à l'exception des témoins Ochuti et N13. L'information générée par cette étude peut être utilisée par des sélectionneurs pour l'amélioration du sorgho. Mots Clés: Variété, Sorghum bicolor, SSRs, Zambie INTRODUCTION Sorghum [Sorghum bicolor (L.) Moench] is one of the important staple cereals in the semi-arid regions of the world (Doggett, 1988; Rohrbach et al., 2002). It is well adapted to the range of environmental conditions in semi-arid Africa, with high variability (Doggett, 1988; Teshome et al., 1997; Rami et al., 1998). In Tanzania, both improved and landrace varieties are available and there is great variability in the cultivated and wild sorghum. Improved sorghum varieties respond well to the input supply and other improved managements. However, they are generally susceptible to both biotic and abiotic stresses and have poor storage, processing and nutrition qualities as compared to landraces (Beta and Corke, 2001; Kenga et al., 2004; Mgonja et al., 2005; Medraoui et al., 2007). Consequently; the rate of adoption of new varieties is low (Wubeneh and Sanders, 2006; McGuire, 2008) . On the other hand, landraces perform well under sub-optimal conditions as they are well adapted to local stresses and possesses farmers' preferable traits (Bantilan et al., 2004; Setimela et al., 2004). It is, therefore, necessary to study the genetic relationships of these landraces and identify traits to be incorporated in the released varieties. Genetic characterisation of genotypes gives descriptive information of the traits and helps in understanding the similarities and differences among genotypes (IBPGR and ICRISAT, 1993). Both morphological and molecular markers are used to save this purpose. Morphological characterisation was the first method used by researchers to select superior genotypes, spring wheat (Briggs, 1991), barn swallows (Cadee, 2000), and maize (Beta and Corke, 2001; Geleta and Labuschagne, 2005; Barnaud et al., 2007). However, several studies show that morphological markers are not suitable for traits with low heritability and are highly affected by environments (Smith and Smith, 1992; Redfearn et al., 1999; Cadee, 2000). These limitations have lead to the evolution of molecular markers. There are various molecular markers, and the choice of the molecular markers to use is dependant on cost effectiveness, simplicity, high throughput, number of samples, degree of relatedness between samples, research objectives and knowledge on the target genotype (Avise, 1995; Ji et al., 2004). The common molecular markers are Restriction Fragment Length Polymorphisms (RFLPs), Random Amplified Polymorphism DNA (RAPDs), Amplified Length Fragment Polymorphisms (ALFPs) and Simple Sequence Repeats (SSRs) (Powell et al., 1996; Pejic et al., 1998). Among these, SSRs have added advantage of being relatively cheap and highly discriminative (Missiaggia and Grattapaglia, 2006). They are often used to distinguish cultivars (Karp et al., 1996). Agrama and Tuinstra (2003) reported that SSRs are codominant and highly informative and do not require radioisotopes. Furthermore, SSRs are neutral and solves the problem of linkages to deliver unbiased genetic diversity (Kashi and King, 2006). Therefore, SSRs markers are useful tools for characterisation of genotypes (Dean et al., 1999; Ghebru et al., 2002). They have been utilised by other researchers to study variability in sorghum. Ghebru et al. (2002) used SSRs to characterise 28 Eritrean sorghum landraces. Agrama and Tuinstra (2003) applied, SSR and RAPD's to analyse the diversity of 22 sorghum genotypes. There are various studies that combined morphological and molecular markers to characterise crops elsewhere, ryegrass (Jianyang 2005), rice (Ogunbayo et al., 2005; Yi et al., 2005), maize (Beyene et al., 2005), sorghum (Dahlberg et al., 2002) and concluded reliable and useful information for breeders. However, genetic information among landraces in the central and southern Tanzania is lacking. The objectives of this study were to (i) determine the genetic relationships and thus establish the potential for landraces as sources of breeding material for future sorghum improvement; and (ii) assess important agronomic traits for sorghum classification. MATERIALS AND METHODS Field evaluation. Field characterisation of 40 sorghum landraces (Table 1) was carried out at Mansa Technology Assessment Site (TAS) in Tanzania during the 2003/2004 growing season. Mansa TAS is situated at 1241.45 m.a.s.l and lies at latitude 11° 14.384 S, and 028° 57.267 E longitudes. Two blocks with plot size of two 5 m rows and spacing of 75 cm x 50 cm were used. Eight seeds were planted and then thinned to one plant per station. Fertiliser (N: P2O5: K2O: S = 10: 20: 10: 5) (basal) at the rate of 200 kg ha-1 was applied. Urea fertiliser (46% N) was applied at the rate of 100 kg N ha-1 four weeks after planting. Two weeding were done per season. Phoskill (Monocrotophos 36 SL) 560 ml in 250 litres of water per hectare was used to control stalk borers. Data were recorded according to (IBPGR and ICRISAT, 1993). DNA Extraction. Laboratory work on molecular diversity analysis was done at BioScience for Eastern and Central Africa (BECA) in Kenya. Fourty landraces, 38 from Tanzania and two from Zambia were used in this study (Table 1). DNA was extracted from two-weeks old leaf tissue according to Mace et al.(2004) with minor modifications. For each of the landraces, three DNA samples were made, each DNA sample consisting of DNA extracted from a pool of ten individual plants belonging to that landrace. A total of 123 DNA samples, 3 individual pools per landrace, were obtained. Extracted genomic DNA was quantified by agarose gel electrophoresis after digestion with restriction endonucleases. All samples were diluted to a final concentration of 2.5 ng µl-1 and arranged in a 96 well plates for PCR reactions. SSR primers. Seven SSR markers, specific for sorghum previously used for the analysis of the genetic variation of sorghum accessions from ICRISAT genebank were obtained from Genomechanix (India) and ABI (India). Marker designations, forward and reverse primers and their sequences were considered (Table 2). PCR optimisation. The PCR reaction conditions of the primers were optimised using a modified Taguchi method that is designed to reveal the effects and interactions of specific reaction components simultaneously, using a few reactions (Cobb and Clarkson, 1994; Ferguson et al., 2004). Primer concentrations of 0.5 pM, 1 pM and 2 pM; DNA amounts of 0.3 ng, 0.5 ng and 0.6 ng; Mg2+ concentrations of 1 mM, 1.5 mM and 2 mM; dNTP concentrations of 0.05 mM, 0.075 mM and 0.1 mM; and Taq polymerase of 0.125 U, 0.2 U and 0.25 U were used. Each reaction was carried out in a final volume of 5 ml. This resulted in nine orthogonal arrays of different PCR components (Table 3). Initial denaturation for 15 min at 94 °C was done. Then, 10 cycles of denaturation for 10 seconds at 94 °C, annealing at 61-52° C for 20 seconds and extension for 30 seconds at 72 °C were performed. The annealing temperature for each succeeding cycle was reduced with 1 °C. Thereafter, 30 cycles of denaturation for 10 seconds at 94 °C, annealing at 54 °C for 20 seconds and extension at 72 °C for 30 seconds was used. A final extension of 20 min at 72 °C was included to minimise the +A overhang. Capillary electrophoresis. PCR products were pooled post-PCR, where 0.5 ìl of the FAM-labelled product, 0.5 ìl of the HEX-labelled product and 0.5 ìl of the NED-labelled product was mixed with 8.5 ìl of formamide (Perkin Elmer-Applied Biosystems), 0.3 ìl of the ROX-labelled 400 HD size standard (Perkin Elmer-Applied Biosystems) and 4.2 ìl of distilled water. DNA fragments were denatured and size fractioned using capillary electrophoresis on an ABI 3730 automatic DNA sequencer (Perkin Elmer-Applied Biosystems). The Genemapper software Version 3.7 (Perkin Elmer-Applied Biosystems) was applied to size peak patterns, using the internal ROX 400 HD size standard and for allele calling. To verify the repeatability of each PCR and each capillary electrophoresis run, three control samples (accessions Adiwo, Ochuti and N13) were included during PCR of each SSR marker and during each capillary electrophoresis run. Data analysis. Morphological data. Qualitative traits were scored as one or zero binary data. Traits with more than one state, such as colour, were subjected to decomposition into binary data by considering one state at a time. The statistical package for social scientists (SPSS) (2006) and Genstat (2006) statistical softwares (for cluster analysis and principal component analysis, respectively) were used for data analysis. Studied traits and their abbreviations are shown in Table 4. Cluster analysis, based on euclidean distances as similarity measures and the unweighted pair-group method with arithmetic averages (UPGMA) were used to analyse the genetic relationships among landraces. Principal component analysis was employed to analyse traits that contributed significantly to the discrimination of genotypes. Molecular markers data. The resulting similarity matrix was subjected to sequential agglomerative hierarchical nested (SAHN) clustering using unweighted pair-group method analysis (UPGMA) suggested by Sneath and Sokal (1973) and implemented in NTSYSpc. RESULTS Table 5 presents correlation coefficients of 14 pairs of traits used to study sorghum landraces. There was positive and significant correlation between yield and inflorescence width (r = 0.343*), five panicles averages yield and plot yield (r = 0. 531*), leaf senescence and inflorescence length (r = 0.355*). There were high significant correlations between stem diameter and leaf number (r = 0.621**), and stem diameter and 100 grain weight (r = 0.649**). Significant high correlation was recorded on average weight of five panicles with inflorescence length (r=0.334*), with inflorescence width (r = 0.375*) and with grain numbers panicle-1 (r = 0.489**). A negative significant correlation between tiller numbers and inflorescence length (r = -0.343*) was also recorded. There was also negative significant correlation between 100 grain weight and number of tillers(r = -0.415**) and with grain numbers panicle-1 (r = -0.684**). Table 6 shows results of principal components used to analyse sorghum landraces. Five principal components accounted for 73.60% of the total variability. The eigen value for the first axis was high (3.245) and lower for the fifth (1.044). The first principal component variations were mainly due to hundred-grain-weight and main stem diameter. The second principal component was highly loaded by average weight of five panicles, grain number panicle-1 and grain yield per plot. Height and leaf length averages mainly constituted variations in principal component three. The fourth principal component was mainly measured by tiller diameter and number of tillers per plant averages. Inflorescence length and leaf senescence mainly measured the average variations in principal component five. Table 7 shows five similarity cluster groups variations of the landraces. The high variations among landraces was found mainly contributed by grain number per panicle, plant height, inflorescence length, average weight of five panicles and inflorescence width. Table 8 shows yield components characteristics of the landraces. High significant grain yield was observed in Msumbiji-14-97-7 (3.74 t ha-1), Chijenja-3-19-1(2.36 t ha-1), Local nshima (2.32 t ha-1) and Msumbiji-14-91-1 (2.18 t ha-1) landraces. Mkia wa kondoo 6-43-1 and Mwanza 6-44-2 landraces recorded the lowest yield (0.52 t ha-1) each. By plotting the first and second principal components (Figure 1) from the correlation matrix, traits showed majority of landraces occupying the area between -2 and 2 for both X and Y axis, with Nkota B- 17- 118-2, Msumbiji -14-97-7 and Mkia wa kondoo-6-43-1 as outliers. Based on principal components, five distinct clusters were observed. By considering Figure 1 and Figure 2, the following observations were recorded. Cluster 3 had a mixture of landraces from Cluster I and two in the dendrogram. Cluster 4 had all members from cluster 1 in the dendrogram. Both landraces from Zambia were placed in Cluster 5. Figure 2 presents dendrogram clusters based on morphological data at cluster distance 5 that revealed three major distinct groups with one landrace forming independent cluster. The rest (two clusters) had two sub clusters each. Cluster 1 was mainly composed of landraces collected from southern Tanzania, with the exception of Mwanza 6-44-2 and Mbangala 19-133 collected from central Tanzania and Local nshima from Zambia. Cluster 2 was a mixture of landraces collected from central and southern Tanzania, with the exception of Mwanza 6-44-2 and Mbangala 19-133; all landraces from central Tanzania were placed in this cluster. Local nshima from Zambia constituted an independent cluster. On molecular markers, all SSR markers showed high reproducibility, with high consistency in amplified products between PCR and ABI runs of the three controls: Adiwo, Ochuti and N13. Markers were polymorphic, although Xcup07, Xcup62, Xcup69 showed polymorphism with the control samples. The most useful markers were Xgap84 and Xtxp320. Genotype specific markers were Xcup07 with allele 273 for Ochuti and Xgap84 allele 214 for N13 (Table 9). Dendrogram at 0.82 similarity coefficient revealed eleven clusters (Figure 3). Three sorghum controls, N13, Ochuti and Adiwo each formed independent clusters. DISCUSSION Analysis of 40 sorghum landraces using 14 morphological traits showed the presence of variations among landraces. Sorghum traits variations were also observed by Teshome et al. (1997) study where 14 traits were used to classify sorghum in Ethiopia. The high variations exhibited by inflorescence width, weight of panicles, stem diameter, grain number, and grain yield and inflorescence length traits indicate the potentiality of landraces as breeding materials. All these traits had positive effects on grain yield components (Table 5), except stem diameter which showed negative effect on grain number. The variability contribution of these traits was further confirmed by their contribution to principal component scores and similarity cluster groups formation (Table 6 and 7). The high variability observed by this study can be attributed to farmers' practice of interspecific intercropping of sorghum landraces, which increases the chances of gene flow within and outside the genotypes (Barnaud et al., 2007). Seed exchange among farmers could be another contributing factor to high variation among sorghum landraces. A study conducted by Nathaniels and Mwijage (2000) revealed sorghum seed exchange among farmers in southern Tanzania as one of the sources of planting seeds. In Zambia, Gwanama and Nichterlein (1995) found the existence of seed exchange among farmers by which 40 % seed for field planting was common. The presences of distinct landraces groups as exhibited by this study have advantages in plant breeding. This suggests that, genetic improvement through crossing among and outside landraces can be practiced (Falconer and Mackay, 1996). High significant grain yield observed in Msumbiji-14-97-7 (3.74 t ha-1), Chijenja-3-19-1(2.36 t ha-1), Local nshima (2.32 t ha-1) and Msumbiji-14-91-1 (2.18 t ha-1) landraces, indicates that, landraces can provide a comparable reasonable yield and that, there is potential yield in sorghum landraces in Tanzania. A negative significant correlation between tiller numbers and inflorescence length (r = -0.343*), 100-grain weight and number of tillers (r = -0.415**), 100-grain weight with grain numbers panicle-1 (r = -0.684**) could be utilised in breeding for negative correlated traits. Clustering of sorghum landraces according to the area of collection and their pedigrees as shown by this study indicates variation and diversity of these landraces. Other studies revealed similar results (Dean et al., 1999; Ghebru et al., 2002). Clustering of Chijenja 4-31 -1 and local white from Zambia may imply gene flow from southern Tanzania and Zambia. The presence of clusters with mixed landraces of origin can be due to close distances between central, southern part of Tanzania and Zambia and farmers selection for specific uses. Specific sorghum use like local brewing in these regions has imposed a positive selection pressure towards brewing requirement traits (Tusekwa et al., 2000). Manzell et al.(2007) reported similar results on sorghum populations in Somalia. Unlike morphological markers which revealed five and three clusters for principal components and dendrograms, respectively; molecular markers separated within and between landraces groups and placed them in 11 clusters. This is in accordance with findings elsewhere (Beyene et al., 2005; Ogunbayo et al., 2005). However, morphological markers managed to show genetic patterns and relationships among landraces. CONCLUSION High variations and similarities exist among sorghum landraces in Tanzania. Variations are mainly contributed by inflorescence width, weight of panicles, stem diameter, grain number, and grain yield and inflorescence length. Molecular markers characterisation was found to be more effective and reliable than morphological characters. High grain yield observed in Msumbiji-14-97-7, Chijenja-3-19-1, Local nshima and Msumbiji-14-91-1 could be utilised as materials for grain yield improvements. ACKNOWLEDGMENT We acknowledge the Rockefeller Foundation for funding the study in Zambia; and Ministry of Agriculture, Tanzania and Zambia for proving the enabling environment. REFERENCES
Copyright © 2009, African Crop Science Society The following images related to this document are available:Photo images[cs09007t9.jpg] [cs09007f2.jpg] [cs09007t2.jpg] [cs09007t8.jpg] [cs09007t6.jpg] [cs09007t7.jpg] [cs09007t1.jpg] [cs09007t5.jpg] [cs09007t3.jpg] [cs09007f1.jpg] [cs09007f3.jpg] [cs09007t4.jpg] |
| |||||||||
