 |
| About Bioline | All Journals | Testimonials | Membership | News |
|
||||||
|
||||||
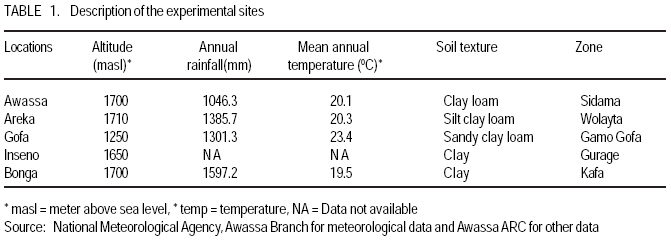
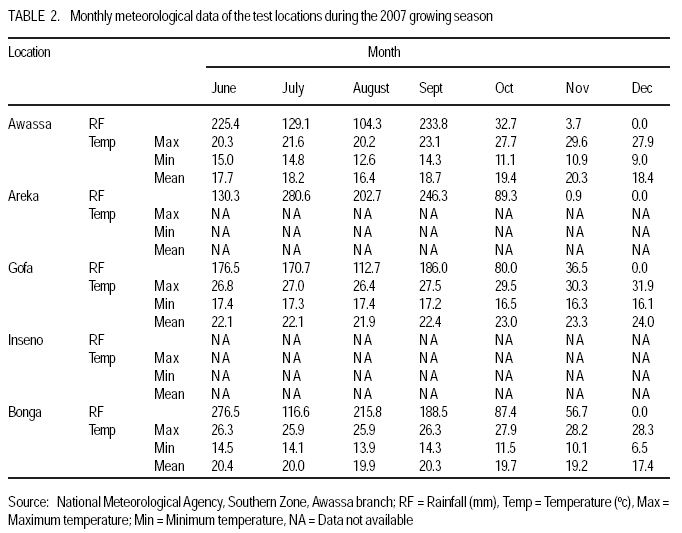
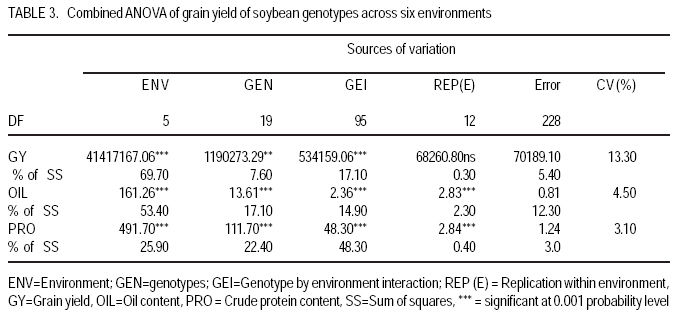
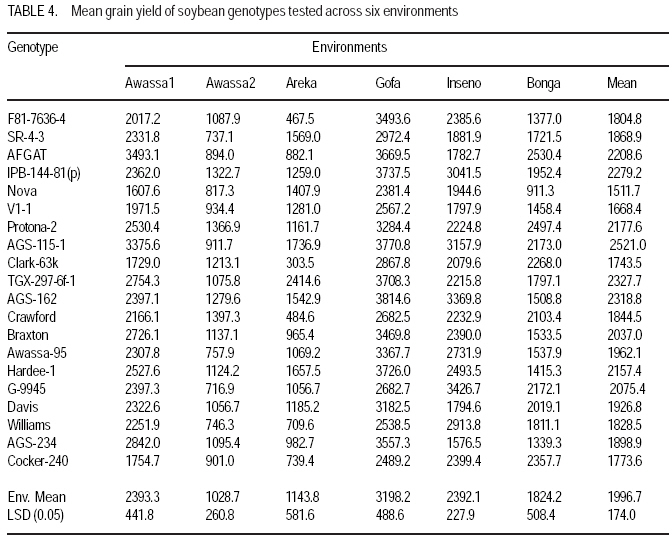
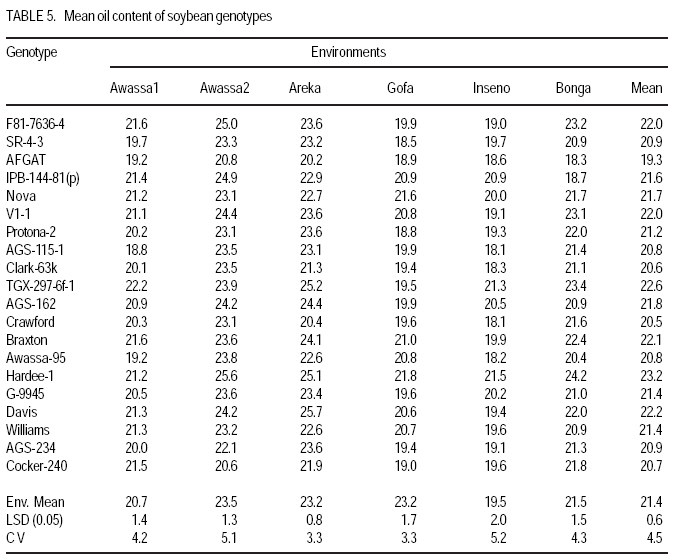
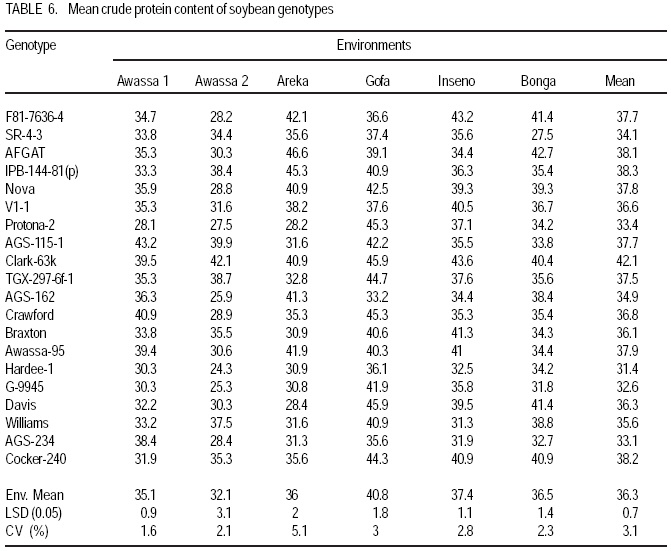
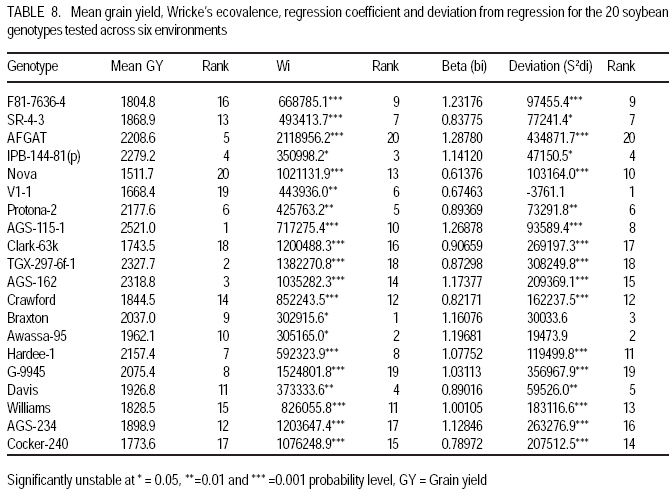
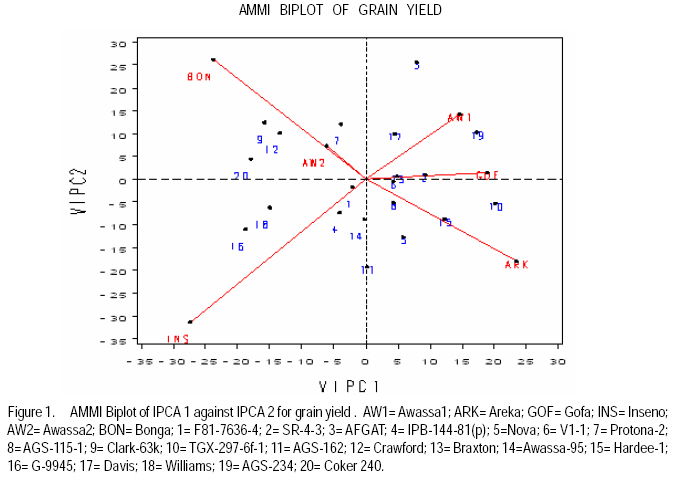
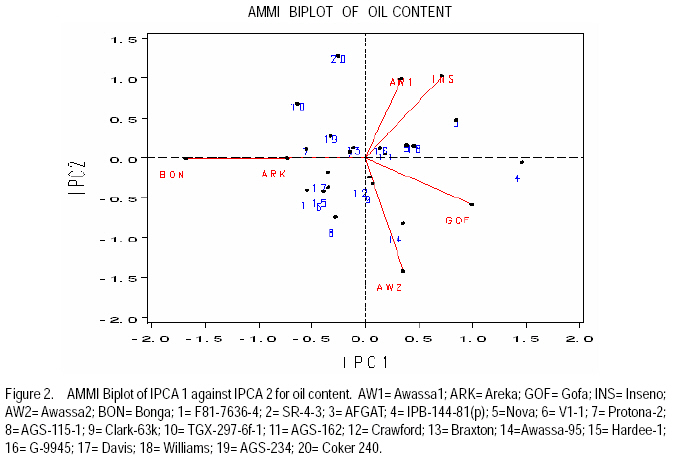
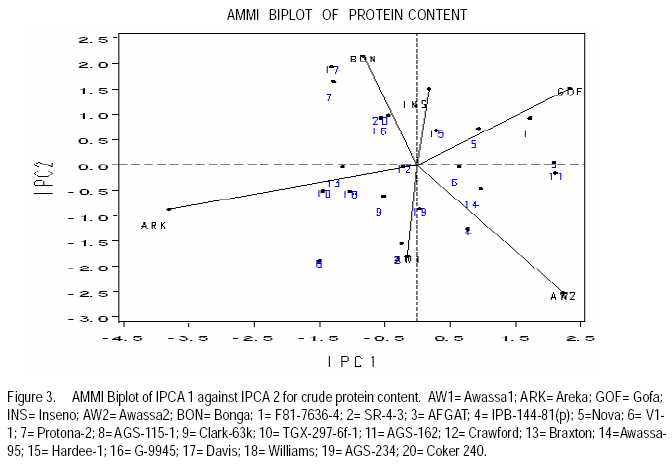
African Crop Science Journal, Vol. 17, No. 2, 2009, pp. 87-99 Genotype X environment interactions and stability of soybean for grain yield and nutrition quality Fekadu Gurmu, Hussein Mohammed1 and Getinet Alemaw2 Awassa Agricultural Research Center, P.O. Box 6, Awassa, Ethiopia (Received 2 January, 2009; accepted 2 May, 2009) Code Number: cs09008 ABSTRACT Soybean Glycine max (L.) Merrill] is the world's leading source of oil and protein. It has the highest protein content of all food crops and is second only to groundnut in terms of oil content among food legumes. Study on genotype x enviroment interaction (GE) and stability of twenty soybean [Glycine max (L.) Merrill] genotypes was conducted for grain yield, oil and crude protein content at six environments in 2007. The objectives of the experiment were to determine the magnitude of GEI and stability of released and elite soybean genotypes and thereby identify widely and/or specifically adapted genotypes under Ethiopian conditions. There are strong significant (P<0.01) environment, genotype and GEI effects, and environment and GEI captured larger portion of the total sum of squares, which reveals the influence of the two factors in evaluating soybean genotypes and, hence, the need for stability analysis. Three most popular stability parameters were used for stability analysis. Three genotypes that had medium yield performance, IPB-144-81(p), Braxton and Awassa-95, were identified as stable genotypes for grain yield. The three top yielding genotypes, AGS-115-1, TGX-297-6f-1 and AGS-162, were found unstable and can be recommended for narrow adaptation to Gofa, Areka and Inseno, respectively. Haddee-1 and Braxton were genotypes with high oil content and showed stable performance across the environments. TGX-297-6f-1 had high oil content but unstable with specific adaptation to Bonga. Clarck-63k had the highest crude protein content and also very stable one. IPB-144-81(p) and AFGAT had high crude protein content but very unstable and specifically adapted to Areka. Key Words: AMMI, Glycine max, joint linear regression, oil content RÉSUMÉ La Glycine de soja (L.) Merrill maximum] est la source principale mondiale des huiles et des protéines. Elle a la teneur la plus élevée en protéines de toutes les cultures vivrières et est en second lieu seulement après l'arachide en termes de contenu d'huile parmi des légumineuses. L'étude sur l'interaction d'environnement du génotype X (GE) et la stabilité de vingt génotypes de soja [Glycine (L.) Merrill maximum] a été entreprise pour le rendement de grain, l'huile et la teneur en protéines brutes dans six environnements en 2007. Les objectifs de l'expérience étaient de déterminer l'importance de GEI et la stabilité des génotypes libérée et d'élite de soja et d'identifier de ce fait des génotypeslargement et/ou spécifiquement adaptés dans des conditions éthiopiennes. Il y a des fortes significations (P<0.01) l'envionnement, le génotype et les effets de GEI, et environnement et GEI ont capturé une plus grande partie de toute la somme des carrés, ce qui indique l'influence des deux facteurs dans des génotypes de évaluation de soja et, par conséquent, le besoin d'analyse de stabilité. Trois paramètres de stabilité les plus populaires ont été employés pour l'analyse de stabilité.Trois paramètres de stabilité les plus populaires ont été employés pour l'analyse de stabilité. Trois génotypes qui ont obtenu la performance de rendement moyenne, IPB-144-81 (p), Braxton et Awassa-95, ont été identifiés en tant que génotypes stables pour le rendement de graine.Trois génotypes qui ont eu l'exécution de rendement moyenne, IPB-144-81 (p), Braxton et Awassa-95, ont été identifiés en tant que génotypes stables pour le rendement de grain. Les trois premiers génotypes, AGS- 115-1, TGX-297-6f-1 et AGS-162, ont été trouvés instables et peuvent être recommandés pour l'adaptation étroite à Gofa, à Areka et à Inseno, respectivement.Haddee-1 et Braxton étaient des génotypes avec le contenu élevé d'huile et ont demontré une stable performance à travers les environnements. TGX-297-6f-1 a eu le contenu élevé d'huile mais instable avec l'adaptation spécifique à Bonga. Clarck-63k a eu la plus haute teneur en protéines brutes et également la plus stable. IPB-144-81 (p) et AFGAT ont eu la teneur élevée en protéines brutes mais très instable et spécifiquement adapté à Areka. Mots Clés: AMMI, Glycine max, joint linear regression, oil content INTRODUCTION Soybean Glycine max (L.) Merrill] is the world's leading source of oil and protein. It has the highest protein content (40%) of all food crops and is second only to groundnut in terms of oil content (20%) among food legumes. The meal is also rich in minerals, particularlycalcium, phosphorus and iron (Beversdorf et al., 1995; Norman et al., 1995; Ogoke et al., 2003). In Ethiopia, soybean is grown over wider agro-ecologies especially in low to mid altitude areas (1300 to 1700 masl) that have moderate annual rainfall (500-1500mm) and, hence. it is exposed to the influence of GEI. Sprague (1966) indicated that GEI constitutes an important limiting factor in the estimation of variance components and in the efficiency of selection programmes. The presence of a significant GEI for quantitative traits such as seed yield can reduce the usefulness of subsequent analysis, restrict the significance of inferences that would otherwise be valid, and seriously limit the feasibility of selecting superior genotypes (Flores et al., 1998). Baker (1988) defined GEI as the failure of genotypes to achieve the same relative performance in different environments. However, in most cases, breeders look for a variety that has good mean performance over a wide array of environments and years and the concept of stability is overlooked. Such approach is reasonable if there is no GEI, but in most cases there is interaction. Some genotypes can have high yield in few environments and very low yield in other environments, showing better mean performance across environments. But few genotypes may have average yield that is stable over wider environments. Therefore, knowledge of the pattern and magnitude of GEI and stability analysis is important for understanding the response of different genotypes to varying environments and for identification of stable and widely adapted and unstable but specifically adapted genotypes. Moreover, it is important for breeding new cultivars with improved adaptation to the environmental constraints prevailing in the target environments. Stability of yield of a cultivar across a range of production environments is very important for variety recommendation. The cultivars must have the genetic potential for superior performance under ideal growing conditions, and must also produce acceptable yields under less favorable environments. Therefore, a stable genotype can be referred to as the one that is capable of utilising the resources available in high yielding environments and has a mean performance that is above average in all environments (Eberhart and Russell, 1966; Allard and Bradshaw, 1964). However, in Ethiopia, information on the extent and pattern of GEI and performance stability on soybean is scanty. The objectives of this study were to: (i) determine the magnitude of genotype by environment interaction for yield, oil and crude protein content of soybean genotypes under Ethiopian conditions; (ii) determine yield, oil and crude protein content stability for released varieties and promising soybean genotypes and (iii) to identify genotypes that are widely adapted (stable) and specifically adapted (with narrow adaptation) for the three traits. MATERIALS AND METHODS Twenty soybean genotypes of early and medium maturity groups (eight released and 12 elite) were used for the study. The experimental materials were F81-7636-4, SR-4-3, AFGAT, IPB-144-81(p), Nova, V1-1, Protana-2, AGS-115-1, Clark-63k, TGX-297-6f-1, AGS-162, Crawford, Braxton, Awassa-95, Hardee-1, G-9945, Davis, Williams, AGS-234 and Cocker-240. The materials were obtained from Pulse Crops Improvement Section of Awassa Agricultural Research Center. The experiments were conducted at five locations, Awassa, Areka, Gofa, Inseno and Bonga in 2007 (Table 1). The monthly meteorological data of the test locations during the growing season of 2007 is presented in Table 2. Awassa location was used as two distinct environments because the second planting was made in late August and encountered moisture stress during flowering and pod filling stage of the crop. As indicated in Table 2, in Awassa case, the rainfall was drastically declining starting from September, while the mean temperature was increasing during the pod filling stage of the crop; from October to November. Therefore, the plants were stressed and exposed to forced maturity. A randomised complete block design (RCBD) with three replications was used to conduct the experiments. Plot size was 6.4 m2 consisting of 4 rows each 4 m long. The inter and intra-row spacing was 40 cm and 5 cm, respectively, resulting in 80 plants per row and 320 plants per plot. The two middle rows (3.2 m2) were used for data collection and harvested at maturity. Oil content was determined using Magnetic Resonance Spectrometer and crude protein content was determined using the method of Micro Kjeldahl. Analysis of variance. Grain yield, oil and crude protein content data were subjected to analysis of variance separately for each environment and combined over environments. The statistical model used for ANOVA is: Yijk = m + Gi + Ej + GEij + Bk(j) + eijk Where, Yijk = observed value of genotype i in block k of environment (location) j, ì = grand mean, Gi = effect of genotype i, Ej= environment or location effect, GEij = the interaction effect of genotype i with environment j, Bk(j) = the effect of block k in location (environment) j, eijk= error (residual) effect of genotype i in block k of environment j. Mean separation was conducted using Least Significant Difference (LSD) Test to discriminate the genotypes and identify superior ones based on the trait of interest. ANOVA is important in detecting the presence of GEI but it does not indicate which genotypes possess more contribution to the interaction and which of the genotype/s is/are stable across environments. Stability analysis. After testing the significance of GEI mean square with ANOVA, stability analysis was conducted for the three traits, grain yield, oil and crude protein content using means of genotypes at each environment by SAS GLM (Hussien et al., 2000). Among the several stability parameters proposed by different authors, three most popular ones were used in this study. These were Wricke's ecovalence, the joint linear regression analysis of Eberhart and Russell (1960) and Adaptive Main Effects and Multiplication Interaction (AMMI) model. Wricke's ecovalence (Wi) can be defined as a contribution of each genotype to the GEI sum of squares. According to this concept, a genotype with lower values of Wricke's ecovalence is stable. According to Eberhart and Russell's (1966) joint linear regression analysis, genotypes with high mean yield, low regression coefficients (b=1) and non-significant deviation from regression (s2d = 0) are the most stable. Genotypes with b>1 are the ones which are specifically adapted to favorable environments, and genotypes with b<1 are specifically adapted to unfavorable environments. Currently, AMMI models are being widely used for analysing main-effects and genotype by environment interactions in multi-location variety trials. RESULTS AND DISCUSSION There was a very high significant (P<0.001) difference among genotypes for grain yield, oil and crude protein content). Combined ANOVA was also conducted and the result is presented in Table 3. The environment variance, genotype variance and genotype x environment interaction variance were highly significant (P <0.01). Similar results were also reported by different authors. A study conducted on GEI and yield stability of 12 food-grade soybean genotypes indicated that location x year and location x year x genotype interactions were significant (Rao et al., 2002). Using three crosses of soybean involving germplasm from USA and other countries, Shorter et al. (1977) examined F3 and F4 generations at two locations. They indicated that line and line x location interaction variances within crosses for most traits were almost all significant, except for protein, oil, and protein plus oil yield where line variances were non-significant when data were combined over locations. Regarding oil and protein content, it has also been indicated that temperature has effect on total oil and protein content of soybeans. Wolf et al. (1982), citing Howell and Cartter (1958) reported the presence of positive correlation between maximal temperature and oil percentage. Vollmann et al. (2000) using soybeans grown in Central Europe reported that considerable variation in protein content was due to seasonal influences, as demonstrated in different experiments from a breeding program. Kumar et al. (2006) conducted a study involving seven Indian soybean varieties and four growing locations to study the influence of growing environment on the biochemical and physical characteristics of soybean seed. According to this study, genotypic, location and the genotype by location interactions were found to be significant (P<0.001) for protein, oil, and unsaturated fatty acids (oleic, linoleic and linolenic). Rocha et al. (2002) also studied the effect of genotype x environment interaction on the oil content of 28 soybean lines and reported that there were significant genotypes, environments and genotype x environment interaction effects. Genotypes AGS-115-1, TGX-297-6f-1, AGS-162 and IPB-144-81(p) had the highest mean grain yield across the six environments, with mean yield of 2521.0, 2327.7, 2318.8 and 2279.2 kg ha-1, respectively (Table 4). These genotypes are all in the early maturing group and found to be promising genotypes. In the case of oil content, the combined ANOVA shows that Hardee-1 had the highest oil content (23.2%) while AFGAT had the least (19.3%) (Table 5). Hardee-1 could be a promising genotype for oil content across environments. For crude protein, the combined ANOVA revealed that Clark-63k had the highest mean of 42.1%. Hardee-1, which had the highest oil content, was the poorest protein yielder with only 31.4% content (Table 6). The total sum of squares was partitioned into components to estimate the magnitude of GEI for the three traits. In this regard, grain yield and oil content, environments took the largest portion (69.7 and 53.4%, respectively), followed by GEI which was 17.1 and 14.9%, respectively (Table 7). In the case of protein content, GEI took the largest portion of the total sum of squares (48.3%), followed by environment (25.9%). Environment and GEI together captured the largest portion of the total sum of squares (86.8%) in the case of grain yield, indicating the influence of environment and interaction effects in evaluating soybean genotypes for grain yield. DeLacy et al. (1996) and Gauch (1992) also indicated that environment and interaction effects are much more than the effects of the genotypes in most variety trials. In the case of oil and crude protein content, environment and GEI together captured 68.3 and 74.2%, respectively (Table 7). The observed figures for the two traits also indicate the influence of environment and GEI effects in evaluating soybean genotypes for the improvement of the two traits. This result is substantiated by Isaza (2002) who reported by citing Gibson and Mullen (1996) that soybean protein content and oil content and composition are influenced by environment during seed development. Stability analysis for grain yield. According to Wricke's ecovalence model, all the tested genotypes were with Wi value significantly different from zero (P < 0.05), hence they were unstable (Table 8). Nevertheless, two genotypes, one released (Awassa-95) and one in the pipeline (Braxton), which were with the lowest Wi could be considered relatively stable. These genotypes had medium yield performance ranking 9 and 10th, respectively. Best yielding genotypes that ranked 1st, 2nd and 3rd in grain yield were found to be unstable. However, genotype IPB-144-81(p) (4), which ranked 4th in grain yield also ranked 3rd in Wricke's ecovalence value. Therefore, this genotype is promising as high yielder and relatively stable. The joint linear regression analysis of Eberhart and Russell model revealed that the slope (b) did not deviate from unity (Table 8). This indicates that all the tested genotypes had average responsiveness to changing environments. However, deviation from regression was significantly different from zero for most of the tested genotypes. Kenga et al. (2003) reported similar result where the non-linear responses as measured by pooled deviations from regressions were highly significant; indicating that differences in linear response among genotypes across environments did not account for all the G x E interaction effects, and therefore, the fluctuation in performance of genotypes grown in various environments was not fully predictable. According to this model genotype V1-1 ranked first but had a very small mean yield across environments. Genotypes Braxton and Awassa-95 ranked 3rd and 2nd and were stable with medium yield performance. IPB-144-81(p), ranked 4th and could be considered relatively stable with better yield. The three top yielding genotypes; AGS-115-1, TGX-297-6f-1 and AGS-162 were unstable. Genotype AFGAT was also the most unstable genotype with Eberhart and Russell's stability model as well. In AMMI model, the first two interaction principal component axes (IPCA 1 and IPCA 2) took the largest portion (66.15%) of the interaction sum of squares (36.36 and 29.79%, respectively). The remaining portion of the interaction sum of squares was taken by IPCA 3 (17.52%) and IPCA 4 (13.02%). Using AMMI 2, that means when the two IPCAs were plotted against each other (Figure 1), seven genotypes namely, AGS-115-1, IPB-144-81(p), Braxton, F81-7636-4, V1-1, SR-4-3 and Awassa-95 were stable genotypes that have broad adaptation. AGS-115-1 and IPB-144-81(p) are high yielding genotypes. This indicates the possibility of simultaneous selection for high yield and broad adaptation as also revealed by Evans (1993) and Kang (1998). However, three genotypes, F81-7636-4, V1-1 and SR-4-3 had below average yield. The other two top yielding genotypes, AGS-115-1, TGX-297-6f-1 and AGS- 162 were found unstable and can be recommended for narrow adaptation to Gofa, Areka and Inseno, respectively. Stability analysis for oil content. Wricke's ecovalence showed that half of the tested genotypes were in the stability range for oil content (Table 9). Therefore, Hardee-1, Braxton and V1-1 had the highest oil content and were found to be stable. Other genotypes with high oil content TGX-297-6f-1, Davis and F81-7636-4 were unstable since Wi was significant (p d" 0.05). Highly stable genotypes that ranked 2nd, 3rd and 4th according to Wricke's ecovalence were G-9945, Williams and AGS-234. These genotypes also had medium and acceptable oil content. Using the joint linear regression analysis of Eberhart and Russell, among the tested genotypes, the regression coefficient (b) was significantly lower than one only for genotypes AFGAT, Nova and Cocker-240 (Table 9). Deviation from regression was also significant for only five genotypes, namely IPB-144-81(p), TGX-297-6f-1, Crawford, Awassa-95 and Cocker-240. These genotypes were considered unstable according to the stability model of Eberhart and Russell. High yielding genotypes for oil content that ranked up to 6th and also stable were Hardee-1, Davis, Braxton, F81-7636-4 and V1-1. Genotype TGX-297-6f-1, which was 2nd in its oil content, was found to be highly (pd" 0.01) unstable. Genotype G-9945 was a highly stable genotype with medium oil content (Table 9). Using AMMI model analysis, the first three interaction principal component axes (IPCA 1, IPCA 2 and IPCA 3) have taken the largest portion (84.92%) of the interaction sum of squares with 34.45 and 25.7, 24.77%, respectively. According to AMMI 2, twelve genotypes were in the range of stability among which four were with high mean oil content that was greater than 22% (Figure 2). These were Hardee-1, Davis, Braxton and V1-1. These genotypes can be recommended for wider adaptation and for production of high oil content. TGX-297-6f-1 was a genotype with high oil content but unstable and, therefore, can be recommended for specific adaptation to Bonga. IPB-144-81(P), which had above mean oil content, specifically adapted to Gofa, Inseno and Awassa 2. Stability analysis for crude protein content. The result showed that all the tested genotypes were unstable (p <0.05). Nevertheless, the genotype with the highest protein content, Clark-63k, could be considered relatively stable since it ranked 2nd in Wi ranking. Cocker-240, which ranked 3rd in protein content, and ranked 6th in the Wi could also be considered relatively stable. Both genotypes are released varieties. Hardee-1 ranked first in Wi, but had the lowest protein content (31.4%). Genotypes AFGAT and IPB-144-81 (p), which had high protein content, were found to be very unstable according to Wi. In the case of joint regression analysis, also there were no stable genotypes for crude protein content since deviation from regression was significant for all the tested genotypes. However, if relative ranking is used, the two released varieties, Clark-63k and Cocker-240 could be considered better for wider adaptation. According to the stability model of Eberhart and Russell, the two genotypes, G-9945 and Hardee-1, which ranked 1st and 2nd in their stability, cannot be considered stable since they were the least yielding genotypes for crude protein content. In AMMI model, the first interaction principal component axes (IPCA 1) took the largest portion of the interaction sum of squares i.e. 43.13%. The next highest portion of the interaction sum of squares was taken by the second IPCA, which has taken 25.0%. The AMMI graph of IPC1 against IPC2 is shown in Figure 3. According to this figure, only two genotypes, Crawford and Clark-63k were in the range of stability. The first genotype had above average crude protein content whereas the second had the highest crude protein content. Therefore, these genotypes could be recommended for wider adaptation and for production of high protein content in soybean. IPB-144-81(p) and AFGAT were high yielding genotypes for crude protein content but very unstable and specifically adapted to Areka. ACKNOWLEDGMENTS This work was part of MSc thesis sponsored by Southern Agricultural Research Institute (SARI). The authors thank all persons who participated in the execution of the field work and in shaping up the manuscript. Special appreciation is due to the Pulse Improvement Section of Awassa Agricultural Research Center for providing the test genotypes. REFERENCES
Copyright © 2009, African Crop Science Society The following images related to this document are available:Photo images[cs09008t5.jpg] [cs09008t9.jpg] [cs09008f3.jpg] [cs09008f2.jpg] [cs09008t2.jpg] [cs09008t7.jpg] [cs09008f1.jpg] [cs09008t8.jpg] [cs09008t6.jpg] [cs09008t1.jpg] [cs09008t3.jpg] [cs09008t4.jpg] |
| |||||||||
