 |
| About Bioline | All Journals | Testimonials | Membership | News |
|
||||||
|
||||||
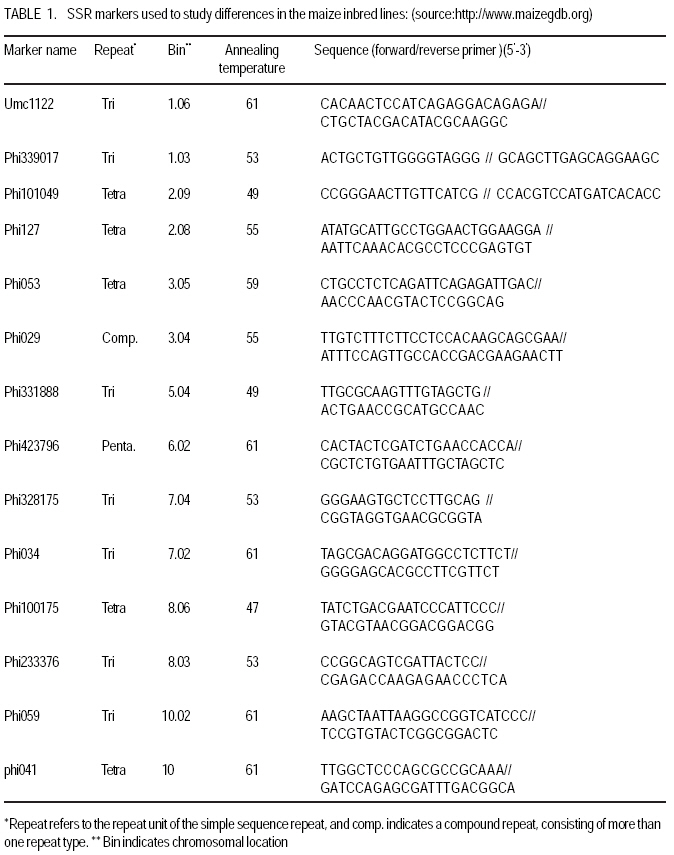
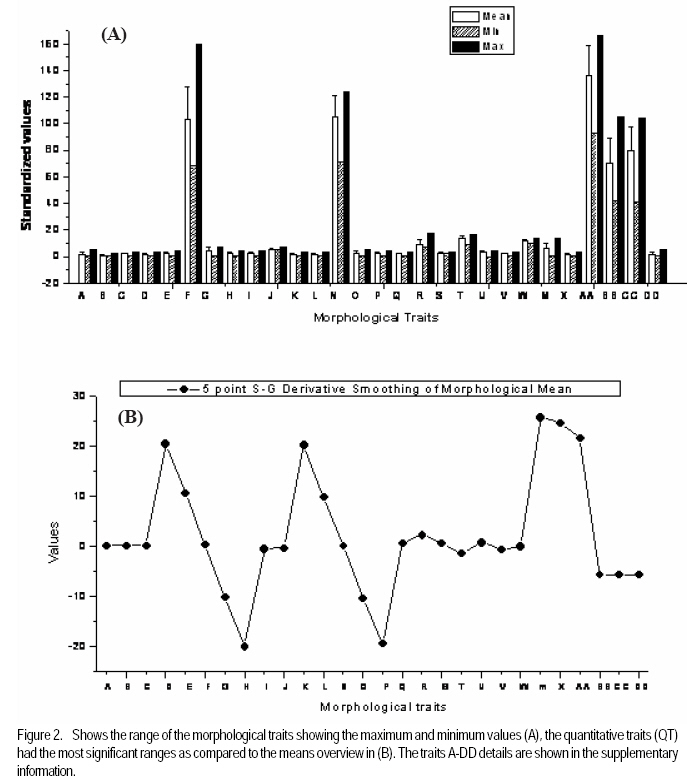
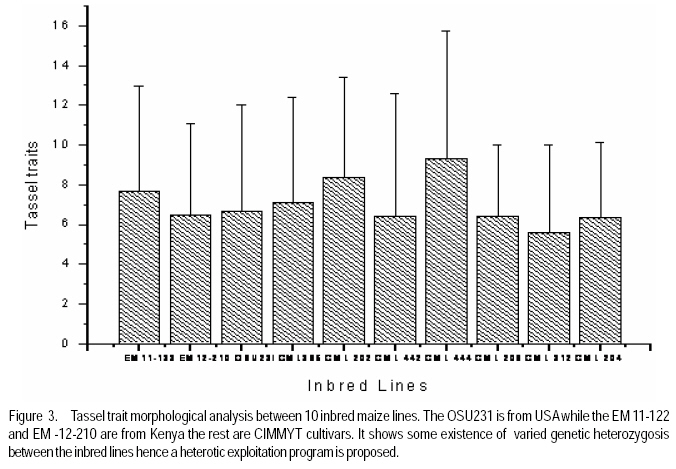
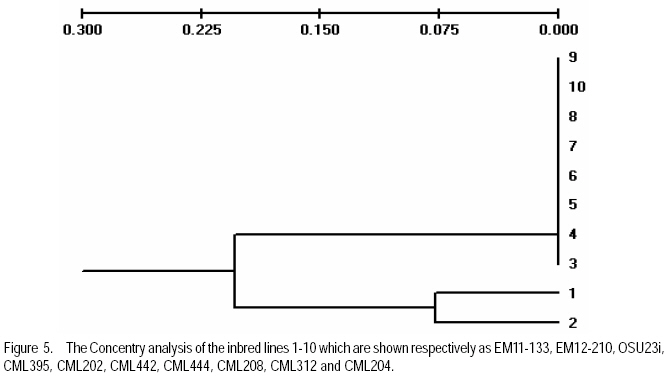
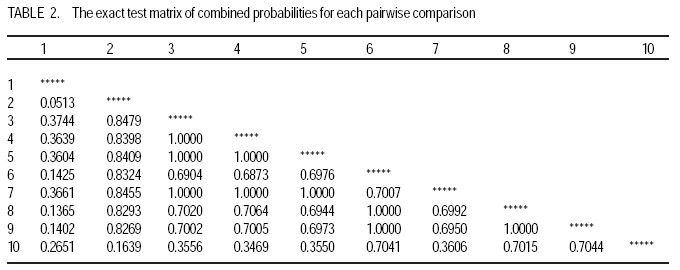
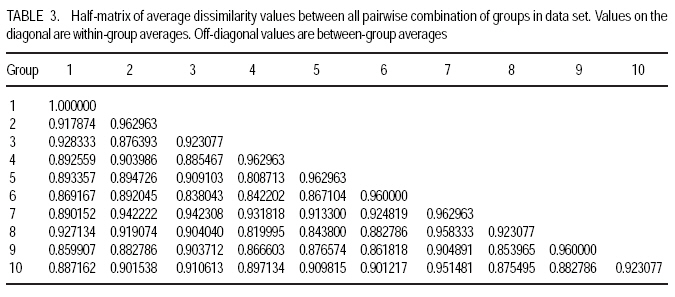
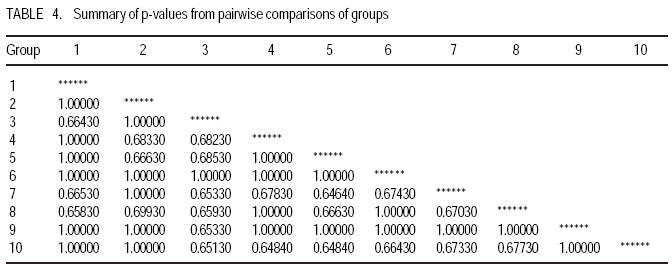
African Crop Science Journal, Vol. 17, No. 3, Sept. 2009, pp. 133-144 Microsatellite analysis of the correlation between molecular and morphological traits in assorted maize inbred lines J. Karanja, N. O. Amugune1, J. Ininda2, J.N. Kimatu3 and J. W Danson4 Kenya Agricultural Research Institute (KARI), Biotechnology Laboratory, Katumani Centre, Machakos, Kenya (Received 2 June, 2009; accepted 29 August, 2009) Code Number: cs09013 ABSTRACT The success in identifying heterosis in hybrid maize (Zea mays L.) breeding depends on the availability of reliable genetic diversity among maize inbred lines. Conventional methods of breeding have been boosted by the availability and efficiency of molecular markers. Coupling simple sequence repeat (SSR) markers with morphological markers provides thorough starting information for new inbred lines, especially from different genetic backgrounds. Furthermore, recent evidences that the environment can influence the epigenetic structure of the genome have necessitated morphological screening of crops during breeding programmes. This study used 28 agronomic traits and 14 SSR markers which are distributed uniformly in ten (1-10) inbred lines, namely EM11-133, EM12-210, OSU23i, CML395, CML202, CML442, CML444, CML208, CML312 and CML204 from Kenya, International Centre for the Improvement of Maize and Wheat (CIMMYT), and another (OSU 23i) from USA. The aim was to investigate their morphological and genetic diversity, categorise the inbred lines into useful groups based on the molecular profiles and morphological traits, and lastly determine the level of phenotype-genotype correlation. The dissimilarity calculated using SSR markers had a mean morphological dissimilarity of 0.895403, an r value of -0.1421 and a p -0.9840. The dissimilarity between the molecular and morphological traits was 0.860465. Comparison between the molecular and morphological data had a dissimilarity matrix with an r -0.2323 and a p value of 0.0120. This was probably due to intrinsic synteny in maize genome. The dendrograms generated with hierarchical Unweighted Pair Group Method with Arithmetic mean (UPGMA) cluster analysis of the Jaccard's similarity coefficient matrices revealed four major clusters. The Co-ancestry distance showed six tied groups with the Kenya cluster showing some differentiation with Exact Tests for population differentiation with a p = 0.0513. The American inbred line (OSU 23i) segregated alone, while the Kenya lines (EM11-133 and EM12-210) had close homology with the CIMMYT inbred lines (CMLs). A total of 2.0 alleles were detected among the inbred lines using bulk DNA samples and 14 SSR loci. Clustering analysis based on the genetic similarity coefficients separated the inbred lines into 4 groups with the American inbred line seeming to be genotypically more diverse from the others. Key Words: Genetic diversity, molecular markers, SSR, Zea mays RÉSUMÉ Le succès dans l'identification des hétérosis de maïs hybrides (Zea mays L.) dépend de la disponibilité d'une diversité génétique fiable dans les lignées endogames du maïs. Les méthodes conventionnelles de l'hybridation avaient été améliorées par la disponibilité et l'efficacité des marqueurs moléculaires. Le couplage des marqueurs simples de sequence répétée (SSR) avec les marqueurs morphologiques fournit des informations fondamentales précises pour les nouvelles lignées endogames, principalement de différente constitution génétique. En outre, les recentes évidences selon lesquelles l'environnement peut influencer la structure épigénétique du génome ont nécessité une selection morphologique des cultures au cours des programmes d'hybridation. Cette étude avait utilisé 28 caractéristiques agronomiques et 14 marqueurs SSR distribués uniformément en dix (1-10) lignées endogames à savoir EM11-133, EM12-210, OSU23i, CML395, CML202, CML442, CML444, CML208, CML312, CML204 qui avaient été respectivement obtenus à partir du Kenya, Centre International pour l'amélioration du maïs et du blé (CIMMYT) et l'autre des États-Unis. L'objectif de cette étude était de déterminer la diversité morphologique et génétique, catégoriser les lignées endogames en groupes importants sur base des profils moléculaires ainsi que les caractéristiques morphologiques et enfin déterminer le niveau de la corrélation phénotype-génotype. La dissimilarité calculée à l'aide de marqueurs SSR avait une difference morphologique moyenne de 0,895403, valeur de r de -0,1421 et un p de -0,9840. La différence entre les caractéristiques moléculaires et morphologiques était de 0,860465. Une comparaison entre les données moléculaires et morphologiques avait révelé une matrice non simulaire avec r= -0.2323 et une valeur de p de 0,0120. Ceci était probablement dû à la composition intrinsèque dans le génome du maïs. Le dendrogramme généré par la méthode de groupes paires hiérarchiques non pondérés avec le cluster de l'analyse de la moyenne arithmétique (UPGMA) des matrices de coefficient de similarité de Jaccard avait révélé la présence de quatre regroupements majeurs, tandis que la distance de Co-ascendance a montré six groupes liés avec le regroupement Kenya montrant une certaine différence avec les Tests Précis de différenciation de la population avec un p = 0,0513. La lignée américaine non hybride (OSU 23i) se divisait individuellement, tandis que les lignées Kenya (EM11-133 et EM12-210) avaient une homologie étroite avec les lignées non hybrides CIMMYT (CMLs). Un total de 2,0 allèles avaient été détectés parmi les lignées non hybrides à l'aide des échantillons d'ADN et 14 loci SSR. L'analyse par regroupement fondée sur les coefficients de similarité génétique avait permi la séparation des lignées non hybrides en 4 groupes ainsi que la lignée américaine non hybride semblant être genotypiquement plus diversifiée des autres. Mots Clés: Diversité génétique, marqueurs moléculaires, SSR, Zea mays INTRODUCTION The first step in the search for heterosis in crop improvement is a full characterisation of available genetic diversity, which forms the basis for the analysis of inbred lines combining ability (Verbitskaya et al., 1999; Diniz et al., 2005). Genetic diversity is the most important factor limiting the average number of alleles identified per Simple Sequence Repeats (SSR) locus during screening programmes (Legesse, 2007). Genetic diversity and the levels of genetic variations in maize can be estimated using both modern molecular markers together with early detailed studies on morphological markers (Goodman and Bird, 1977), especially for breeding programmes in crop plants. No marker can solely give all the information needed in plant adaptation, breeding, evolutionary and conservation programmes without support from another technique (Thormann et al., 1994). This is so more likely in maize as it exhibits a wider range of morphological and molecular dynamism than many other crops. Some methods can possess conspicuous limitations, but their contributions might give a crucial support to molecular or other throughput techniques. Conventional breeding can never be neglected in crop improvement, but can be boosted by the use of molecular markers in crop improvement. Although earlier studies indicated that molecular markers can not be influenced by environment like morphological traits (Smith and Smith, 1989; Williams et al., 1990; Smith and Smith, 1992), recent genetic and epigenetic studies have shown remarkable evidence of considerable environmental influence on plant development (Molinier, 2006; Li et al., 2008). Hence, a combination of morphological and molecular analysis should still form a reliable basis for germplasm selection in crop improvement programmes. Maize breeding depends on the level of the genetic diversity available which aids in the estimation of the degree of expected heterosis from inbred lines together with the level of inheritance and variation during breeding (William and Michael, 2002; Duan et al., 2006). In order to broaden the genetic base for commercial hybrid, there is need to seek for more diversity among inbreeds of which studies have shown that the pedigrees of some hybrids can be from 68 inbred lines (Darrah and Zuber, 1986; James et al., 2002). In this study, we used 10 inbred lines of which 7 were acquired from CIMMYT, 2 inbred lines from Kenya Agricultural Research Institute (KARI), which were developed in 1964; and the last one from the Ohio State University in USA. The lines had been maintained in the breeding programme (KARI-Muguga) for more than one year. There was concern that there could have been some contamination, especially for the one from USA. Tropical and subtropical maize inbred lines have been shown to possess a greater number of alleles and greater gene diversity compared to the temperate inbred lines, although advancement of inbreeding was also suspected (Liu et al., 2003). This is the first time for any type of markers to have been used on the 10 inbred lines. Hence, morphological markers were crucial at this stage and their correlation with the informative simple sequence repeats (SSR) was predicted to be important for their future usage. The use of molecular markers allows the assessment of genetic diversity at DNA level (Reif et al., 2003). The SSRs or microsatellites are reproducible (Heckenberger et al., 2002), with a high level of polymorphism (Smith et al., 1997). They are informative due to their multiallelic property with a heterozygosity which is 7-10 times higher than that in RFLPs (Vos et al., 1995) and allows the application automated analysis systems (Sharon et al., 1997). The endosperm colour in maize has been shown to be a strong indicator of genetic differentiation between different maize lines (Souza et al., 2008). The availability of PCR based SSR markers has made it possible to be used in maize (Taramino and Tingey, 1996) and other important crops like rice (Zhao and Kochert, 1993). This study aimed at assessing the genetic diversity of the maize inbred lines and estimating the genetic correlation between the morphological structure and the SSR loci variation within the maize inbreeds. MATERIALS AND METHODS Planting. The study was conducted at the Kenya Agricultural Research Institute (KARI) at Muguga South Research Centre in Kiambu District in Kenya. It is located at 2,095 meters above sea level, latitude 36º 34-36º 39`S and longitude 1º 11`-14`E. The mean annual rainfall is 946 mm. The soil types are Nitisols according to FAO/UNESCO classification and Alfisols according to USDA classification. Maize inbred lines (1-10) inbred lines were EM11-133, EM12-210 from Kenya, OSU23i from USA and CML395, CML202, CML442, CML444, CML208, CML312, CML204 from CIMMYT. They were planted in a one row plot at a spacing of 75 cm between rows and 30 cm within rows. The experiment was laid out in a randomised complete block design with three replicates. Each row had 25 plants, which constituted 44,444 plants per hectare as recommended in the testing site. This experiment was planted slightly off-season and required irrigation throughout the trial period. Diammonium phosphate was applied during planting at a rate of 3 g per hill (80 kg P2O5 and 31 kg N ha-1); while Calcium ammonium nitrate was applied as top dressing 6 weeks later at rate of 2 g per hill (80 kg N ha-1). Carbofuran (2-3,-dihydro-2, 2-dimethyl-7-benzofuranol methylcarbamate) was applied at 3 g per hill to control cutworms. Bulldock 0.05 GR (Beta-cyfluhtrin) was used to control stalk borers and cutworms. Morphological traits. Ten plants were selected randomly from each inbred line and evaluated for morphological traits. Data were recorded for days to silking (DTS) which was the number of days between emergence and when 50% of plants in each plot had 1 cm or more of the exposed silk; days to pollen shed (DTP) which was the number of days between emergence and when 50% of the plants in each plot were shedding pollen; ear height (EHT), the height from the ground level to the node bearing the upper most ears recorded as a mean of ten randomly selected plants; plant height (PHT), the height from the node of the flag leaf to the soil level recorded as a mean of ten randomly selected plants; grain yield (GY), the fresh weight of all harvested cobs for each plot. Grain moisture content was determined from a seed sample from ten randomly selected cobs subjected to oven-drying at 60 0C for 48 hr.. The weight of the harvested cobs was then adjusted to 12.5% moisture content. Yield in tonnes per hectare assuming 80% shelling percentage. Kernel weight (200SWT), which was a sample of 200 kernels from freshly harvested cobs per harvested plot, was weighed and the weight adjusted to 12.5% moisture content. Ear length (EL) was determined for five randomly de-husked cobs per plot, which were measured from the collar (base) of the ear to the tip where grain filling ends. The Ear Aspect (EA) is the relative measure of the overall appeal of harvested ears and was assessed visually on a scale of 1-5, 1 for excellent appearance and 5 for poorest appearance. Extent of grain filling and alignment of kernels on the cob were some of the factors considered when assessing ear aspect. Root and Stalk Lodging (RL and SL) were the amount of plants in each plot which either lodged at the roots (RL) or stem (SL); these were recorded and converted as a percentage. Bare Tips (BT) represented all the cobs with exposed tips which were counted and recorded as a percentage of total number of plants in the sample. Ear placement (EP) was calculated as the ratio and plant height and ear height; while Ear prolificacy (Eprol) was determined as the mean of ears per plant. Other morphological data collected included angle between blade and stem at the beginning of anthesis assessed as small, medium or large; anthocyanin colouration of the sheath when the grains were watery ripe; glumes at the base and tassels at halfway anthesis (at the scale: very weak, weak, medium, strong, or very strong); width of the leaf at the medium milk grain stage; intensity and colouration of silk at halfway anthesis, among others. Sampling and lyophilisation of leaves. Two young leaves were sampled randomly from five week old maize plants. The leaves were cut and put separately in perforated bags before being transported to the laboratory in ice-cubes. The leaves were stored at 80 oC until ready for lyophilisation. The lyophiliser was set to a temperature of <60 oC and pulled to a good vacuum (<10 microns Hg) before loading the samples. The vacuum was set at 100 micron Hg and a condenser temperature of 60 oC.The samples were freeze-dried for 72 hours and stored in a sealed plastic bag at room temperature (25-26 oC) until ready for DNA extraction. DNA extraction. Genomic DNA was extracted using the Cetyl Trimethly Ammonium Bromide (CTAB) method described by Shaghai and Maroof (1984), and modified by Hoisington et al. (1998). The concentration of genomic DNA was determined on the basis of optical density readings. From each stock DNA sample, a 15µl aliquot diluted in 735µl of 1XTE buffer, was prepared, and its optical density (ODs) determined at 260 and 280 nm wavelengths on a spectrophotometer (Ultrospec 2000, Pharmacia) . Primers and PCR amplification. Fourteen SSR primers were selected from previous studies (Warburton et al., 2002) and from the Public Maize Database (http://www.agron.missouri.edu/ssr_probes/ssr.htm) based on their high polymorphism information content and chromosome location with at least 2 SSRs per chromosome (Table 1). The repeat units and bin locations were used to obtain a uniform coverage of the entire maize genome. PCR was performed in 20 µl reaction mixes consisting of 30 ng template DNA, 1.5 mM MgCl2, 0.8 mM dNTP mix, 0.5 µM SSR primers (forward and reverse), 0.125U Taq polymerase (Roche) and 1x PCR reaction buffer (10 mM Tris-HCl, 50 mM KCl, 1.5 mM MgCl2) in a 1.5 ml micro-centrifuge tube on ice. In a 20 µl PCR reaction volume, 18 µl of master mix was mixed with 2 µl of 30 ng DNA. The reaction mixture was vortexed gently and run in a GeneAmp cycler (GeneAmp PCR system 2700 from Applied Biosystems) with the following PCR programme; Initial denaturation at 95 oC for 5 minutes, followed by 30 cycles of 94 oC for 30 seconds, 56 oC for 45 seconds and 72 oC for 30 seconds. This was followed by one final extension cycle at 72 oC for 10 minutes, and an indefinite hold at 4 oC. The SSR amplification products were resolved on 2% agarose gel in 1X TAE buffer. Gels were run in a medium format horizontal gel system at 100V for 45 minutes and were photographed under UV light. SSR statistical analysis. Gel photographs were scored manually and repeated twice to limit errors in scoring. The bands were binary coded by 1 or 0 for their presence or absence for each genotype, respectively. Estimates of similarity among all lines were calculated from the matrices in the form of similarity units and expressed as Euclidean genetic distance (Hintze, 2001). To test the significance of morphological variation among the maize inbreed lines, an analysis of variance was performed. The means of each trait were subtracted from the actual data values and the result divided by the standard deviation to obtain standardised traits mean values. These were used to perform principal component and cluster analyses using NTSYSpc software Version 2.1 (Applied Biostatistics Inc). The Euclidean distance matrix was used to categorise the inbred lines based on morphological similarity. Cluster analysis was conducted with the unweighted pair group method based on arithmetic averages to generate a dendrogram using the unweighted pair group method with arithmetic average (UPGMA). RESULTS AND DISCUSSION The 14 SSR primer sets identified 2 alleles among the 10 maize inbred lines and the number of alleles scored for SSR loci ranged from 2 to 7. Analysis of morphological traits. The Morphological traits showed similarities in most of the traits (Fig. 2 a and b) except in slight variations in the traits which involved timing. This could have been due to environmental response differences, which the plants later could balance by the intrinsic adequacy of maize allelic variation. This has been known to effectively convert photoperiod response to day neutrality, although photoperiod inheritance and sensitivity, which are quantitative traits of maize are not well understood (Russel and Stuber, 1985). The other morphological traits generally differed at less significant levels, for example the tassel trait morphological differences (Fig. 3). This was so despite the fact that the quantitative traits differences were distinct at the final assessment. Hence, all these traits analyses can be useful in precipitating possible heterotic advantages during plant breeding programmes. Clustering of the inbred lines. The UPGMA clustering grouped the inbred lines into four groups (Fig. 4). The first group was mainly of the CIMMYT lines, the second had a CIMMYT line with one Kenya line, the third had the other Kenya line with two CIMMYT lines (CML208 and CML204) and the fourth group had the USA group which was like an out group. This seems to point out that most of the germplasm in Kenya have more relatives from the CIMMYT than from USA. Hence, USA germplasm can be useful for enriching the heterotic pools in Kenya. The need to enrich the Kenya maize. The Kenya maize hybrid needs to be developed using proved and genetically dissimilar inbred lines from other heterotic pools. This is because there seems to be advancement inbreeding, which could cause poor production of maize in the east and central Africa, which largely depend on seeds produced in Kenya. The Concentry analysis (Reynlolds et al., 1983) showed the Kenya inbred lines to be tending towards homology (Fig. 5). The exact tests. The exact tests for population differentiation (Raymond and Rousset, 1995) for the molecular data with 1000 dememorisation steps of 10 batches and 2000 permutations per batch had the Kenya inbred lines with an overall P = 0.0513. The combined probabilities or each pair-wise comparison is shown in Table 2. Genetic distances. Using the Nei's (1972/1978) Identities and Distances, the Kenyan population, and EM11-133 and CML 204 populations had the highest genetic distance of 1.2528, while the lowest was between CML 444 and CML 312 (0.1542). Dissimilarity between morphological traits. A 20 x 20 dissimilarity matrix was constructed using Rogers and Tanimoto. It showed a correlation of r = -0.1421 between the two matrices, and the Z from original data was 160.58540000. On the other hand, the average Z after 1000 permutations was 161.17180000. 984 out of the 1000 permuted data sets had Z-scores greater than or equal to the original Z-score(P =0.9840). The results are summarised in Table 3. Comparison of groups 1 and 2 in a 4 x 4 dissimilarity matrix constructed using Rogers and Tanimoto had an correlation r = -0.4207 in the two matrices, and a Z from original data of 3.67149700. The average Z after 1000 permutations was 3.75294800. Moreover, 1000 out of the 1000 permuted data sets had Z-scores greater than or equal to the original Z-score. (P = 1.0000). The results of all the other combination are shown in Table 4. Comparing the molecular and morphology. In comparing the molecular with the morphological data, a 30 x 30 dissimilarity matrix was constructed using Rogers and Tanimoto. It had a correlation of the two matrices with r =0.2323. The Z value from the original data was 172.09290000, while the average Z after 1000 permutations was 157.37750000. Out of 1000 permutated data sets 10 had Z-scores greater than or equal to the original Z-score, with P= 0.0110. For example, the dissimilarity between the molecular and morphological data had P= 0.0120. The Microsatellites (SSRs) have become useful molecular markers in maize genetic analysis because of their high level of polymorphism, abundance, uniform distribution, their ease in measuring diversity and allocating lines into heterotic groups and also in fingerprinting in genetic studies (Senior et al., 1998; (Jacob et al., 1991). Phenotype-genotype association analyses in a plant species have been carried out after the pioneering work of Thornsberry et al. (2001). Compared to most of the preceding studies of SSR diversity in maize, our study revealed 2.0 averages of alleles in the 14 loci studied, and similar allelic diversity in inbreeds. For example, Lu and Bernardo (2001) reported that in 40 maize inbreeds, an average of 4.9 alleles were obtained for 83 SSR loci, other 94 elite inbred lines averaged 5.0 alleles when 70 markers were used (Senior et al., 1998). Warburton et al. (2002) with 85 SSR loci found an average of 4.9 alleles per locus and Vaz Patto et al. (2004) obtained an average of 5.3 alleles per locus using 80 SSR loci. There was a high degree of average relatedness among the 10 inbred lines with the OSU 23i showing a separate genome variation and probable structure as compared to the relationship between the other Kenya and CIMMYT lines, of which some seemed to have an advanced approach towards inbreeding. The UPGMA cluster analyses dendrogram showed this distinctiveness of pedigree information. The minimum genetic distance from the study confirmed the ability of SSR markers in distinguishing closely related genomes (Smith et al., 1997). References
Copyright © 2009, African Crop Science Society The following images related to this document are available:Photo images[cs09013t1.jpg] [cs09013t4.jpg] [cs09013f3.jpg] [cs09013f5.jpg] [cs09013f1.jpg] [cs09013f4.jpg] [cs09013f2.jpg] [cs09013t3.jpg] [cs09013t2.jpg] |
| |||||||||
