 |
| About Bioline | All Journals | Testimonials | Membership | News |
|
||||||
|
||||||
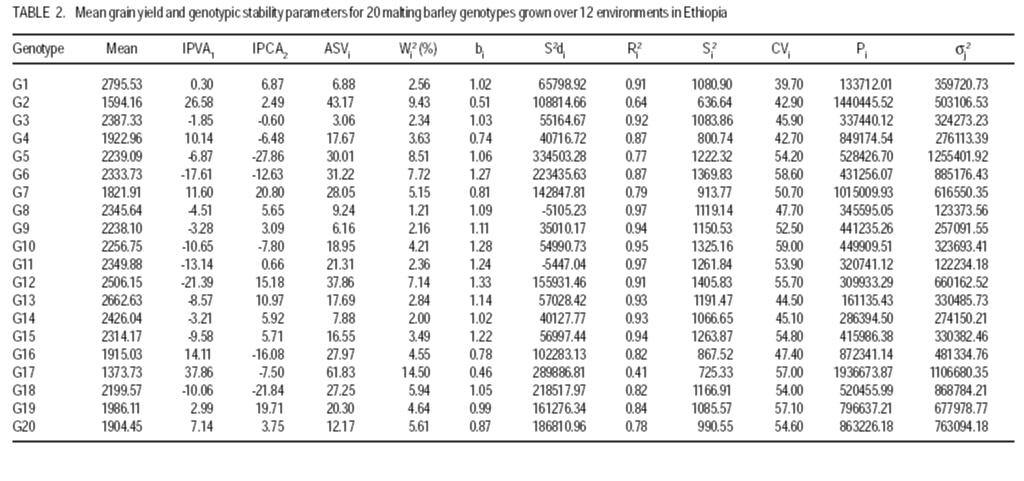
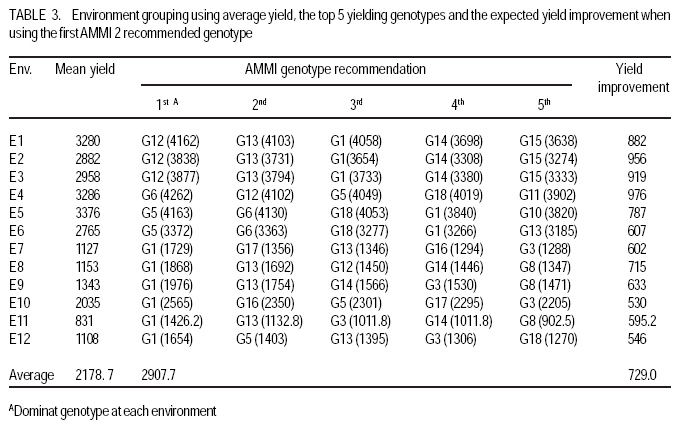
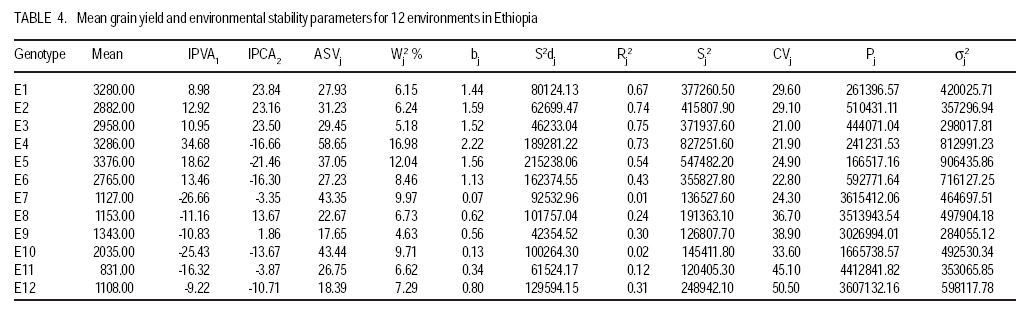
African Crop Science Journal, Vol. 17, No. 3, Sept. 2009, pp. 145-153 Analysis and correlation of stability parameters in malting barley Muluken Bantayehu Adet Agricultural Research Center, P. O. Box, 08, Bahirdar, Ethiopia (Received 21 January, 2009; accepted 15 August, 2009) Code Number: cs09014 ABSTRACT Barley (Hordeum dischon L. and Hordeum vulgare L.) is a multipurpose plant cultivated since ancient time for food, feed, medicinal purposes and malt of alcoholic beverages. Stability parameters are useful tools for identification of genotypes with specific and wide adaptations, and contrasting the role played by genotype, environment and G x E interaction in multilocational variety trials. Interaction principal component axis (IPCA) scores, Additive main effect and multiplicative interaction stability value (ASVi), Wricke`s ecovalence (Wi), regression coefficient, coefficient of variation (CVi), genotypic/environmental variance (Si2), stability variance (si2) and cultivar/environment superiority measure(Pi) were used to evaluate the yield performance and stability of twenty malting barley genotypes in twelve rain-fed environments during 2005-2007. Spearman rank correlation showed that bj, Ri2, Sj2, CVj, and IPCA1 of environments were positively correlated, indicating that any of these five parameters can be used as a good alternative for stability evaluation. These stability parameters were positively correlated with mean yield of environments. The mean of genotype yields were positively correlated with stability parameters of bi and Ri2 (P<0.01), but were negatively correlated with IPCA1, Wi2, Pi (P<0.01) and ASVi. Based on these parameters, genotypes G1 and G13 combined high and stable grain yield, whereas the highest yielding genotype G12 was not stable. Key Words: GxE interaction, Hordeum dischon, Hordeum vulgare, rank correlation RÉSUMÉ L'orge (Hordeum dischon L. et Hordeum vulgare L.) est une plante polyvalente cultivée depuis les temps anciens comme denrées alimentaires, fourrage, pour des raisons médicinales et comme malt pour la production des boissons alcoolisées. Les paramètres de stabilité constituent les moyens utiles dans l'identification des génotypes avec des adaptations spécifiques et larges qui contrastent avec le rôle joué par le génotype, environnement et l'interaction G x E en divers essais multilocaux. Le score de l'axe principal du composante interaction (IPCA), l'effet additif principal, la valeur de stabilité de l'interaction multiplicative (ASVi), l'ecovalence de Wricke (Wi), le coefficient de régression, le coefficient de variation (CVi), la variance génotypique/l'environnement (Si2), la variance de stabilité (Si2) ainsi que la supériorité cultivar/environnement (Pi) avaient été utilisés pour évaluer les performances de rendement et la stabilité des vingt génotypes d'orge brassicole dans douze environnements pluvieux au cours de la période de 2005-2007. La corrélation rangée de Spearman avait montré que bj, Ri2, Sj2, CVj et IPCA1 des environnements étaient positivement corrélés, indiquant que n'importe lequel de ces cinq paramètres peut servir comme une bonne alternative pour l'étude de stabilité. Ces paramètres de stabilité étaient positivement correlés avec le rendement moyen dans les différents environnements. Les rendements moyens de génotype était positivement corrélées avec les paramètres de stabilité de bi et Ri2 (p<0,01), mais étaient en corrélation négativement avec IPCA1, Wi2, Pi (P<0,01) et ASVi. Relativement à ces paramètres, la combinaison des génotypes G1 et G13 a générée un rendement en grain élevé et stable, cependant le génotype G12 ayant un rendement plus élevé n'était pas stable. Mots Clés: Interaction GxE, Hordeum dischon, Hordeum vulgare, corrélation rangée INTRODUCTION Barley (Hordeum dischon L. and Hordeum vulgare L.) has a long history of use as human and animal food, health benefits and malting and brewing in many countries around the world (Malcolmson, et al., 2005). The price of malting barley have risen to a historic level ($398 per tonne) attributed to tight global supply (Go Malting, 2007). Many countries produce malt barley but Australia, USA and Canada contribute the largest share of the world production with 3.0, 2.4 and 1.7 million tonnes respectively. European Union countries contribute 57 % to the world production (CCGH, 2001). In North Western Ethiopia, research efforts are undertaken to encourage cultivation of barley for malt. Breeding efforts are underway in the high and mid-altitude environments, but genotype by environment interaction (GxE) is limiting progress in yield improvement under rainfed and unpredictable environments. Changes in rank of cultivar through environments indicate genotype by environment (GxE) interaction and it reduces the correlation between the genotype and the phenotype, hindering evaluation of the genetic potential of the cultivar (Kang and Gorman, 1989). If relative performances of the entries grown in different environments are highly different, then GxE becomes a major challenge to crop breeding programmes (Zobel and Talbert 1984). Developments of multiline varieties, clustering of environments into homogenous groups and/or selecting genotypes that perform well across many environments are the solution to alleviate the problem (Mckeand et al., 1990). Some genotypes are adapted to a broad range of environmental conditions, while others have limited adaptation. Performance of genotypes across variable environments can be assessed using different stability parameters. The main problem with univariate and nonparametric stability statistics is that they do not provide an accurate picture of the complete response pattern, because of the multivariate nature of the genotype`s response to varying environments (Lin et al., 1986). Therefore, using multivariate statistics, genotypes with similar responses can be clustered and, thus, the data can be analysed and summarised. The additive main effect and multiplicative interaction (AMMI) model provides a multivariate analytical parameter for interpreting GxE interactions (Crossa et al., 1990). Purchase (1997) developed the AMMI stability value based on the stability model`s IPCA1 and IPCA2 scores for each genotype (ASVi) and each environment (ASVj). The objectives of this study were to (i) identify stable genotype in grain yield, (ii) estimate the contribution of each genotype and environment to total GxE interaction, (iii) determine the genotypic selectivity of each test environment, and (iv) study correlation among the stability parameters. MATERIALS AND METHODSField study. The field experiment was carried out with 20 advanced malting barley genotypes; EH1609-F5.B3-10 (G1), 37622 (G2), 118173 (G3), Bekoji sel-8 (G4), 118007 (G5), EH1510-F6.10H.3 (G6), 108932 (G7), 118173 (G8), 118146 (G9), EH1746-F6.B2-109 (G10), EH1606-F5.B2-7 (G11), EH1601-F5.B2-2 (G12), EH1603-F5.B1-4 (G13), EH1612-F5.B3.13 (G14), HB1533-sels (G15), and Miscal-2 (G16), Miscal-1 (G17), HB-242-sels (G18), along with HB-52 (G19) HB-120 (G20) was used as a standard check. The experiment was conducted under rainfed conditions in four locations, representating different barley growing agro-ecologies during three growing seasons (2004-05, 2005-06, 2006-07). At each site, the genotypes were planted in a randomised block design in three replicates. Sowing was done by hand in plots of 3 m2 with six rows measuring 2.5 m and 0.2 m within row spacing. Fertiliser application was 41 kg N ha-1 and 46 kg P2O5 ha-1 at planting. The four middle rows with an area of 2 m2 were harvested. Grain yield obtained was computed per hectare. Stability analysis. The method of Eberhart and Russell (1966) was used to calculate the regression coefficient (bi), deviation from regression (Sdi2) and coefficient of determination (Ri2). It was calculated by regressing mean grain yield of individual genotypes/environments on environmental/genotypic index. Shukula stability variance (si2) and genotypic/environmental variance (Si2) were also computed, where genotypes with minimum values are considered stable. Stability was also measured by combining the mean yield and coefficient of variation (CVi) (Francis and Kannenberg`s, 1978). Ecovalence (Wi2) suggested by Wricke (1962) and cultivar/environmental superiority measure were computed to further describe stability. The AMMI stability value (ASVi) (Purchase 1997) based on the AMMI model`s IPCA1 and IPCA2 scores for each genotype was also computed. ASVi is in effect the distance from the coordinate point to the origin in a two dimensional scattergram of IPCA1 scores against IPCA2 scores. The larger the IPCA scores, either negative or positive, the more specifically adapted a genotype is to a certain environments; the smaller the IPCA scores, the more stable the genotype is over all environments studied. RESULTSAMMI analysis of variance. There were significant effects for genotype (G), environment (E), and GxE interaction (Table 1). Overall, 69 % of the total sum squares (SS) was attributed to environment effects; only 8.6% genotype and 14.3 % were attributed to genotypes and GxE interaction effects, respectively. Results from analysis of multiplicative effects also showed that the first interaction principal component axis (IPCA1) captured 35.80% of the interaction SS in 13.9% of the interaction degree of freedom (d.f.). Similarly, the IPCA2, IPCA3, and IPCA4 explained a further 22.08, 11.61, and 9.28% of the GxE interaction SS, respectively. In total, the AMMI2 model (G+E+IPCA1 and IPCA2) contained 94 % of the total SS, indicating that the AMMI model fits the data well, and validates the use of AMMI2. Stability analysis for genotypes. The interaction principal component axis (IPCA) scores of a genotype provide indicators of the stability of a genotype across environments (Purchase, 1997). The lowest IPCA1 was observed for genotype G1, followed by G3 and G19, and IPCA2 was lowest for genotypes G3, G11, and G2 (Table 2). According to IPCA1, G1 was the most stable genotype with mean yield (2795.53 kg ha-1) higher than the grand mean (2178.65 kg ha-1). The highest IPCA1 was given by G17, followed by G2 and G12 and the highest IPCA2 was scored by G5, followed by G18 and G7, which had mean yields close to the grand mean. However, ASVi ranked genotype G3 with the lowest ASVi, as the most stable but it had average yield performance. According to ASVi, G12 was unstable genotype and had high yield (2506.15 kg ha-1). G2 was the most unstable genotype and provided the lowest grain yield with limited adaptation to testing environments. Using Wricke`s (Wi2) stability parameter, genotypes G8, G14 and G9 with the lowest ecovalences were considered to be stable as they contributed 1.2, 2.0 and 2.2% to the interaction sum of squares, respectively; whereas G17 followed by G2 with the highest Wi2 were unstable and made the highest contributions to GxE interaction. The regression coefficients bi for the genotypes ranked from 0.46 to 1.33. Genotypes G1, G3, G5, G19 and G8 with coefficient of regression bi values equal to 1.0 were the most stable. The genotypes with the lowest bi; G17, G2, G4, G16, G7 and G20 were more adapted to marginal environments whereas genotypes G12, G110, G6, G11 and G13 were input sensitive and adapted to high potential environments. Genotypes G8, G11, G14, and G4 were relatively stable as they had small deviation from regression values (S2di). The predictability of genotypes for the yield ranged from 0.41 for G17, to 0.97 for G8 and G11. Genotypes G2, G 17 and G4 had high biological stability unlike genotypes G12, G6 and G10 with the highest Si2 (Table 2). Based on shukula stability variance (si2), G11 and G8 were widely adapted genotype. The undesirable genotypes identified were G5 and G17 (Table 2). Cultivar superiority measure depicted G1, G13 and G14 as stable and G17 and G2 with limited adaptation in the tested environments. Parameter CVi, genotypes G1, G4 and G2 were stable. G2 and G4 had the lowest CVi and low yield, whereas G11 and G12 with the highest CVi values had high yield performances. Stability analysis for environments. According to environmental IPCA1 scores, environments E1, E3, E9 and E12 were more stable and had lower GXE interaction, but E12 and E9 had low yield performance, whereas the highest IPCA1 scores belonged to E4, E10 and E7. According to IPCA1, environments E4 were ideal environments for selecting genotypes with specific adaptation to high input conditions. In E4, genotypes G6, G12, G5, G18 and G11 ranked at the top five superior genotypes (Table 3). The ASVj values for the 12 environments ranged from 17.65 to 58.65 (Table 4). By using this method, environment E9 followed by E12 and E6 had the highest stability with the least combination to GxE interaction, whereas environment E4 with the highest ASVj value had the highest genotypic response. Test of environments based on coefficient of variation CVj showed E3, E4, and E6 with the lowest CVj as having the least variability for genotypic responses, unlike E9, E11 and E12 (Table 4). Environmental variance (Sj2) detects deviations from the mean. An environment with minimum variance across genotypes was considered to be stable. Environments E11, E9, E7 and E10 were in the lowest variance, whereas E4, E5, and E2 were in the highest variance group (Table 4). In Wricke ecovalence (Wj2), environments with the highest values, i.e. the most interactive environments, were E4, E5, E7 and E10, being responsible for 16.98, 12.04, 9.97 and 9.71% of the total interaction sum of squares (Table 4), respectively. Whereas E9 followed by E3, E1 and E2 with 4.63, 5.18, 6.15 and 6.24 %, respectively, had the lowest contribution to GxE interaction. Environmental superiority measure depicted E5, E4 and E1 as stable and E12, E7 and E11 with small Pj values. According to Shukula stability variance, environments; E9, E3 and E11 discriminated less among genotypes. Test environments E4 exhibited the highest value for genotypic selectivity, followed by E2 and E5 (Table 4). E7, E9, E10 and E11 had lower regression coefficients and the remaining environments had relatively the lowest regression coefficient. Correlations among stability parameters. The ranks of 20 genotypes and 12 environments after applying the methods of stability analysis were used to assess the relationships among stability parameters. Spearman`s rank correlation coefficient between mean yield and stability parameters are presented in Table 5. The means of environmental yield were negatively correlated with the environmental stability parameters IPCA2, CVj, and Pj (P<0.01) and bj (P<0.05). Parameter Pj showed negative correlations with IPCA1, bj, Rj2 and Sj2 (P<0.01). Parameters bj, Ri2, Sj2, and IPCA1 were positively correlated (P<0.01). These four parameters were positively correlated with mean yield of environments. The mean of genotype yields were positively correlated with stability parameters of bi and Ri2 (P<0.01) but were negatively correlated with IPCA1, Wi2, Pi (P<0.01) and ASVi (p<0.05). The ASVi had a significant and positive correlation with Wi2, S2di, Pi and si2, whereas its correlation with IPCA1 and IPCA2 was not significant (P>0.05). The bi was strongly and negatively correlated with IPCA1 and Pi but significant (p<0.01) positive correlation was observed with Ri2 and Si2 (Table 5). DISCUSSION Stability analysis for genotypes used in this study allowed identification of promising varieties with wide and specific adaptations. Alternatively, stability parameters based on environments allowed the grouping of test environments and the determination of those contributing more to GxE interaction. The correlation matrix showed that most of them are highly and significantly intercorrrelated (P<0.01), indicating that one can be used as a good alternative for the other in a GxE interaction evaluation. According to stability parameters, the sites can be classified into three distinct groups. The first group of E1, E2, E4, and E5 are the sites with good yield performance but with a high contribution to GxE interaction. The second groups consists of environments E8, E9, E11 and E12 with poor yielding capacity and lowest contribution to GxE interaction. These are designated as stable environments. A good test environment for screening genotypes must allow sufficient efficiency of selection through the expression of good genotypes. Thus, environments with high bj values exhibit high genotypic selectivity and may be considered to be good test sites for detecting and selecting good genotypes (Isik and Kleinschmit, 2005). From the second group, environment E4 followed by E2, E5, and E1 exhibit the highest bi value for genotypic selectivity (Table 4). Environments E6 and E12 were intermediate and can be used to select simultaneously for average yield performance and average stability. In crop improvement programmes, genotypes are tested in different seasons and locations to determine performance and adaptation of genotypes. Thus, evaluation based on several seasons and locations is the best strategy. Farmers in developing countries, who use no or limited inputs, or under unpredicted environments will prefer yield stability than increment. In these cases, genotypes with good performances and stability should be the most preferred. Genotypes with good stability are most targeted for environmental conditions which are highly unpredictable. This ultimate goal can be achieved using the screening and shuttle breeding of segreganting populations in contrasting environments, followed by the multi-locational evaluation of performance of varieties. Stability analysis can help to characterise the response of varieties to changing environments and to determine the best locations representative of the environmental diversity (Mohammed et al., 2008). Most stability parameters were closely similar in sorting out the relative stability of the genotypes. According to stability parameters, genotype G1 and G13 with a good combination of yield and stability can be recommended for release, whereas genotypes G12 and is unstable but had high yield performance. This experiment also demonstrated the advantages of adding the AMMI model for the analysis of the GxE interaction for grain yield in malting barley. Simultaneous assessment of IPCA scores for genotypes and environments facilitates the interpretation and identification of specific interactions among them. For example, genotypes with a positive IPCA would be particularly adapted to environments with a positive IPCA but poorly adapted to environments with a negative IPCA (Gauch, 1996). G1 with a positive IPCA showed high adaptation to E1, E2, E3, E4, E5 and E6 where it is ranked as a dominant genotype (Table 2). G13 with a negative IPCA was highly adapted to environments E7, E8, E9, E10, and E11and E12 with negative IPCA. According to the AMMI2 genotype recommendation, genotypes G1 and G12 share about 80% of the environments and were identified as dominant genotypes in 3 environments for G12 (E1, E2 and E3) and 6 environments for G1 (E7, E8, E9, E10, E11 and E12). These two genotypes appeared in the top five ranks in 12 of 22 environments. In conclusion, several stability statistics that have been used in this study quantified stability of genotypes with respect to either yield level, stability, or both. Therefore, both yield and its stability should be considered simultaneously to exploit the useful effect of GxE interaction and to make selection of the genotypes more precise. REFERENCES
Copyright © 2009, African Crop Science Society The following images related to this document are available:Photo images[cs09014t4.jpg] [cs09014t3.jpg] [cs09014t2.jpg] [cs09014t5.jpg] [cs09014t1.jpg] |
| |||||||||
