 |
| About Bioline | All Journals | Testimonials | Membership | News |
|
||||||
|
||||||
African Crop Science Journal, Vol. 17, No. 4, pp. 199-212 Effect of phosphorus nutrition on growth of potato genotypes with contrasting phosphorus efficiency Tesfaye Balemi Ambo University, Faculty of Agriculture, Department of Plant Science, P. O. Box, 19, Ambo, West Shoa Zone, Ethiopia (Received 23 August, 2009; accepted 29 November, 2009) Code Number: cs09019 Abstract Potato (Solanum tuberosum L.) has high phosphorus requirement for optimum growth and yield. Thus, under P deficiency, growth and yield are considerably reduced. An experiment was conducted in a controlled growth chamber on the effect of P supply on morphological and physiological plant parameters of three potato genotypes having contrasting P efficiency. The genotypes were CGN 17903, CIP 384321.3 and CGN 18233. They were grown under two P levels [100 mg P kg-1 soil (low P) and 700 mg P kg-1 of soil (high P)]. Treatments were arranged in a completely randomised block designs with six replications. Low P supply reduced shoot dry matter yield, relative growth rate, leaf number, whole plant relative leaf expansion rate, total leaf area per plant, plant height and net assimilation rate of P-inefficient genotype, more than that of the P-efficient genotypes. However, low P supply did not affect net photosynthetic rate per unit leaf area, leaf dark respiration rate, chlorophyll fluorescence rate and electron transport rate of both P-efficient and inefficient genotypes. P-efficient genotype CGN 17903 allocated more dry matter yield to the leaf which might have enabled higher light harvesting, hence contributing to high biomass accumulation of this genotype. Key Words: Chlorophyll flourescence, photosynthetic rate, Solanum tuberosum Résumé La pomme de terre (Solanum tuberosum L.) a une exigence élevée en engrais phosphore pour une croissance et un rendement optimal. Ainsi, en cas d'une carence en P, la croissance et le rendement sont considérablement réduites. Une expériementation avait été menée dans une chamber de croissance contrôlée afin d'étudier l'effet du supplément en P sur les paramètres morphologiques et physiologiques des trois génotypes de pommes de terre ayant des rendements contrastés pour P. Les génotypes étaient CGN 17903, CIP 384321,3 et CGN 18233. Elles ont été cultivés en deux niveaux de P [100 mg de P kg-1 de sol (faible P) et 700 mg P kg-1 de sol (élevé P)]. Les traitements avaient été appliqués dans les dispositifs en bloc complétement randomisés avec six répétitions. Le faible apport en P réduisait le rendement en matière sèche de pousses, taux de croissance relative, nombre de feuilles, taux d'extension relative des feuilles de la plante entière, surface totale de feuilles par plante, hauteur de plante et le taux d'assimilation net du génotypes non performants P; et plus de celle là du génotype performant. Toutefois, le faible apport en P n'avait pas affecté le taux net de photosynthèse par unité de surface de feuille, le taux de respiration de feuille en phase obscure, taux de fluorescence de chlorophylle et le taux de transport des électrons pour le génotypes performants P, ainsi que ceux non performants. Le génotype P performant: CGN 17903, avait fourni à la feuille un rendement élévé en matière sèche qui pourrait avoir activé plus de lumière, contribuant ainsi à une accumulation élevée de biomasse pour ce génotype. Mots Clés: Chlorophylle flourescente, taux de photosynthèse, Solanum tuberosum Introduction Phosphorus is the second most important macro-nutrient limiting plant growth after nitrogen in most soils. It is a plant nutrient that intervenes in cellular energy transfer, photosynthesis, and respiration and is a component of nucleic acid nucleotides, phospholipids and phosphorylated sugars (Marschner, 1996; Plaxton and Carswell, 1999). Unfortunately, P is one of the least accessible nutrients in most soil especially under tropical conditions where low P availability is a big challenge to agricultural production (Kochian et al., 2004). Potato has high P requirement for optimum growth and yield; thus, when grown on P deficient soils, considerable yield losses are apparent (Alvarez-Sanchez et al., 1999; Dechassa et al., 2003). Reduction in plant biomass production or growth rate under P deficient conditions may be ascribed to either limited amount of absorbed photosynthetically active radiation (PAR) (Colomb et al., 1995) or to a less efficient conversion of the intercepted radiation (Plenet et al., 2000). Several reports indicate that light interception by crops is the most important factor affecting biomass accumulation under varying P supply (Lynch et al., 1991; Colomb et al., 1995; Rodriguez et al., 1998; Plenet et al., 2000). Plants grown under low P level develop lower total leaf area, which adversely affects light interception and, hence plant growth (Lynch et al., 1991; Plenet et al., 2000). The reduced total leaf area could be due to both reduced number of leaves and smaller individual leaf size (Lynch et al., 1991). A decrease in number of leaves in P-deficient plants can be ascribed to reduced leaf initiation and activity of the shoot meristems (Chiera et al., 2002). On the other hand, the reduced individual leaf size can be due to reduced cell division rate (Assuero et al., 2004) or reduced epidermal cell expansion (Radin and Eidenbock, 1984), which ultimately affect leaf expansion rate. Lynch et al. (1991) and Colomb et al. (2000) observed significantly lower final leave number in non-P treated plants than in P treated ones, which ultimately affected total plant leaf area. There is evidence showing a decrease in photosynthesis in plant deprived of phosphorus (Brooks 1986; Fredeen et al., 1989; Passarinho et al., 2000; Fujita et al., 2004; Yong-fu, 2006). The decrease in photosynthesis rate per unit leaf area in turn affects the Net Assimilation Rate (NAR) and, hence, plant growth rate. However, some reports still revealed that photosynthetic rate per unit leaf area was not affected by P deficiency (Foyer and Spencer, 1986; Dieter and Helios, 1990). The variable responses might be due to severity of P deficiency and the capability of the plant/genotype to cope with low internal P (Kondracka and Rychter, 1997). Thus, genotypes differ significantly in ability to tolerate P stress and the extent to which their physiological and morphological growth parameters are affected by P deficiency (Fujita et al., 2004; Yong-fu, 2006). This study was aimed at evaluation of the relative tolerance of P stress effects (both change in plant morphology and physiology) by P-efficient and P-inefficient potato genotypes. Materials and methodsPlant material and growth conditions. A pot experiment was conducted in controlled growth chamber using soil. Three potato genotypes differing in P-efficiency, CGN 17903 and CIP 384321.3 (P-efficient) and CGN 18233 (P-inefficient), were used in the study. Genotype CIP 384321.3 was a pipeline variety obtained from Holeta Agricultural Research Center, Ethiopia. Genotypes CGN 17903 and CGN 18233 were obtained from the Center for the Genetic Resource in the Netherlands. Eight days old in-vitro plantlets were transplanted into initially unfertilised black peat with initial pH of 4 for acclimatisation. The peat was sieved through 5 mm mesh and pH was adjusted to 6.7 by applying 7 g CaCO3 per liter of peat. Each plant received 3 ml of nutrient solution containing in mg L-1: 50 N, 50 K, 25 P, and 20 Mg applied in the form of NH4NO3, K2SO4, KH2PO4 and MgSO4.7H2O, respectively. Micronutrients were applied in the form of a compound fertiliser (Flory ®10) consisting of 10% MgO, 0.5% B, 0.02% Co, 2% Cu, 3.5% Fe, 0.5% Mn, 0.8% Mo and 0.3% Zn, at the rate of 405 mg L-1. After 10 days of growth in peat medium under humidified condition, the seedlings were transplanted to 340 ml plastic pots filled with soil treated with two P levels, 100 mg P kg-1 soil (low P) and 700 mg P kg-1 of soil (high P) as Ca(H2PO4)2. A subsoil of Luvisol derived from loess, was used for the experiment in order to be able to see the effect of low P treatment. The soil was air-dried and sieved through 2 mm sieve to homogenise and separate roots from the soil. To adjust the pH to 6.3, CaCO3 was added at 3200 mg kg-1 of soil. The soil was compacted to the bulk density of 1.38 g cm-3. Nitrogen, potassium, and magnesium in the form of NH4NO3, K2SO4 and MgSO4 were initially applied uniformly to all the treatments at the rates in mg kg-1 soil of: 150 N, 150 K, and 40 Mg, respectively. Additionally, 50 mg N and 30 mg K plant-1 were given 10 days after transplanting (DAT). The pots were watered to moisture content of 23% throughout the growing period. The plants were grown with a day/night temperature of, 22oC/16°C, relative humidity of 70%/80% and an average light intensity of 250 µmol m-2 s-1 (± 26.7) supplied for 12 hr day-1. Determination of plant parameters. Plant dry weight at transplanting was derived from seedling shoot length considering dry matter per cm shoot length of another 6 harvested seedlings of similar size. Likewise, plant leaf area at transplanting was derived from leaf number, considering leaf area per leaf number of another 6 harvested seedlings of similar size. At harvest (32 DAT) shoots and roots were separated. The shoot was further separated into stem (petiole included) and leaf blade, and dry weight of each part was recorded after oven-drying the samples at 65°C for 48 hours. Fifty milligrammes of ground plant samples were ashed overnight at a temperature of 480 oC, and P concentration was determined by ammonium-vanadate-molybdate method (Gericke and Kurmies, 1952). Both leaf area and root length were determined using scanner with Win Rhizo V3.9 software (Regent Instruments, Quebec, Canada). Other leaf parameters, namely, relative whole leaf expansion rate, leaf weight ratio, leaf area ratio and specific leaf area, were calculated as described under equations 2, 3, 4 and 5, respectively.
where RGR = the relative plant growth rate (g g-1 day-1), PDW = plant dry weight (g), and t is time. Subscripts 0 and 1 refer to the transplanting and final harvest (days), respectively.
where RLER = the relative whole leaf expansion rate (cm-2 cm-2 day-1), LA = leaf area (cm2 plant-1) and t is time. Subscripts 0 and 1 refer to the transplanting and final harvest (days), respectively. Leaf weight ratio (LWR; g g-1) was computed as:
where LDW = leaf dry weight (g), and plant dry weight (g). Leaf area ratio (LAR; m 2 g-1) was computed as:
where LA = total leaf area (m2) Specific leaf area (SLA; m2 g-1) was computed as:
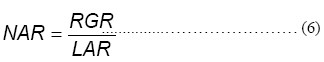
where LA = total leaf area (m2) and LDW = leaf dry weight (g). Net assimilation rate (NAR; g m-2 day-1) was computed as follows:
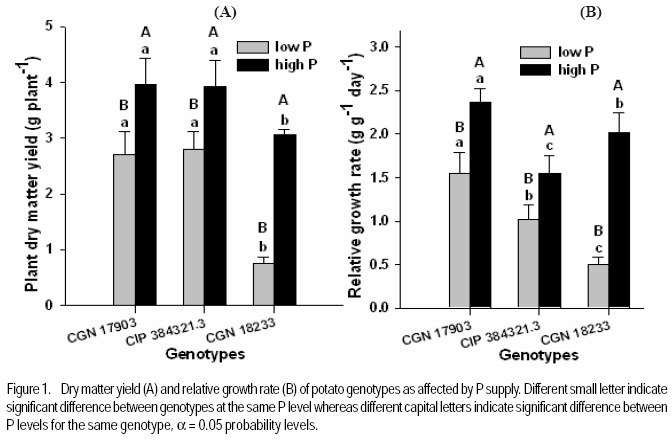
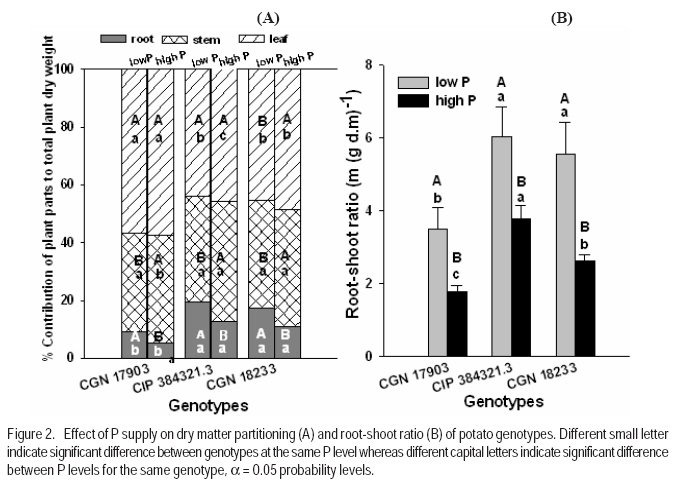
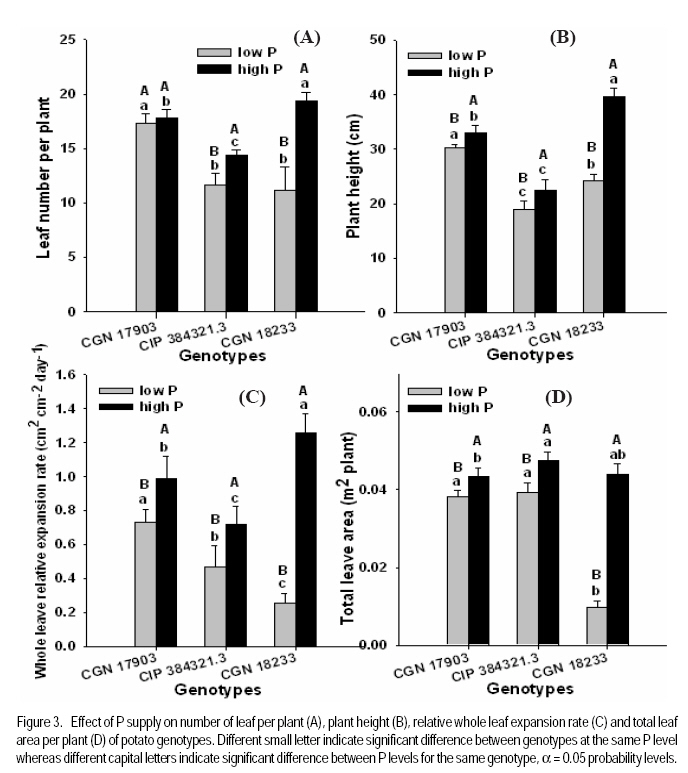
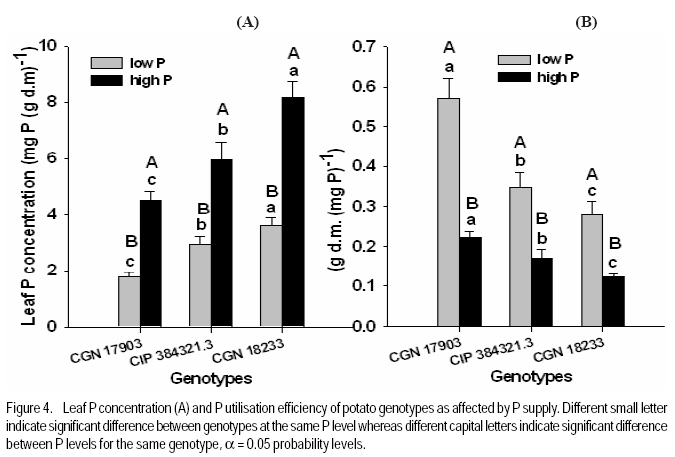
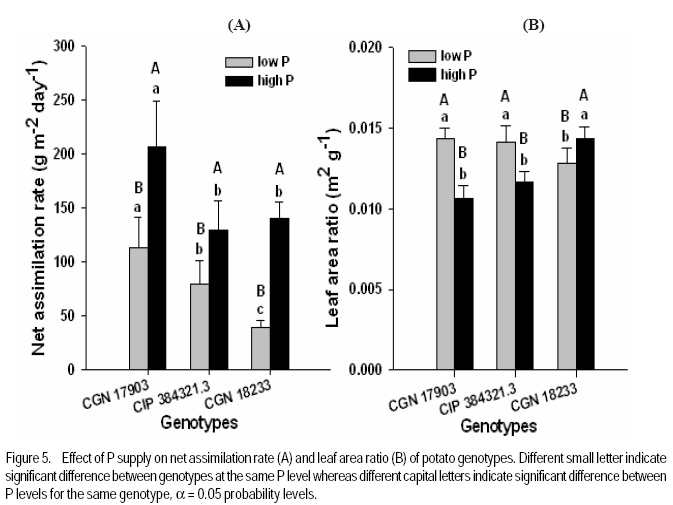
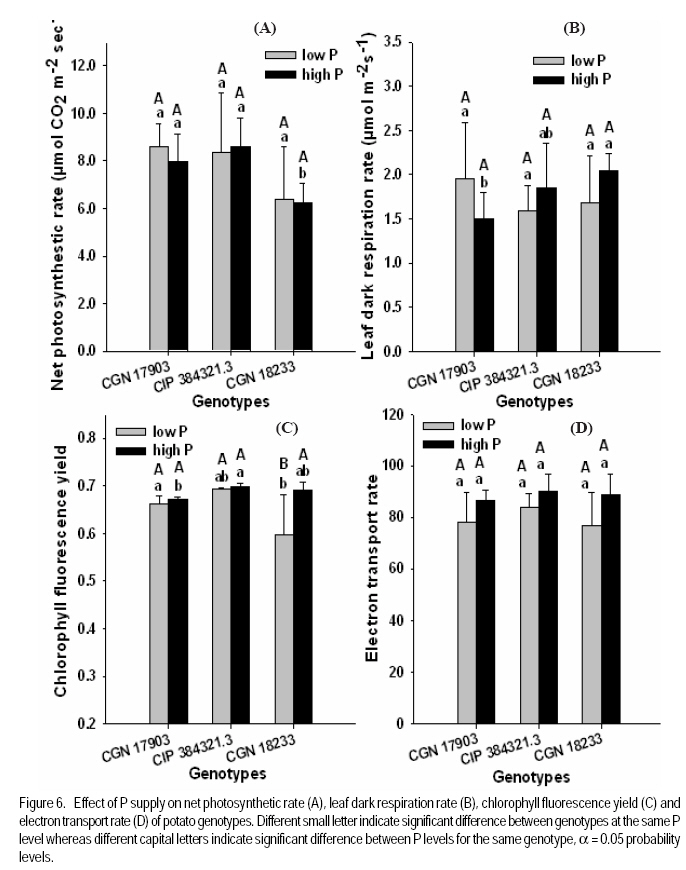
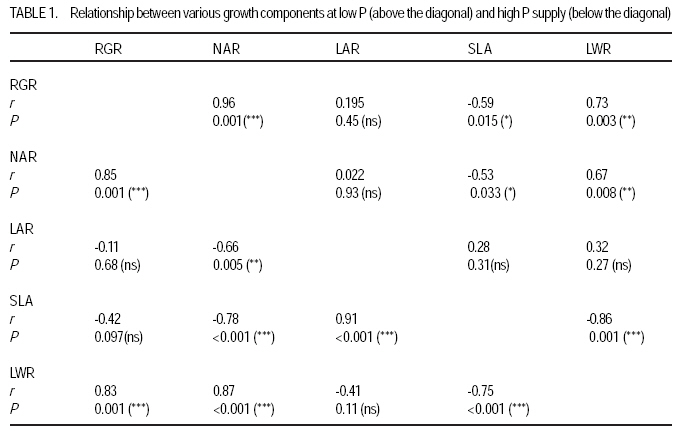
where RGR = relative growth rate (g g-1), and LAR = leaf area ratio (m 2 g-1). Gas exchange and chlorophyll fluorescence measurement. Photosynthetic rate and leaf respiration rate were measured at 26 DAT for the youngest fully expanded leaf using the portable photosynthesis system (LI-6400, Inc. Lincoln, Nebraska, USA). Photosynthetic rate was measured at a growth chamber light intensity of 250 µmol photons m2 s-1, external CO2 concentration of 400 µmol mol-1 and average leaf temperature of 28.4 °C. Leaf respiration rate was measured in the darkness. The chlorophyll fluorescence parameters were measured using MINI-PAM for light adapted leaves. Experimental design and data analysis. The treatments were arranged in a randomised complete block design with 6 replications. Data were analysed using the PROC GLM procedure of SAS (SAS Institute INC., Cary, USA). Treatment means were compared according to Tukey test and for all analysis a significance level P< 0.05 was adopted. Results Effect of P supply on plant growth and transpiration efficiency. Plant dry matter yield (PDMY) was significantly enhanced by P application for all genotypes (Fig. 1A). Yield reduction due to P deficiency was, however, much more pronounced with the P-inefficient genotype CGN 18233 (75%) than with the P-efficient genotypes CGN 17903 and CIP 384321.3 (30%). Ranking of genotypes in terms of PDMY was similar at both P levels. At both low and high P supply, PDMY was signigicantly higher for the P-efficient genotypes CGN 17903 and CIP 384321.3 than for the P-inefficient genotype CGN 18233. Due to variability among genotypes in the initial size of seedlings affecting the final yield, relative growth rate (RGR) was calculated and used as additional and more reliable parameter for ranking the genotypes for P-efficiency. Thus, ranking of the genotypes based on RGR and PDMY followed a different pattern at both high and low P levels. Similar to PDMY, RGR was significantly higher at high P than at low P for all genotypes (Fig 1B). Low P supply reduced RGR of the P-inefficient genotype CGN 18233 by 75% and that of the P-efficient genotypes CGN 17903 and CIP 384321.3 by 35% compared with their respective RGR at high P supply (Fig. 1B). The pattern of genotypic ranking at low and high P supply was different, indicating the presence of genotype*P level interaction. At low P level, the P-efficient genotype CGN 17903 had significantly higher RGR compared with the other two genotypes. The P-inefficient genotype CGN 18233 showed the lowest RGR compared with both of the P-efficient genotypes at similar P level. Thus, the RGR of the genotypes at low P supply was in the order of CGN 17903 > CIP 384321.3 > CGN 18233. At high P supply, the P-efficient genotype CGN 17903 still showed the highest RGR whereas the other P-efficient genotype CIP 384321.3 showed the lowest RGR. At a similar P level, the P-inefficient genotype CGN 18233 was, however, intermediate in terms of RGR. Thus, the RGR of the genotypes at high P supply was in the order of CGN 17903 > CGN 18233 > CIP 384321.3. Dry matter partitioning to different plant parts was significantly influenced both by P levels and genotypes (Fig. 2A). Most especially, dry matter allocation to the root was enhanced under low P more than under high P for all genotypes. On the other hand, dry matter allocation to the stem was slightly enhanced by P application for all genotypes. However, dry matter allocation to the leave did not differ markedly between low and high P supply (Fig. 2A). Genotype CGN 17903 partitioned more dry matter (57%) to the leaves compared with genotypes CIP 384321.3 and CGN 18233 (44.5%) at low P supply (Fig. 2A). In contrast, the latter two genotypes allocated more dry matter proportion to the root (17%/20%) compared with genotype CGN 17903 (9%) at low P supply. At both P levels, genotype CGN 17903 showed a tendency of lower dry matter allocation to the stem compared to the other two genotypes. Root-shoot ratio of the genotypes was generally two-fold higher at low P than at high P supply (Fig. 2B). At both P levels, root-shoot ratio was higher with the P-efficient genotype CIP 384321.3 and P-inefficient genotype CGN 18233 compared with the P-efficient genotype CGN 17903. Unlike shoot growth, root growth was not affected by P deficiency for all genotypes and at both P levels, genotype CGN 17903 showed shorter root length than the other two genotypes (data not shown). Low P supply reduced the number of leaves of the P-inefficient genotype CGN 18233 by 40% and that of genotype CIP 384321.3 by 20%. However, it did not affect number of leaves of genotype CGN 17903 compared with their respective high P controls (Fig. 3A). For all genotypes, plant height was significantly higher at high P than at low P supply (Fig. 3B). Low P supply reduced plant height by 40% for the P-inefficient genotype CGN 18233 and by 10% and 20% for the P-efficient genotypes CGN 17903 and CIP 384321.3, respectively compared with their respective high P controls. Relative whole leaf expansion rate (RLER) significantly increased at high P compared with low P supply with both P-efficient and inefficient genotypes (Fig 3C). However, ranking of genotypes followed a different pattern at low and high P supply. At low P level, the P-efficient genotype CGN 17903 and P-inefficient genotype CGN 18233 had the highest and lowest RLER, respectively. On the other hand, at high P supply, the P-inefficient genotypes CGN 18233 and P-efficient genotype CIP 384321.3 had the highest and lowest RLER, respectively. Low P supply reduced RLER of P-efficient and P-inefficient genotypes by 29 and 80%, respectively compared to their respective high P controls. Total leave area differed between P-efficient and inefficient genotypes at low P supply (Fig. 3D). At low P level, the P-efficient genotypes CIP 384321.3 and CGN 17903 had significantly higher total leaf area than the P-inefficient genotype CGN 18233. However, at high P supply the P-inefficient genotype CGN 18233 also had comparable leave area to the P-efficient genotypes (CIP 384321.3 and CGN 17903). Low P supply on average reduced total leaf area of the P-efficient and P-inefficient genotypes by 20 and 80%, respectively compared to their respective high P controls. Transpiration efficiency of the genotypes was significantly affected by P supply. For P-efficient genotypes (CIP 384321.3 and CGN 17903), transpiration efficiency was significantly higher at low P than at high P supply; whereas for the P-inefficient genotype, transpiration efficiency did not differ between low and high P supply. At low P supply, ranking of the genotypes for transpiration efficiency was in the order of CIP 384321.3 > CGN 17903 > CGN 18233 (data not shown). Effect of P supply on P concentration and P utilisation efficiency. Leaf P concentration at high P was on average about two-fold higher than at low P supply (Fig. 4A). The ranking of genotypes at low and high P showed more or less similar trend. At low P level, leaf P concentration was significantly higher with P-efficient genotypes CIP 384321.3 and P-inefficient genotype CGN 18233 compared with the P-efficient genotype CGN 17903. However, at high P supply all the three genotypes were significantly different with genotype CGN 18233 and CGN 17903 showing higher and lower leaf P concentration, respectively, compared with genotype CIP 384321.3. Phosphorus utilisation efficiency at both low and high P supply was significantly higher with CGN 17903, than with the other two genotypes (Fig. 4B). Effect of P supply on components of relative growth rate. The NAR, the rate of increase in plant dry weight per unit leaf area and unit time were on average two-fold higher at high P than at low P supply with all genotypes (Fig. 5A). At low P supply, ranking of the genotypes was in the order of CGN 17903> CIP 384321.3> CGN 18233. At high P supply, the P-efficient genotype CGN 17903 had higher NAR compared to the other two genotypes. The P-efficient genotypes CGN 17903 and CIP 384321.3 showed a tendency of higher leaf area ratio (LAR, the leave area per unit of plant dry weight) at low P supply (Fig. 5B). At high P supply, LAR was higher for the P-inefficient genotype CGN 18233. Ranking of the genotypes for LAR at high and low P supply followed different pattern. The LAR of the P-efficient genotypes at low P supply was higher than their corresponding LAR at high P supply, while it was the reverse for the P-inefficient genotype. Specific leaf area (SLA), which is leaf area per unit leaf dry weight, is an indication of the relative thickness of the leaves (a higher value suggesting thinner leaves). With P-efficient genotypes the SLA was significantly higher at low P supply compared with the SLA at high P supply. This was, however, not consistent with the results observed with the nutrient solution experiment, where lower SLA was observed at low P supply with all genotypes. At low P, ranking of the genotypes for SLA was in the order of CIP 384321.3> CGN 18233> CGN 17903 (data not shown). On the other hand, leaf weight ratio (LWR, the proportion of plant dry matter allocated to the leaf compared to other plant parts) was not significantly affected by P supply, but was significantly higher for genotype CGN 17903 compared to the other two genotypes at both low and high P (data not shown). Gas exchange rate and chlorophyll fluorescence parameters. The net photosynthetic rate per unit leave area was not significantly different between P levels as well as among the genotypes except for genotype CGN 18233 at high P level (Fig. 6A). Similarly, the leaf dark respiration rate at low and high P supply was not different for all genotypes (Fig. 6B). At low P supply, all the genotypes had similar leaf respiration rate while at high P supply, genotype CGN 18233 had higher leaf dark respiration rate compared to CGN 17903. Both chlorophyll fluorescence yield and electron transport rate was not affected by P supply and also did not remarkably differ between the genotypes at both P levels (Fig. 6C and D). Discussion This study shows that the PDMY was significantly higher for the P-efficient genotypes CGN 17903 and CIP 384321.3 than for the P-ineficient genotype CGN 18233 at both P levels. The PDMY of the P-efficient genotypes was less affected by low P supply than that of P-inefficient genotypes, indicating that genotypes CGN 17903 and CIP 384321.3 were more P stress tolerant than genotype CGN 18233. These results were consistent with results of previous soil experiments reported by Balemi and Schenk (2009a). Schenk and Barber (1979), Lynch et al. (1991) and Horst et al. (1993) also reported reduced dry matter yield at low P level compared with high P level for corn, wheat and common bean, respectively. Higher dry matter allocation to the leave was observed with genotype 17903 (Fig. 2A) and the higher dry matter allocation to the leaf observed with this genotype might enabled maximum light harvesting resulting in enhanced whole plant photosythetic capacity and, hence, higher growth rate of this genotype. This can be evidenced from the significant positive correlation observed between RGR and LWR at low P supply (Table 1). On the other hand, the higher dry matter allocation to the root observed with genotypes CIP 384321.3 and CGN 18233 resulted in higher P uptake and subsquent higher P accumulation in the leaf (Fig. 4A), compared with genotype CGN 17903. However, unlike with CIP 384321.3, the higher P uptake in genotype CGN 18233 did not lead to higher P efficiency, since this genotype had lower P utilisation efficiency (Fig. 4B), which was discussed in detail in earlier reports of Balemi and Schenk (2009a). Similar with the PDMY, the RGR of the P-efficient genotypes (CGN 17903 and CIP 384321.3) was less affected by P deficiency than that of the P-inefficient genotype, compared with the respective RGR at high P supply. This indicates that P deficiency considerably reduced dry matter yield of P-inefficient genotypes through its remarkable effect on RGR. At low P level, genotype CGN 17903 had the highest RGR and genotype CGN 18233 the lowest RGR. This result is consistent with the previous results from both soil as well as nutrient solution experiments (Balemi and Schenk, 2009a, b), confirming that CGN 17903 was consistently P-efficient, while CGN 18233 was P-inefficient. Higher RGR was also observed in tomato at high P than at low P supply as reported by De Groot and Marcelis (2004). The higher leaf P concentration of genotypes CIP 384321.3 and CGN 18233 compared with that of genotype CGN 17903 at low P supply was related to higher uptake efficiency in terms of higher root-shoot ratio in the former genotypes (Fig. 2B) as was also reported earlier by Balemi and Schenk (2009b) for a similar soil experiment. However, genotype CGN 17903 with lower P uptake efficiency had higher P utilisation efficiency than the other two genotypes, which had higher P uptake efficiency. Thus, P efficiency (higher PDMY and RGR at low P level) of CGN 17903 was due to higher P utilisation efficiency (Fig. 4B), while P efficiency of genotype CIP 384321.3 was due to both higher P uptake interms of higher root-shoot ratio (Fig. 2B) and intermediate P utililation efficiency. This is in agreement with earlier reports of Balemi and Schenk (2009b). But P inefficiency of genotype CGN 18233 was due to lower P uilisation efficiency (Fig. 4B), indicating that P uptake efficiency alone may does not guarantee P efficiency. The number of leaves of P utilisation inefficient genotype CGN 18233 was reduced by 40%, whereas that of the P utilisation efficient genotype CGN 17903 was not affected by P deficiency (Fig 3A). This might be due to the ability of the P utilisation efficient genotype to maintain cell division at shoot meristems to optimum level under lower P concentration leading to maintenance of optimum leaf number per plant (Lynch et al., 1991; Chiera et al., 2002). Lynch et al. (1991) and Jenkins and Mohamood (2003) also reported reduced number of leaves in common beans and potato at low P compared to hgih P supply. On the other hand, leaf area of the P-inefficient genotype CGN 18233, was reduced by 70%, whereas for the two P-efficient gentypes (CGN 17903 and CIP 384321.3), it was reduced by only 15% due to low P supply. Thus, in the case of P stress sensetive genotype (CGN 18233), leaf area was the most severly affected plant morphological parameters by P deficiency. Similar observation was reported by Fredeen et al. (1989) and Lynch et al. (1991). The highly reduced leaf area observed with the P-inefficient genotype CGN 18233 at low P was related to both reduced leaf number (Fig. 3A) and reduced RLER (Fig. 3C). Lynch et al. (1991) also reported both reduced leaf number and leaf expansion rate to the decrease in final leaf area in common bean under P-deficiency. Reduced leaf expansion rate could be either due to reduced epidermal cell expansion or reduced epidermal cell production (Radin and Eidenbock, 1984; Chiera et al., 2002; Assuero et al., 2004). Phosphorus deficiency also severly reduced plant height of the P-inefficient genotype more than that of the P-efficient genotypes compared to the high P controls. This resulted in stunted plant growth, which is the most frequently noted P stress effect in most crops. This is in agreement with reports of Nowak and Stroka (2001), Camacho et al., (2002), and Akinrinde and Gaizer (2006) who also observed reduced plant height in soghum, rice and New Guinea impatiens, respectively, under P deficiency. Net photosynthetic rate per unit leaf area measured at growth chamber light intensity was not affected by P supply and also did not differ among the genotypes at both P levels except for genotype CGN 18233, where it was lower compared to the other genotypes at high P supply (Fig. 6A). Moreover, leaf dark respiration rate also did not significantly differ between P-efficient and inefficient genotypes as well as between P levels (Fig. 6B). This indicates that the higher NAR of the P-efficient genotypes compared to the P-inefficient genotype was not explainable either interms of net photosynthetic rate or leaf dark respiration rate. The similar net photosynthetic rate per unit leaf area at both low and high P levels could be due to the presence of P concentration normally regarded as sufficient for potato , > 0.2 mg P (g d.m.)-1 (Barker and Pilbeam, 2006). Moreover, conversion of trios-phosphate to non-phosphorylated carbohydrate like starch recycles Pi so that photosynthesis can continue at constant rate (Stitt, 1986). Rodriguiz et al. (1998) also did not observe change in leaf dark respiration rate due to low P supply. The NAR at high P supply was significantly higher than that of the low P supply with all genotypes and this is in line with reports of Kirschbaum and Tompkins (1990). The lower NAR at low P than high P (Fig. 5a), despite the similar net photosynthetic rate and leaf dark respiration rate at both P levels, could be due to higher carbon loss through root respiration/exudation under low P compared to high P supply as reported by Nielsen et al. (2001) for common bean. Contrary to the current result, Virgona and Farquhar (1996) observed genotypic difference in net photosynthetic rate between sunflower genotypes, which was accountable for the differnce in RGR among the genotypes. The probable reason for the lower NAR of genotype CGN 18233 was described in earlier reports of Balemi and Schenk (2009b). Besides its relation with lower NAR the lower RGR of the P-inefficient genotype CGN 18233 in the present soil experiment also seems to have been related to the lower LAR, since this genotype showed lower LAR compared with the P-efficient genotypes at low P supply (Fig. 5B). However, this may remain controvercial since the RGR did not show significant correlation with LAR (Table 1). On the other hand, at both P levels LWR was higher for genotype CGN 17903 than for the other two genotypes, indicating that genotype CGN 17903 allocated more biomass to the leaf than to the other plant parts (Fig. 2A). This enabled maximum light harvesting, which besides higher NAR, might have also contributed to higher growth rate and dry matter accumulation of this genotype. The absence of difference in the chlorophyll fluorescence yield and electron transport rate between P levels as well as between P-efficient and inefficient genotypes, implies that the quantum efficiency of photosystem II was not affected both by P supply as well as by genotypes. These results agree with the result that net photopynthetic rate also did not differ both between the genotypes and P levels. Abadia et al. (1987) and Nowak and Stroka (2001) also did not observe a significant effect of P deficiency on chlorophyll fluorescence parameters whereas, Xu et al. (2007) was able to observe reduced chlorophyll fluorescence yield and electron transport rate under extended P stress with rice. CONCLUSION Low P supply more severely affects plant growth rate and dry matter yield of the P-inefficient genotype CGN 18233 than the P-efficient genotypes CGN 17903 and CIP 384321.3. This is through affecting plant morphological parameters such as number of leaves, leaf area and plant height as well as the physiological component of RGR (i.e. NAR) compared to optimum P level. Phosphorus stress effect, however, does not affect plant physiological parameters such as net photosynthetic rate and leaf dark respiration rate in both P-efficient and inefficient genotypes. REFERENCES
Copyright © 2009, African Crop Science Society The following images related to this document are available:Photo images[cs09019f2.jpg] [cs09019f5.jpg] [cs09019f1.jpg] [cs09019f4.jpg] [cs09019t1.jpg] [cs09019f6.jpg] [cs09019f3.jpg] |
| |||||||||

