 |
| About Bioline | All Journals | Testimonials | Membership | News |
|
||||||
|
||||||
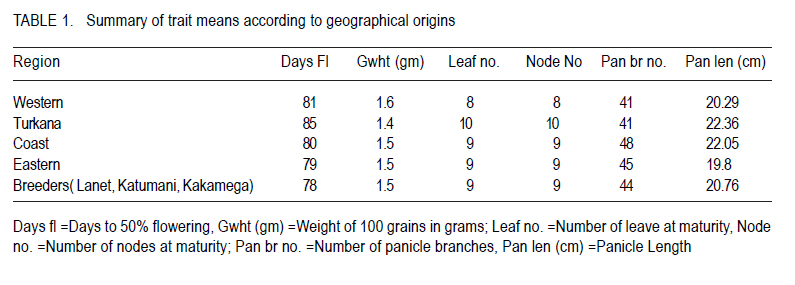
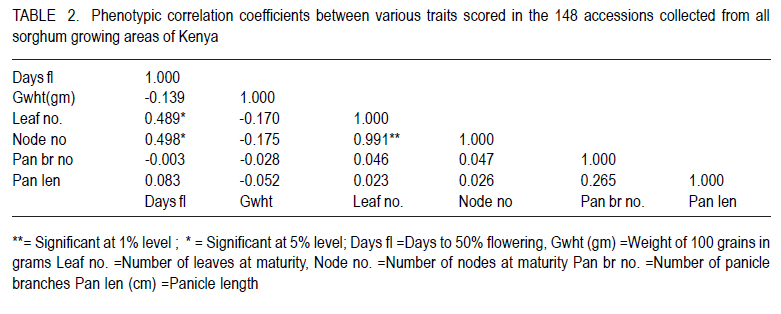
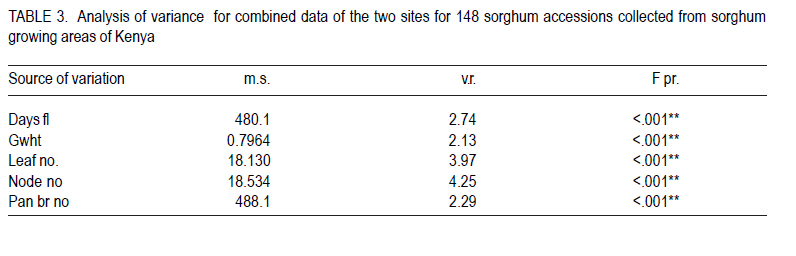
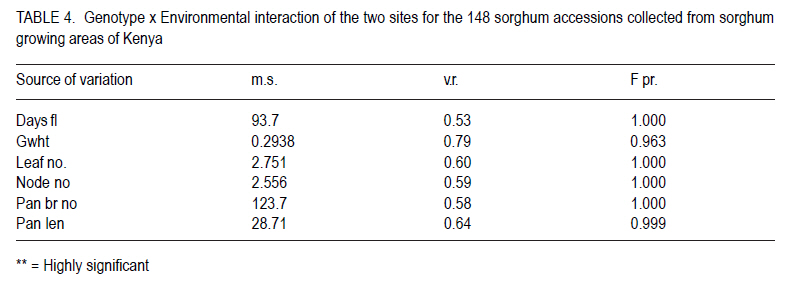
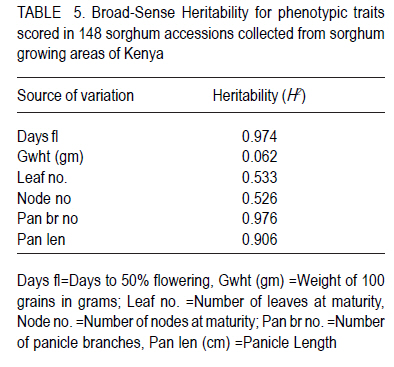
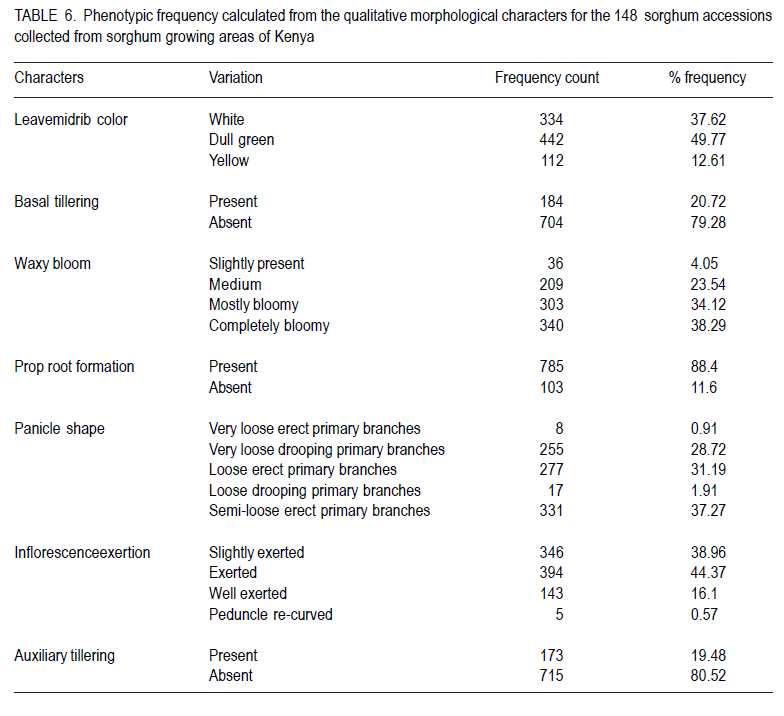
African Crop Science Journal, Vol. 18, No. 3, 2010, pp. 165 - 173 PHENOTYPIC DIVERSITY IN SORGHUM LANDRACES FROM KENYA K. NGUGI and , R. MASWILI University of Nairobi, Department of Plant Science & Crop Protection, P. O. Box 29053 00625, Nairobi , Kenya Corresponding author: kahiu.ngugi@yahoo.com; rachkam@yahoo.com Code Number: cs10020 ABSTRACT Characterisation of the available Kenyan sorghum genetic diversity is important for understanding the dynamics of the genetic resources and for improving and sustaining sorghum productivity. The aim of this study was to assess the extent and structure of diversity in sorghum landraces from Kenya. Phenotypic data were used to assess diversity in 148 sorghum accessions collected from Western, Turkana, Coast and Eastern regions of Kenya. The accessions were phenotyped using qualitative and quantitative morphological characters. Most of the accessions were high yielding as revealed by the means of panicle branches (43), panicle length (21cm), and grain weight (1.5 g). Majority of the sorghums were late maturing and tall as shown by the mean number of days to 50% flowering (88 days), number of leaves and nodes. Turkana and coast sorghums had similarities in maturity, height and panicle length. The number of panicle branches had the highest Broad-sense heritability (0.957). Majority of the sorghums had dull green midrib (49.55%), no basal tillers (83%), had waxy bloom (39.64%) and produced prop roots (87%). Loose and semi-loose erect panicles dominated (69%) while 83% of the accessions had slightly exerted peduncles. The two Eigen values in PCA explained 67% of the total variance. Phenotypic cluster analysis gave two major groups subdivided into four sub clusters. Key Words: Genetic resources, germplasm, phenotypic RÉSUMÉ La caractérisation de la diversité génétique du sorgho disponible au Kenya est important pour la compréhension de la dynamique des ressources génétiques et pour l'amélioration et durabilité de la productivité du sorgho. L'objectif de cettte étude était d'évaluer le niveau et la structure de la diversité dans le sorgho indigène du Kenya. Des données phénotypiques étaient utilisées pour évaluer la diversité dans 148 accessions de sorgho collectées à l'ouest, Turkana, Coast et régions de l'est du Kenya. Le phénotype des accessions étaient déterminé par l'utilisation des caractères morphologiques qualitatif et quantitatifs. Laplupart des accessions étaient à haut rendement comme l'a révélé les moyennes de branches de panicles (43), longueur des panicles (21cm), et le poids de grains (1.5 g). La majorité de sorghos était à maturation tardive avec long taille comme révélé par la moyenne du nombre de jours à 50 % de floraison (88 jours), le nombre de feuilles et de nodes. Les sorghos Turkana et Coast présentaient de similarités en terme de maturité, la hauteur et la longueur des panicules. Le nombre des branches de panicules avait un sens d'héritabilité le plus large (0.957). La majorité de sorghos avait une veine centrale de la feuille légérement verte (dull green midrib) (49.55%), sans talles basales (83%), avec de fleurs à matières collantes (39.64%) et racines adventives sur les noeuds aeriens (87 %). Les panicules verticales ouvertes et semi ouvertes étaient dominantes (69%) pendant que 67% des accessions avaient des pédoncules inserrées ou légerement inserrées. Les deux premières valeurs de Eigen dans PCA ont expliqué 67 % de la variance totale. L'analyse phénotypique des clusters a abouti à deux groupes majeurs subdivisés en quatre sous clusters. Mots Clés: Ressources génétiques, germoplasme, phénotypique INTRODUCTION Sorghum (Sorghum bicolor (L.) Moench is the fifth most important grain crop worldwide after maize (Zea mays), wheat (Triticum species), rice (Oryza sativa L.), and barley (Hordeum vulgare L.) in terms of production and area planted (FAO FAOSTAT, 2004; FAO, 1995) In Africa, it is the second highly produced cereal after maize (Gerda and Christopher, 2007). Sorghum is able to grow with less water than the other creals such as maize and wheat, and is well adapted to growing in many arid and semi-arid regions of the world (Mamoudou et al, 2006; Markus and Gurling, 2006; Taylor and Emmambux, 2008). Sorghum yields in Africa are low with an average of 0.85 t ha-1 (Gerda and Christopher, 2007). In Kenya, sorghum is traditionally grown in the drought-prone marginal agricultural areas of north-eastern, eastern, Nyanza and Coast Provinces largely under rain fed conditions (EPZ, 2005; CFC and ICRISAT, 2004). More than 35% of sorghum is grown for human consumption, while the rest is used for animal feed, alcohol production and industrial products (Mamoudou et al., 2006). Many poor families rely on sorghum for food security. However, most of the farmers in dry land areas of Kenya prefer maize to sorghum, mainly due to less labour in bird scaring. However, the recent climate change scenarios will dictate that smallholder farmers not yet growing sorghum may need to consider growing it and, therefore, there is an urgent need to develop sorghum varieties that will cope with the vagaries of drought stress. In the past, impressive yield gains through cultivar improvement have been realised by utilising genetic variability for yield components and adaptation traits (Rai et al., 1999). Sorghum has one of the largest crop germplasm collections, comprising more than 42,000 accessions (Huang, 2004; Dahlberg et al., 2002). The large diverse germplasm provides great opportunities for improvement of the plant adaptation and other agronomic traits (Huang, 2004). Selection of varieties meeting specific local food and industrial requirements from this great biodiversity is of high importance for food security. However, in many sorghum growing areas of Africa, many sorghum accessions have been lost or are under serious risk of genetic erosion, and hence, genetic diversity within primary gene pools has been decreasing due to modern agricultural practices. Therefore, compre-hensive knowledge of germplasm diversity and genetic relationships among cultivated sorghum will remain an invaluable aid in the crop improvement strategies for current and future breeding programs (Mohammad and Prasanna, 2003). Many studies have been devoted to assessing patterns of sorghum genetic variation based on morphology or pedigree (Agrama and Tuinstra, 2004, Torkpo et al., 2006). The measurement of morphological variation is the most easily obtained indicator of genetic diversity. Morphological characters may be ecologically adaptive meaning they are good indicators of genetic variation, local differentiation, or ecotypes and can be used to classify the phenotypic diversity (Grenieret et al., 2001). The objective of this study was to assess and determine the distribution of genetic diversity of sorghum accessions from different geographical locations in Kenya using phenotypic traits. MATERIALS AND METHODS Collection of germplasm. A total of 148 Sorghum accessions comprising of landraces and farmer varieties were collected from all the sorghum growing areas of Kenya, i.e., north eastern (Turkana), eastern, coast and western Kenya. A selected number of breeders' lines were also included from Kenya Agricultural Research Institute (KARI) at Katumani, Lanet and Kakamega. Experimental and plot design. The accessions were planted in two sites, a mid- altitude ecological zone and a low altitude ecological zone at different seasons. The first experiment was planted at Kiambeere Tarda Farm (low altitude) on 6th November, 2007 during the short rains; while the second was planted at Kenya Agricultural Research Institute, Embu (mid- altitude) on 7th March 2008 during the long rains. In both sites, the accessions were replicated 3 times using the "Balanced Lattice" design of 14x14. The plot for each accession consisted of three rows, 3 m long. Basal fertiliser application was done at the rate of 20 kg N and P2O5 at planting. The first weeding was done two weeks after germination and the second weeding was done at boot stage. Selection of plants and scoring. The morphological data were recorded using the International Plant Genetic Resources Institute (IPGRI) characterisation descriptor list with some amendments. Scoring of phenotypic characters was done in the middle row of each plot. Three plants per accession were used for scoring and the mean obtained. The following parameters were recorded: days to 50% flowering (days), panicle length (cm), panicle branch number, 100-seed weight, number of nodes at maturity, number of leaves at maturity, leaf mid rib colour, waxy bloom, basal tillering, prop root formation, auxiliary tillering, panicle type/shape and peduncle (inflorescence) exertion. Data analysis. Statistical calculations were done on the quantitative morphological characters using GenStat Discovery Edition 3 soft-ware. The analysis of frequency was done for the qualitative characters using the Pivot table Analysis method. Broad-sense heritability (H2) was calculated as H2 = s2G/ s2p = s2G /[s2G + s2e/r] where; s2G is the genetic (or genotypic) variance, s2p is the phenotypic variance, s2e is the plot residual or error variance from the ANOVA and r is the number of replications. Similarity matrices were computed from quantitative data based on Ward's algorithm (Ward, 1963) euclidean distance method among the 148 accessions and geographic origins. The similarity matrices were subjected to the multivariate hierarchical cluster analysis using the complete linkage method in the GenStat software. The GenStat Discovery Edition 3 was also used to calculate principle component analysis (PCA) from the quantitative data. RESULTS Growth parameters. Most accessions (Data not presented) flowered at 80 days. The mean grain weight was relatively high (1.5g per 100 seeds) (Table 1). Both the number of leaves and at maturity for the majority of the sorghum accessions were 9, with some accessions having only 6 leaves and nodes and others having 13 leaves and nodes. Accession Nyakosore of Western Kenya had 12 leaves and 13 nodes indicating leaf senescence. Most of the accessions had 43 panicle branches. The panicle length ranged between 11 to 46 cm with a mean of 20.76 cm long. The analysis for each site revealed that the accessions had similar performance in all the quantitative traits, except the days to 50% flowering as shown by the site means. The accessions flowered earlier at Kiambeere (site 1) in 73 days, while they flowered late at Embu (site 2) in 88 days. Turkana accessions were the latest maturing (85 days). Eastern Kenya accessions and breeders' material were earliest maturing (79 and 78 days, respectively). The Western Kenya accessions had the highest grain weight, while Turkana accessions had the lowest grain weight, although the variability in grain weight was low. The highest number of panicle branches was found in the Coast. There was little diversity in the panicle length which ranged between 22.36 cm (Turkana) to 19.8 cm (Eastern province). Turkana sorghums were the tallest as shown by the means of number of nodes and leaves. Correlations between quantitative traits. Table 2 shows that 100 grain weight was negatively correlated with all the traits. There was a positive and significant correlation (P<0.05) between leaf number and days to flowering, as well as between node number and days to flowering (r = 0.489* and r = 0.498*), respectively. Panicle length and days to flowering were not significantly correlated (r = 0.083). The panicle branch number and leaf number had a low relationship (r = 0.046) and panicle length and leaf number also had a lower positive correlation (r = 0.023). The panicle length and panicle branch number had a low positive correlation (r = 0.265). Analysis of variance. There was high significant difference between the accessions in number of days to 50% flowering, 100 grain weight (g), leaf number at flowering, the number of nodes at flowering, the number of panicle branches and the panicle length at 5% (P < 0.05) significance level (Table 3). According to the genotype x environment interaction analysis (Table 4), there was no significant difference at P>0.05 among the phenotypic traits in the two sites (Kiambeere and Embu). Broad sense heritability (H2). As observed in Table 5, the highest heritability was found in the number of panicle branches (0.976) and days to 50% flowering (0.974). Panicle length had also a good heritability (0.906), while leaf number and node number had almost equal heritability values. Grain weight had very low heritability of 0.062 as would be expected. Phenotypic frequency. Table 6 indicates that 79.28% of the accessions did not produce basal tillers, but majority (88.4%) had prop roots. Most of the accessions were either mostly bloomy (34.12) or completely bloomy (38.28%). Dull green and white leaf midribs dominated the accessions, while very few entries had the yellow mid rib. The highest number of panicle shape was the semi-loose erect primary branches (37.27 %), followed by the loose erect primary branch panicles (31.19 %). 83.33% of the sorghum had slightly exerted or exerted peduncles but only 16% had well exerted inflorescence. Only 0.57% of the sorghum accessions had the re-curved peduncles. Majority of the accessions (80.52%) did not produce auxiliary tillers. Principal component analysis (PCA). The Principal component scatter plot, clustered the accessions into one big and two smaller groups, relating to their quantitative physical characters. Two accessions did not cluster with the rest. These were accession 48 (Naliba) from Turkana and 89 (Kimiiru white) from Eastern. Phenotypic relationships and distances. The 148 accessions showed clustering into two major groups. The two groups were further divided into two sub-clusters each putting the Kenyan sorghum landraces into four major phenotypic groups which were not related to their geographical locations. The western and eastern accessions were also clustered into four sub clusters showing high phenotypic differences among the western and eastern accessions. The Turkana sorghum accessions were generally grouped into one big and a second smaller cluster indicating close relationship among the individuals. Similarly the coast cluster had one major group and a second smaller group with the first group subdivided into two groups. The breeders' materials were clustered into three groups. The first Cluster was further partitioned into two sub-clusters. This indicates more variability in the breeders' sorghum material than in Turkana and Coast material but less diversity than in Western and Eastern sorghum. DISCUSSION Most of the accessions were high yielding. Majority of the sorghums were late maturing and tall. There was a range of 63 to 104 days to flowering. Can and Yoshida (1999) observed crop duration of less than 110 days in Japan sorghums. The number of nodes were highly positively correlated as would be expected. In both sites, the coefficient of variation was very high indicating large environmental influences that might have resulted in weaker correlations among some of the traits. Furthermore, in both sites, drought stress was not sufficiently severe. Despite this, most traits recorded high heritabilities with the exception of grain yield.. The Turkana sorghums were the tallest with an average of 10 nodes per accession and were also the latest maturing (85 days to 50% flowering). These two traits indicate that sorghum germplasm from Turkana has maintained the traditional sorghum characteristics may be for two reasons. Firstly due to minimum interaction with sorghum from other geographical areas and secondly, because of non-improvement through breeding. The early maturity observed in eastern and breeders' material (79 and 78 days respectively) suggests tthat breeding programmes in KARI have had access to sorghum germplasm from eastern Province, and used it to incorporate earliness or drought escaping mechanisms. There was low variability in grain weight and panicle length between the regions. The highest number of panicle branches (48) was found in the Coast, while Western Kenya material had the highest grain weight of 1.6 g per accession. Due to lower altitude and higher temperatures at Kiambeere (site 1), the sorghum from all the Kenyan regions flowered earlier at 73 days than in Embu (site 2-with a higher altitude and lower temperature), where they flowered in 88 days. This indicates how altitude and temperatures affect maturity period in sorghum, but these factors appeared not greatly affect the other traits, which gave the similar means at both sites. Days to 50% flowering gave a lower coefficient of variation compared to 100 grain weight. The highest positive correlation coefficient (r=0.991) was between number of nodes and the number of leaves. Correlation coefficients between number of nodes, number of leaves with days to 50% flowering was moderately significant. This was an indication that early maturing accessions developed more leaves, hence, had higher photosynthetic areas than late-maturing accessions. Early-maturing accessions, therefore, escaped drought stress and late-maturing accessions had less stay-green characteristic. Similar observations were made by Elangovand et al. (2007) in the sorghum germplasm from Karnataka, India. The analysis of variance reported here showed high significant differences, hence, high phenotypic diversity among accessions in all the traits tested. Elangovand et al. (2007) also observed variation in seedling vigour, midrib colour, earhead shape, earhead compactness, glume colour, glume covering, seed size, seed colour, and races. Desmae and Hailemichael (2007) in a study of Ethiopian sorghum diversity as well as Nguyen and Tomohiko (1998) in the study of Japan sorghums also observed significant differences among land-races and among geographic domains for all quantitative traits. However, in this study, there was lack of significant differences between the two sites planted at different seasons. This may be an indication that the traits were highly stable across the sites as well as the seasons, though one must take caution in reaching at this inference, since there only two sites used in this study for only two seasons. Indeed, Nguyen and Tomohiko (1998) observed a highly significant genotype x season interaction in all the traits except grain yield. Broad sense heritability values indicated that the number of panicle branches (0.976), days to 50% flowering (0.974) and panicle length (0.906) contributed highly to the phenotypic variance within all the accessions regardless of their geographical origin. The distribution of qualitative traits indicated that the majority of the sorghum had dull green midrib colour (49.77 %), no basal tillers (19.28 %), were completely bloomy (38.29 %) and produced prop roots (88.4 %). Rangaswami (1936) stated that green midrib colour is associated with juicy stems, while the white midribs are associated with pithy stems and therefore majority of Kenyan sorghum are juicy types. Loose and semi-loose erect panicle shapes were dominating (68.86%), while 83% of the accessions had slightly exerted or exerted peduncles. Desmae and Hailemichael (2007) found that the white midrib color (72%), non-juicy types (92%), and semi-compact to compact head types (68%) characterize the majority of Ethiopian landraces. Elangovand et al (2007) revealed that the majority of the Karnataka, Indian sorghum had the dark green leaf colour meaning juicy stems. The Principal component scatter plot clustered the accessions into three groups phenotypically. Four major phenotypic groups were realised through the cluster analysis for all the accessions without clear patterns relating them to their respective geographical origins. This indicated that clustering was according to races. Cluster analysis in the morphological characterisation of Tanzanian sorghum revealed two major distinct groups each with two subgroups, as observed in this study (Bucheyeki et al., 2008). The clustering of accessions by their geographic origin showed clustering into four clusters in western, eastern and in the breeders' material, but there were only two clusters in the Turkana and coastal germplasm. This revealed more diversity in the eastern, western and breeders' accessions than in the coast and Turkana accessions according to cluster analysis. This may be due to the fact that sorghum is cultivated in a wider area in western and eastern Kenya than in Turkana and at the coast. Introduction of new sorghum varieties and landraces through breeding and human transportation may have caused higher sorghum diversity in the eastern and western Kenya region and definitely in the breeding materials. The introgression from the Ugandan sorghums into the western material may have also caused higher variability in western Kenya germplasm. The western materials were also collected over a wider area. Breeders' materials have been selected from diverse origins and crossed with different germ-plasm hence the higher diversity. The close relationship among the Turkana accessions can be attributed to lack of germ-plasm movement from Turkana to other regions due to geographical isolation. The few Turkana accessions were collected over a small area. There may be little introduction of new landraces and varieties into the coast region leading to less diversity. REFERENCES
Copyright 2010 - African Crop Science Journal The following images related to this document are available:Photo images[cs10020t3.jpg] [cs10020t5.jpg] [cs10020t4.jpg] [cs10020t2.jpg] [cs10020t1.jpg] [cs10020t6.jpg] |
| |||||||||
