 |
| About Bioline | All Journals | Testimonials | Membership | News |
|
||||||
|
||||||
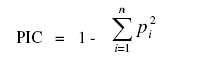
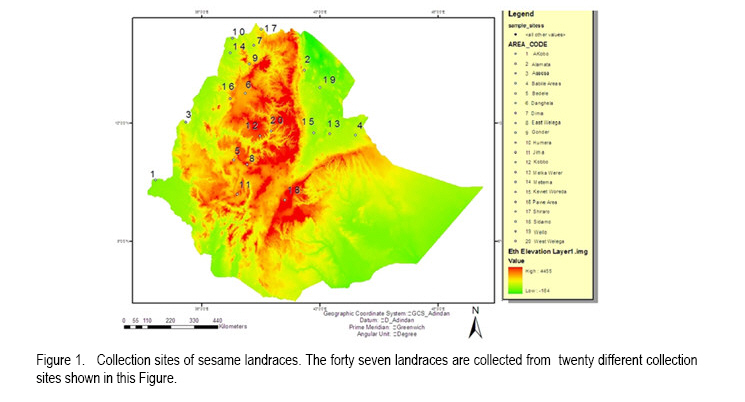
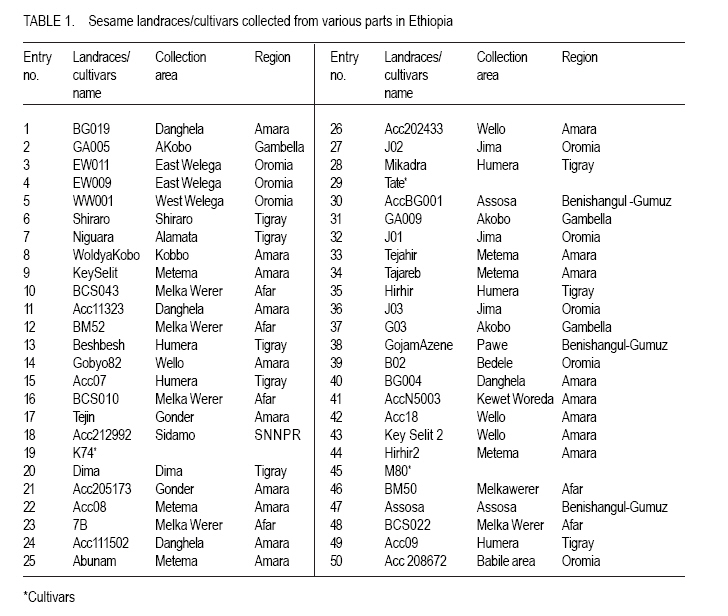
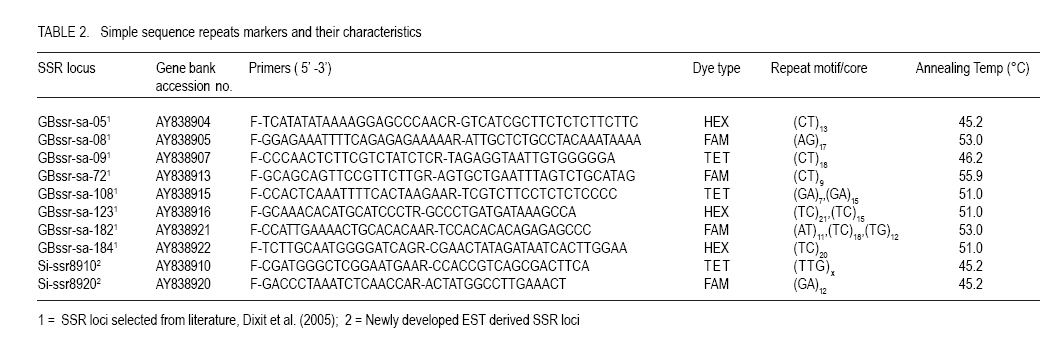
African Crop Science Journal, Vol. 19, No. 1, 2010, pp. 1 - 13 Genetic Variability Among Landraces of Sesame In Ethiopia Daniel Endale GEBREMICHAEL and Heiko K. Parzies1 Ethiopian Institute of Agricultural Research, Werer Agricultural Research Centre, P. O. Box 2003, Addis Abeba, Ethiopia 1Institute of Plant Breeding, Seed Science, and Population Genetics, University of Hohenheim, Stuttgart D-70593, Germany (Received 6 April, 2010; accepted 26 August, 2010) Code Number: cs11001 ABSTRACT Sesame (Sesamum indicum L.) is an ancient oil crop that has been referred to as the `Queen of oilseeds' by virtue of its high quality oil. Ten Simple Sequence Repeats (SSRs) markers were used to study patterns of genetic variation within and among 50 sesame populations representing the existing Ethiopian collections. The number of alleles ranged from 6 to 17, with an average of 12.1 per locus. The Polymorphism Information Contents (PICs) of the markers ranged from 0.393 to 0.820. The observed heterozygosity (Ho) for landraces and cultivars ranged from 0.060 to 0.440 and 0.120 to 0.260, with a mean of 0.234 and 0.193, respectively, indicating the existence of higher heterozygosity within the landraces than cultivars. Landraces (He=0.377) showed higher Nei's average genetic diversity than the cultivars (He=0.305). The fixation index (Fst) values for the landraces and cultivars were 0.427 and 0.26, respectively, indicating that genetic divergence between populations was smaller than genetic divergence within. High outcrossing of 45 and 46.4% for landraces and cultivars, respectively, indicates that both landraces and cultivars are line mixtures and segregants of past outcrossing results. A Neighbour-Joining dendrogram based on Modified Rogers' Distances (MRD) and a principal coordinate analysis based on a simple dissimilarity matrix, points towards some grouping based on geographical origin. The established SSR markers will be very useful for further diversity analyses among a large landrace collection of Ethiopian sesame and in the establishment of a core collection. Moreover, existence of great genetic variability between the landraces is a good starting point of sesame crop improvement programs in Ethiopia. Key Words: Markers, Sesamum indicum, simple sequence repeat RÉSUMÉ La Sésame (Sesamum indicum L.) est une culture à huile anciennement dénomée "Reine de graines oléagineuses", en vertu de son huile de haute qualité. Dix marqueurs à répétition simple de séquences (SSR) étaient utilisés pour étudier le modèle de variation génétique, parmi et au sein de 50 populations de sésames éthiopiennes représentant les collections existantes locales. Le nombre d'allèles variait de 6 à 17 avec une moyenne de 12,1 par locus. Le contenu d'informations polymorphiques (PICs) des marqueurs variait entre 0.393 et 0.820 L'hétérozygosité observée (Ho) pour les races locales et les cultivars variait de 0,060 à 0,440 et de 0,120 à 0,260, avec une moyenne de 0,234 et 0,193 respectivement, indiquant l'existence d'une héterozygosité plus élevée dans les races locales que dans les cultivars. Les races locales (He=0.377) ont montré une Nei avec une moyenne de diversité génétique plus élevée que celle des cultivars (He= 0.305). Les valeurs d'index de fixation (Fst) pour les races locales et les cultivars étaient de 0.427 et 0.26 respectivement, montrant que la divergence génétique entre les populations était plus petite que la divergence génétique parmi les populations. Un croisement hétérogène élevé de 45 et 46.4 % pour les races locales et les cultivars, respectivement, indique que les races locales et les cultivars sont des lignées mixtes et ségrégants des résultats des croisements hétérogènes passés. Un dendogramme développé sur base des Distances modifiées de Rogers (DMR) et l'analyse de principales coordonnées basée sur une simple dissemblance matricielle montrent quelques groupements sur base de l'origine géographique. Les marqueurs (SSR) établis seront très utiles pour d'autres analyses de diversité au sein d' une large collection de races locales de sésames ethiopiennes et dans l'établissement d'une collection de base. En plus, l'existence d'une grande variabilité génétique entre les races locales est un bon point de départ pour des programmes d'amélioration de la cultutre de sésame en Ethiopie. Mots Clés: Marqueurs, Sesamum indicum, répétition de séquences simples INTRODUCTION Sesame (Sesamum indicum L.) is an ancient oil crop that has been referred to as the `Queen of oilseeds' by the virtue of its high quality oil (Salako and Falusi, 2001). Sesame belongs to the Pedaliaceae family, which contains 60 species organised into 16 genera (Rendle, 1963; Ashri, 1998). The chromosome number of the cultivated sesame was reported as 2n = 26 (Toan et al., 2009). Sesame is generally considered a self-pollinated crop despite varying degrees of natural crosses ranging from less than 10% (Khidir, 1972) to over 50% (Rheenen, 1980). Sesame is basically a crop of the tropics and subtropics, but whose origins are still debated. Ethiopia is considered to be the original home, although there are considerable arguments in favour of India as the other possible centre, of origin (Seegeler, 1983). In Ethiopia, sesame breeding based on introduction and pure line selection was started in the late 1960s by Werer Agricultural Research Centre (WARC) involving materials from indigenous landraces as well as exotic sources (Tadele, 2005). Since then ten cultivars have been released and more than 300 landraces collected. However, variability among these collections is unknown; information about their morphological traits is available (WARC, 2006). Information about genetic diversity and relationships among sesame landraces is vital for crop improvement. Information on the use of molecular markers for the characterisation of genetic diversity in sesame is limited. Little information is available on the use of molecular markers such as isozyme (Isshiki and Umezaki, 1997), RAPD (Bhat et al., 1999), ISSR (Kim et al., 2001), SSRs (Dixit et al., 2005) and AFLP (Laurentin and Karlovsky, 2006; Ali et al., 2007). SSRs are clusters of short tandemly repeated nucleotide bases and have proved the most valuable polymerase chain reaction (PCR) based DNA markers in genetic diversity analysis of many crop species. They are characterised by high variability, co-dominant nature, great abundance and even distribution throughout genomes. For SSRs, each location in a chromosome that contains core repeats may have a different number of copies of the repeat. Polymorphism is based on the number of tandem repeats and, therefore, the length of PCR products (Dreisigacker et al., 2005; Blair et al., 2006; Milee et al., 2008). The development of SSRs markers could be based on the screening of genomic DNA libraries specifically constructed for the discovery of repeated sequences in the genome. Ten SSR markers have been developed (Dixit et al., 2005). However, they have not yet been used to assess the genetic diversity of different sesame landraces. The objective of this work was, therefore, to study the genetic diversity of cultivated sesame in Ethiopia based on SSR markers. MATERIALS AND METHODS Plant materials. Seeds of 47 landraces of sesame collected from different sites (Fig. 1) covering major sesame growing areas in Ethiopia and three nationally released cultivars named K74 (Kelafo 74), M80 (Mehado- 80) and Tate (Table 1) were used in the study. Five seeds from each population (landraces/cultivars) were planted separately in soil in a 77 cell tray in a green house. Young leaves (2-3 leaves) free of disease infestation were collected and dried in filter paper bags on the silica gel for 48 hours. DNA extraction, primer selection and polymerase chain reaction. Genomic DNA was extracted from dried leaf tissues employing a modified CTAB procedure (Saghai Maroof et al., 1984). DNA samples were stored at -20 °C in TE buffer until the measurement of concentration. The concentration of the DNA fragments was estimated against lambda DNA standards at concentrations of 10 and 50 µl and DNA samples were diluted accordingly. A total of 13 SSR markers were selected for this study. Three primer pairs for novel SSR markers (Si-ssr8910, Si-ssr8914 and Si-ssr8920) have been developed employing Primer Premier 5.0 Software (Lalitha, 2000) using publicly available Expressed Sequence Tags (ESTs) for sesame obtained from the National Centre for Biotechnology Information (NCBI). Ten sesame SSR markers were selected from literature (Dixit et al., 2005). The forward primers of each of these 13 primers were labeled with fluorescent dyes, namely tetrachloro-6-carboxyfluorescien (TET; green colour), Hexachloro-6-carboxyfluorescein (HEX; black colour) or 6-carboxyflourescein (6-FAM; blue) at the 5' end of the primer. The 10 SSRs primers that produce amplified products are listed in Table 2. PCR conditions were maintained and each PCR reaction was carried out in a 10 µl reaction volume containing bidest water, 1.5 mM MgCl2, 1 x 1.5 mM MgCl2 of 10 x PCR buffer, 0.2 mM of deoxyribonucleotides, 250 nM of each forward and reverse primers, 0.5 units of Taq DNA polymerase and 10 ng of DNA. The temperature profile used for PCR amplification comprised a denaturation step at 94 °C for 1 minute, followed by primer annealing temperature at 45.2 -53 °C for 1 minute, and elongation at 72 °C for 1 minute. After 34 cycles, the reaction was terminated with 10 min at 72°C for the final extension. The PCR reaction was carried out under the same conditions for all the primers except for the annealing temperatures. The PCR products were electrophoresed on 3% Metaphor Agarose Gel (9 g of metaphor and 300 ml of 1xTBE) at140 V for 2h, DNA ladder (50 bp) of 4 µl was used for comparison. The gels were stained consequently with ethidium bromide (5 µg ml-1) for 10 minute, de-stained for 15 minute in distilled water and visualised under a UV transilluminator and the picture captured with a digital camera. Capillary electrophoresis. A MegaBACE sequencer (Amersham Biosciences) was used to separate PCR amplification products. Individual PCR products were pooled (1-3 markers run-1) according to their fluorescent label to permit discrimination of the individual markers after electrophoretic separation. A 96 well PCR plate format and transfers using eight channel pipettes were used throughout. The internal size standard was labeled with ET-ROX (ET 400-R, Amersham biosciences). The final cocktail of the samples contained 0.5 µl of multiplexed PCR products and 5 µl of diluted ET-ROX standard (1:20 dilution with loading solution). Samples were incubated for 1 minute at 94 °C and cooled down before quick centrifuging, and then successively loaded in the MegaBACE and run for approximately 2 hours. Statistical analysis. The fragment sizes were assessed using MegaBACE Fragment Profiler (Amersham Biosciences) software. The resulting SSR data were analysed statistically using the software `Tools for Population Genetic Analysis'' (TFPGA) version 1.3 (Miller, 2000) to calculate a distance matrix between pairs of sesame population based on modified Rogers' distance (MRD) measure (Goodman and Stuber, 1983). The genetic diversity of each SSR marker was measured in terms of number of alleles per locus, allele frequencies, observed heterozygosity (Ho) and Expected heterozygosity (He) also known as Nei's average gene diversity using the "Population Genetics'' (PopGene) software version of 1.31 (Yeh et al., 1999). The polymorphic information content (PIC) for each marker was determined as described by Anderson et al. (1992):
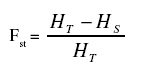
Where p2i is the frequency of ith allele. Cluster analysis was performed by using MRD estimate values and dendrogram constructed to visualise the relationship among the 50 population based on the Neighbour-Joining method using the software package "Molecular Evolutionary Genetics Analysis'' (MEGA, Kumar et al., 2004). For better comparability, a principal coordinate analysis (PCoA) was performed using DARWIN V5 software (Perrier et al., 2003). The fixation index (Fst) which characterises the partitioning of diversity between and within population was calculated as described by Wright (1978) as follows:
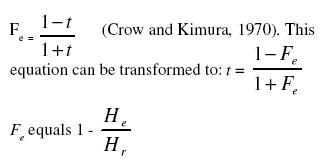
Where HT is the expected heterozygosity in the total population and Hs the mean expected heterozygosity within subpopulations. Allele frequencies of SSR loci were used to calculate mean expected heterozygosity within sub populations (Hs) and expected heterozygosity in the total populations (HT ). The outcrossing rate was estimated based on the equilibrium inbreeding coefficient (Fe) under partial selfing:
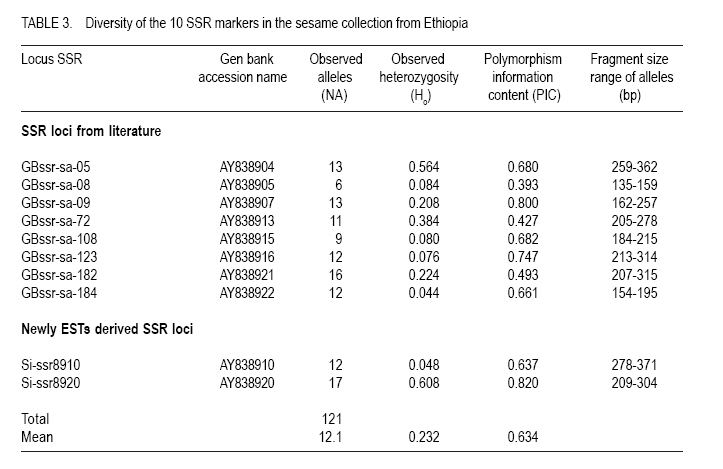
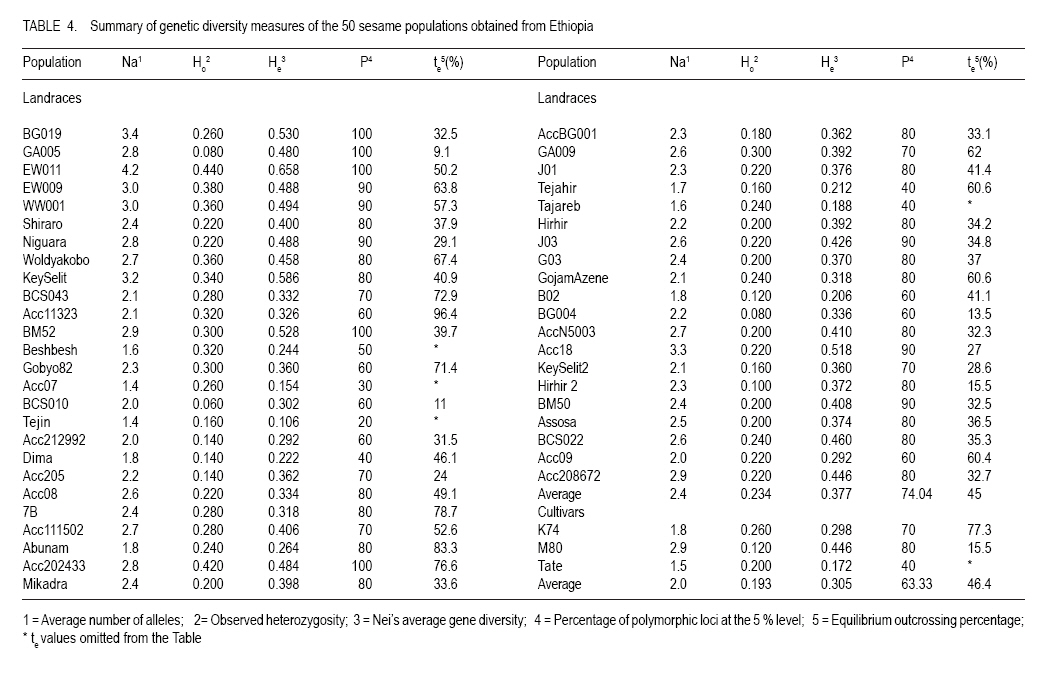
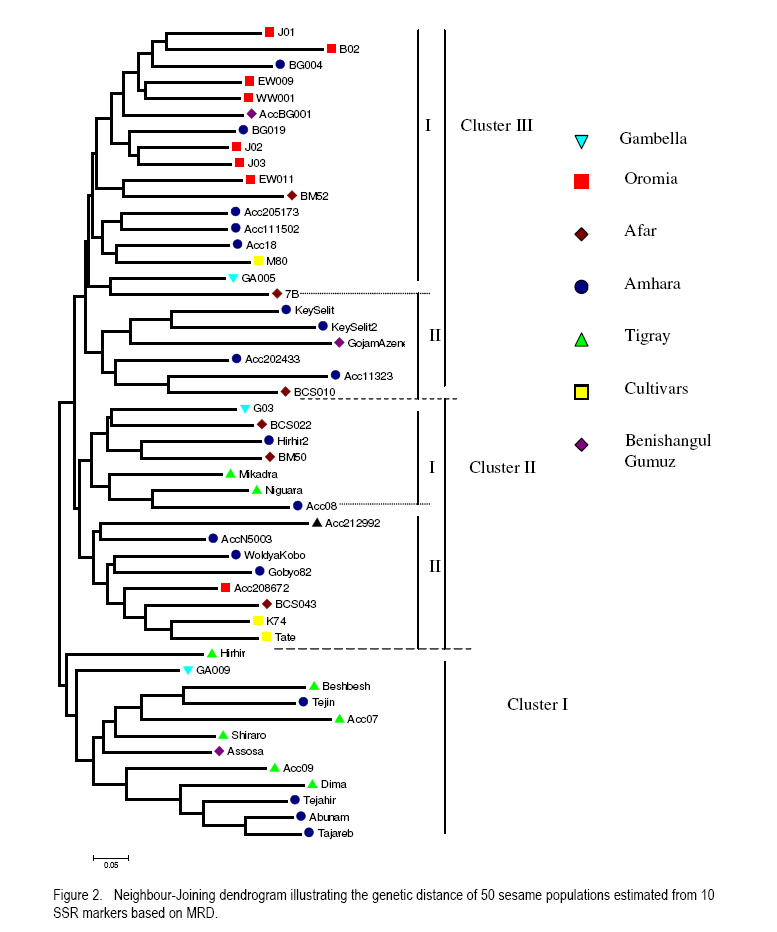
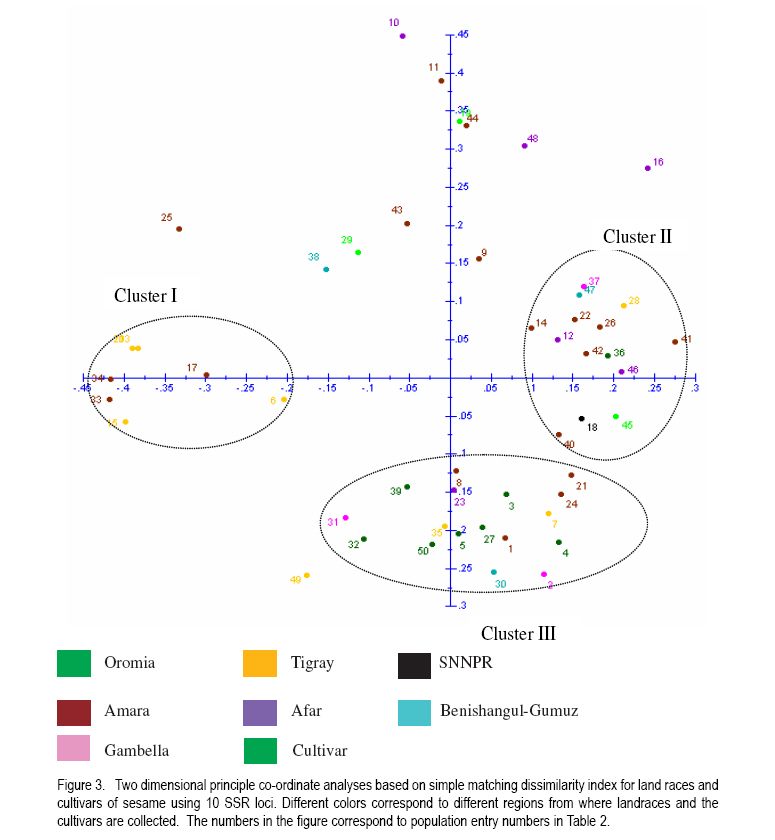
where He is the equilibrium heterozygosity at a given locus, and Hr the heterozygosity expected under random mating (Hardy - Weinberg Equilibrium). For estimating the outcrossing rate, He was replaced by the observed heterozygosity, and Hr replaced by Nei's average gene diversity, which equals the expected heterozygosity assuming Hardy-Weinberg Equilibrium. The resulting estimate is designated outcrossing at inbreeding equilibrium (te). RESULTS AND DISCUSSION Levels of polymorphism for SSR markers. Screening of publicly available ESTs data base for sesame resulted in the identification of 3 SSRs. Ten additional SSRs were selected from literature. All 13 SSRs markers were screened using 4 DNA samples of sesame landraces. Two markers (GBssr-sa-33 and GBssr-sa-173) from literature and one makers developed from publicly available ESTs for sesame Si-ssr8914 failed to produce amplification products and were discarded from the study. The two SSRs developed from publicly available ESTs database that produced amplification products were Si-ssr8910 and Si-ssr8920 and together with the 8 SSRs selected from literature are listed in Table 3. All SSR markers showed polymorphism. Overall, 121 alleles were detected using the 10 SSR markers (Table 3). The observed number of alleles (NA) per SSR marker ranged from 6 to 17 with a mean of 12.1 alleles per marker (Table 3). The maximum number of alleles was detected at marker Si-ssr8920 (NA=17). A wide range of fragment sizes was observed from 135bp to 371bp (Table 3). The SSR markers in our study showed a higher number of alleles than previous analysis of the diversity of sesame accessions conducted with SSR markers (Dixit et al., 2005). This was probably because Ethiopia is considered the origin and centre of diversity of cultivated sesame (Seegeler, 1983). This is further shown by the observed heterozygosity (Ho) that ranged from 0.044 to 0.608, with an average value of 0.232 which is higher than previous study (Dixit et al., 2005). The higher heterozygosity indicates a higher outcrossing rate of Ethiopian sesame populations, which seemed to be line mixtures rather than pure lines. The PIC value of each SSR marker demonstrates the informativeness of the markers. Values of PIC are ranging from 0 to 1 and loci having PIC values near to 1 are more desirable (Mateescu et al., 2005). The average PIC value for all 10 SSR marker loci was 0.634 with a range from 0.393 (GBssr-sa-08) to 0.820 (Si-ssr8920). The highest PIC value of =0.820 was observed for marker Si-ssr8920 (Table 3) and is similar to a previous result found in Korean sesame (Dixit et al., 2005). Genetic diversity. Genetic diversity measurements of the 50 sesame populations are presented in Table 4. The average numbers of alleles (Na) per locus were 2.4 for landraces and 2.0 for cultivars. The number of alleles ranged from 1.4 to 4.2 for landraces and 1.5 to 2.9 for cultivars. The highest average number of alleles was observed in landrace EW011 (Na = 4.2), followed by BG019 (Na = 3.4) and Acc202433 (Na = 3.3); while landraces Beshbesh and Tejareb (Na = 1.6) and Tejin and Acc07 (Na = 1.4) showed the least allelic richness. The cultivars M80 (Na = 2.9) and Tate (Na = 1.5) showed the highest and lowest allelic richness, respectively. The heterozygosity for landraces ranged from 0.060 to 0.440. Landrace EW011 showed the highest heterozygosity of 0.440, followed by landraces Acc202433 (Ho=0.420), and J02 and EW009 (Ho=0.380). Landraces GA005 and BG004 (Ho=0.080) showed the least observed heterozygosity, followed by BCS010 (Ho=0.060). High average heterozygosity was observed both in the landraces (0.234) and cultivars (0.193), which was an indication of the existence of high outcrossing in the landraces and cultivars. The proportion of polymorphic loci per marker ranged from 20 to 100% (Table 4). The average of polymorphic loci was 74.04 for landraces and 63.33% for cultivars. Among the 50 lines evaluated, landrace EW011 was the most diverse with Nei's average gene diversity of 0.658 and Tejin (0.106) was the least diverse. The landraces were more diverse than the cultivars. Nei's average gene diversity for landraces was 0.377 and 0.305 for cultivars (Table 4). However, the differences in all genetic diversity indices between landraces and cultivars was not statistically significant (P<0.05). But significantly (P<0.05) lower mean average number of alleles, mean observed heterozygosity, mean Nei's average gene diversity and percentage of polymorphic loci were observed in cultivars than in landraces. This indicates that landraces were genetically more diverse than the cultivars. Hence, landraces seemed to be rather line mixtures compared to the cultivars. Genetic differentiation and outcrossing. The fixation index for the cultivars indicated that 26% of the diversity was between cultivars and 74% of the diversity was within, while the Fst value for the landraces was 43% of the variation between and 57.3% of the variation within the landraces. The higher value of Fst in landraces was unexpected as usually greater differentiation is expected between more advanced materials or cultivars (Hamrick and Godt, 1997). The small sample size of 5 individuals used in our study could be one explanations for this result. However, the result may also illustrate that the cultivars were not at all pure lines but still diverse line mixtures. Outcrossing is a very important aspect to be considered in order to establish strategies for plant breeding or landrace management and conservation (Rheenen, 1980). In this study, we used a rough estimate of outcrossing from observed heterozygosity and Nei's average gene diversity. Different authors reported contradicting results concerning the outcrossing the percentage of sesame (Khidir, 1972; Rheenen, 1980). We also observed a wide range of outcrossing in the landraces (9.1 to 96.4%) and cultivars (15.5 to 77.3%) with means of 45 and 46.4%, respectively (Table 4). This indicated a mixed mating system. In some cases, the value of Ho was higher than the value of He resulted in outcrossing values higher than 100% and those unreasonable results were omitted from Table 4. The observed heterozygosity exceeded that expected under Hardy-Weinberg Equilibrium in some cases (Table 4). According to Lowe et al. (2004) our result can be explained by the presence of heterozygote advantage or the heterogeneity of environments in which the landraces were cultivated. Cluster analysis. A Neighbour-Joining dendrogram was generated based on MRD values (Fig. 2). Overall, 3 clusters were formed. Cluster I comprised of 12 landraces, 1 each from Gambella and Benishangul-Gumuz regions and 10 of them originated from Amara and Tigray two major sesame growing regions. The two regions are found in the northern part of the country. Amara and Tigray regions are close to each other (Anonymous, 2005), have similar ecological conditions and exchange of seed material expected from farmer to farmer. Six out of eight landraces from Tigray region were clustered together in Cluster I, indicating the lower genetic diversity of the landraces from this region. The long tradition of sesame farming in this region might have lead to the selection of the landraces by local farmers (Anonymous, 2005), that might have caused lower genetic diversity within sesame landraces from Tigray. Within the Cluster I, two landraces (Hirhir and GA009), appeared to be distinct from all others and can be considered as a separate group. Cluster II comprised of 13 landraces, 5 of which were collected from the Amara region, 3 from Afar region, 2 from Tigray region, 1 each from Gambella, Oromia and SNNPR regions and 2 cultivars. Cluster II was further grouped in two subclusters (I and II). The first subcluster (I) comprised of 7 landraces and the rest 6 landraces in the second (II) subcluster. Two cultivars were also grouped in the second (II) subcluster of Cluster II. Cluster III comprised of 22 landraces, 9 of them collected from Amara region, 7 from Oromia region, 3 from Afar region, 2 from Benishangul-Gumuz region, 1 from Gambella region. In this Cluster there was also 1 cultivar. Cluster III was further grouped in two subclusters (I and II). The first (I) subcluster comprised of 16 landraces and 1 cultivar and the remaining 6 landraces were in the II subgroups. All landraces collected from Oromia region excluding landrace Acc208672 were grouped in subcluster I of Cluster III, which indicated the close genetic relatedness of landraces from the Oromia region. Landraces from Afar region were grouped in Clusters II and III, which indicated the existence of genetic variation among the landraces. The three cultivars were found in Cluster III (M80) and cluster II (K74 and Tate), indicating that two of the cultivars (K74 and Tate) were very similar genetically. The 18 landraces collected from Amara region were distributed over all three different clusters. Three landraces each from Gambella and Benishangul-Gumuz regions were scattered in the dendrogram and found in all three different clusters. This indicated that the materials from the Amara region were not closely related. The same holds true for landraces collected from Gambella and Benishangul-Gumuz regions. The reasons for such genetic diversity of landraces collected from the same region might be heterogeneity of sesame landraces (Kumaresan and Nadarajan, 2003). In general, there was no clear clustering in the Neighbour-Joining dendrogram; this may be due to the presence of a lot of seed exchange between farmers in different regions or, due to the fact that 10 SSR markers were too few to get a clear differentiation between the materials. Principal coordinates analysis. Principal coordinate analysis of landraces and cultivars of sesame based on simple matching dissimilarity matrix derived from allelic data of 10 SSR markers (Fig. 3) was performed to complement the Neighbour-Joining dendrogram. The entry numbers of the populations were plotted on the two component axis and different colours corresponded to different regions from where the landraces and the cultivars were collected. The first axis explained 9.92% of the variance and the second axis 9.28% of the variance. Three distinct clusters were revealed, 7 landraces in Cluster I, 14 landraces in Cluster II and 17 landraces in Cluster III. The PCoA showed a clear grouping of landraces colleted from the Northern part of Ethiopia (Amara and Tigray regions) in Cluster I. A clear distinction according to geographical origin was not apparent in Clusters II and III. Cluster II comprised 14 landraces collected from all regions, 6 of them were from Amara, 2 from Afar, 1 each from Benishangul-Gumuz, Gambella, Oromia, SNNPR and Tigray regions and one cultivar (M80). Cluster III comprised of 17 landraces collected from five regions, 5 each from Amara and Oromia region, 3 from Tigray region and 2 each from Afar and Gambella regions. Exchange of seed materials among different sesame growing regions expected that might caused mixed grouping of the landraces. There were 12 lines with no clear clustering. CONCLUSION Ethiopian sesame is genetically diverse, a factor that needs to be considered when planning conservation strategies or in breeding programmes. There is a wide range of outcrossing rates both in the landraces and cultivars, which may have contributed to the observed high genetic variability. Therefore, sesame cannot be clearly regarded as autogamous or allogamous, rather as a species with a mixed mating system. ACKNOWLEDGEMENT The authors thank Sabine Boger and Daniel Alemayehu for the technical assistance. This research was supported by fund from Dreyer Foundation Munich. REFERENCES
Copyright 2011 - African Crop Science Journal The following images related to this document are available:Photo images[cs11001t2.jpg] [cs11001t4.jpg] [cs11001f2.jpg] [cs11001t1.jpg] [cs11001f3.jpg] [cs11001t3.jpg] [cs11001f1.jpg] |
| |||||||||
