 |
| About Bioline | All Journals | Testimonials | Membership | News |
|
||||||
|
||||||
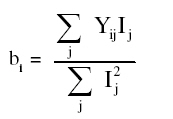
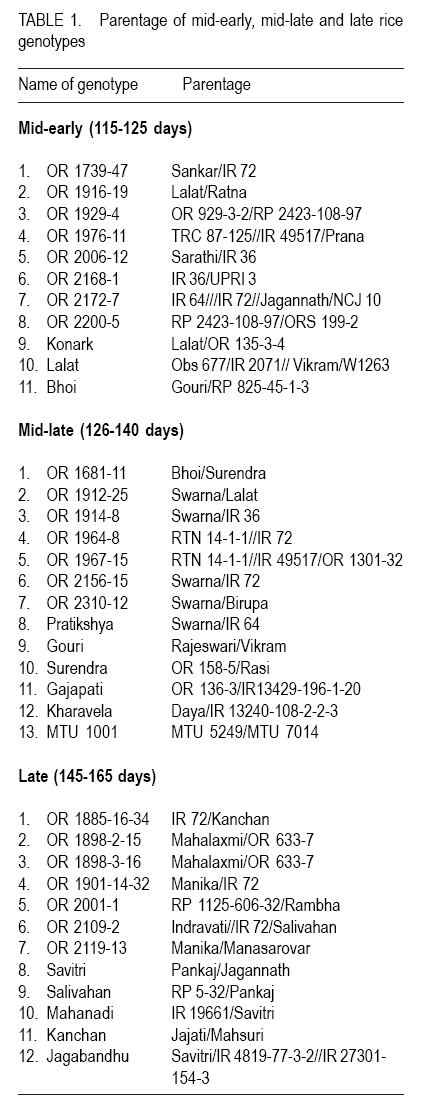
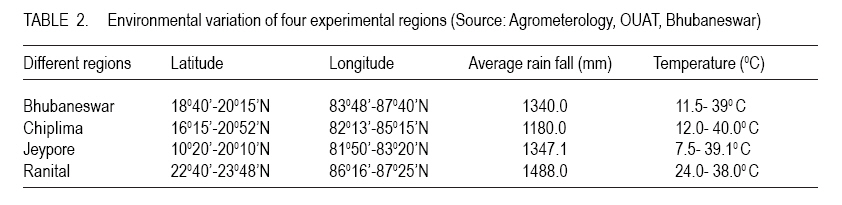
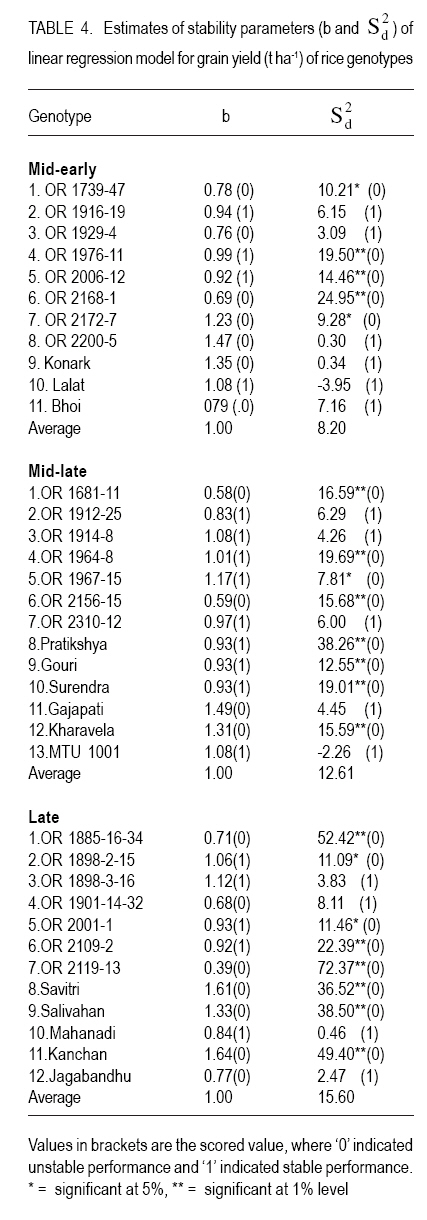
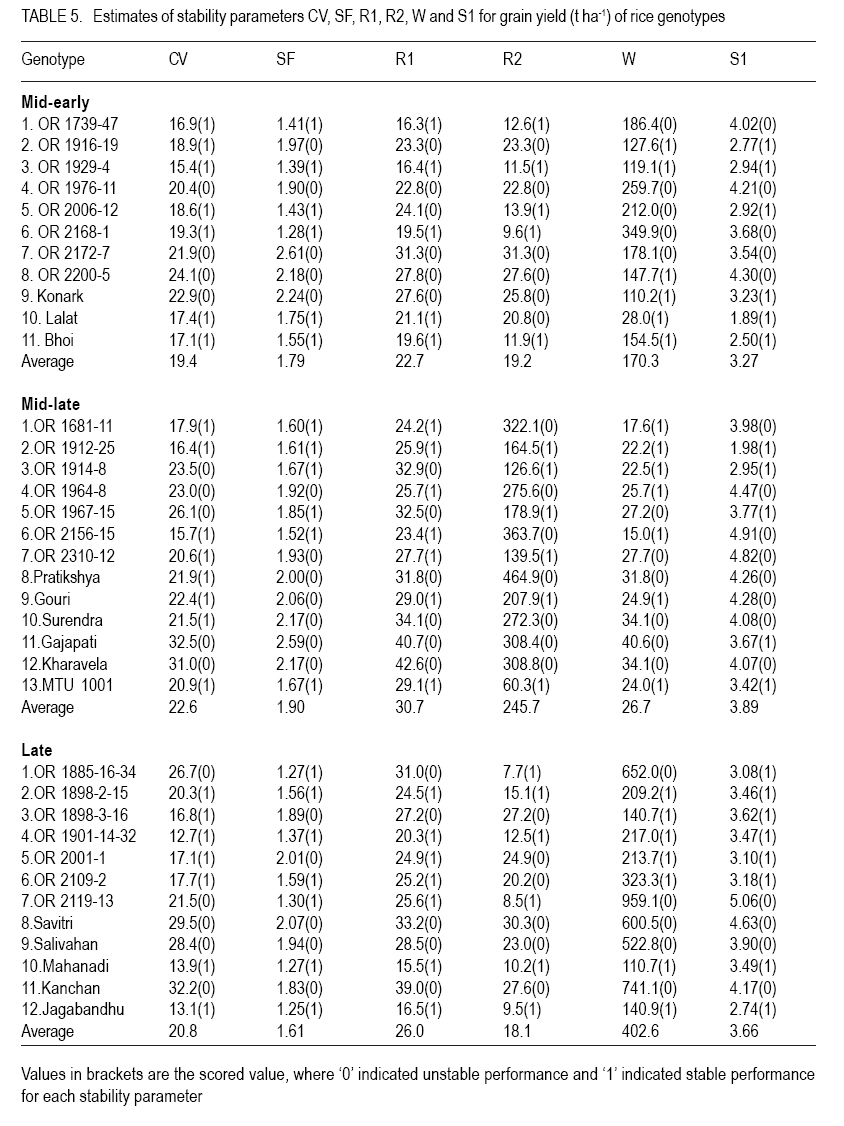
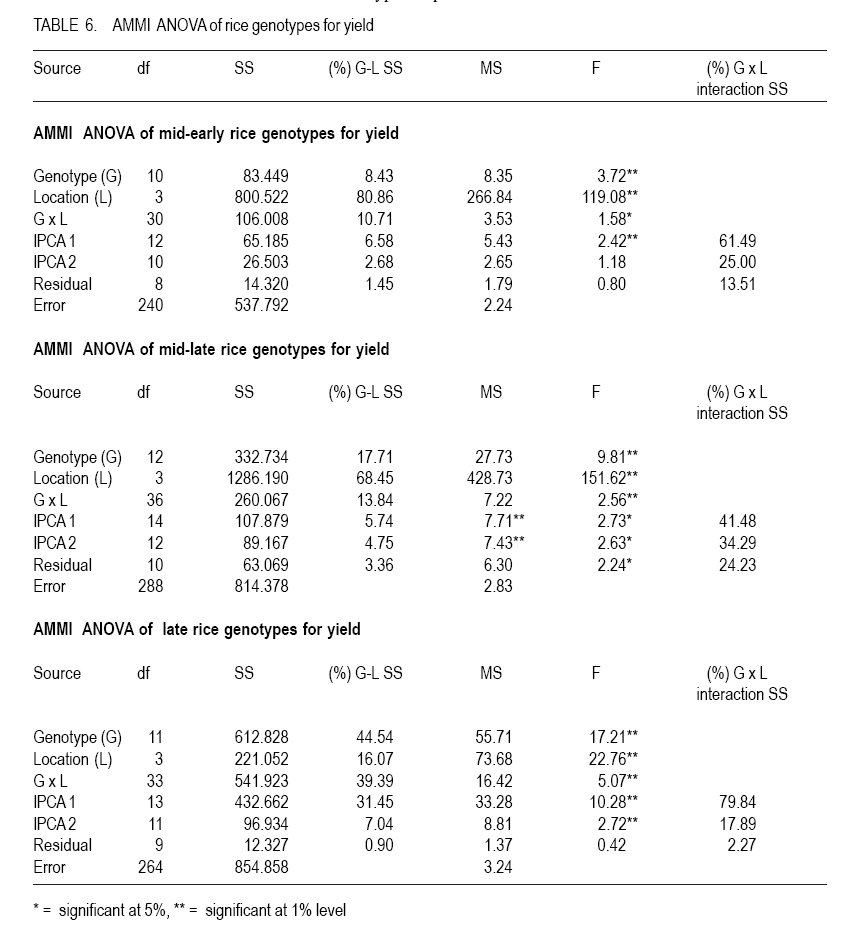
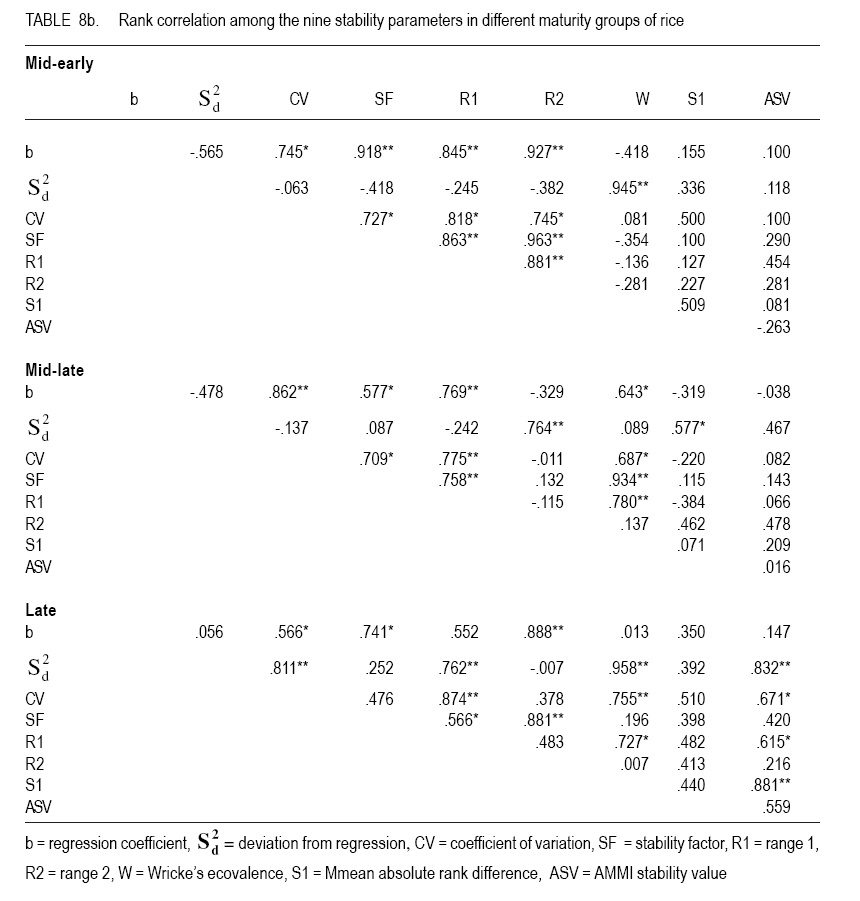
African Crop Science Journal, Vol. 19, No. 1, 2010, pp. 15 - 28 INTEGRATED ANALYSIS FOR GENOTYPIC ADAPTATION IN RICE S. DAS, R.C. MISRA, S.R. DAS, M.C. PATTNAIK and S.K. SINHA Department of Plant Breeding and Genetics, College of Agriculture, Orissa University of Agriculture and Technology, Bhubaneswar, Orissa, India Corresponding author: swarnalata1967@rediffmail.com (Received 4 February, 2010; accepted 16 December, 2010) Code Number: cs11002 ABSTRACT Development of varieties with high yield potential coupled with wide adaptability is an important plant breeding objective. The presence of genotype by environment (GxE) interaction plays a crucial role in determining the performance of genetic materials, tested at different locations and in different years. This study was undertaken to assess yield performance, stability and adaptability of thirty-six rice genotypes of three different maturity groups evaluated over 12 environments. There were highly significant (P<0.05) genotype-environment interaction in three different maturity groups. The AMMI analysis of variance in the maturity groups also showed significant genotype, location and G´L. Stability in yield performance was predicted using nine stability parameters (b, S2d , CV, SF, R1, R2, W, S1 and ASV). The rank correlation coefficient among nine parameters indicated that the stability parameters were dissimilar in for all the maturity groups. Stability index (STI) computed by integrating all the nine stability parameters indicated that genotypes Lalat and OR 2006-12 of mid-early group, genotypes OR 1912-25, OR 2310-12 and MTU 1001 of mid-late group, and genotypes OR 1898-3-16, OR 1901-14-32, OR 2109-2, OR 2001-1, Mahanadi and Jagabandhu of late group yielded higher consistently over the 3 years in the different agroclimatic zones. Key Words: Adaptation, AMMI stability value, stability index RÉSUMÉ Le développement de variétés à potentiel élevé de rendement couplé à une large adaptabilité est un objectif important de l'amélioration des plantes. La présence de génotype par interaction avec l'environnement (GxE) joue un rôle crucial dans la détermination des performances de matériels génétiques testés dans différentes localisations et dans des années différentes. Cette'étude était entreprise pour évaluer la performance en rendement, la stabilité et l'adaptabilité de trente six génotypes de riz de trois groupes de maturité différente évaluées sur 12 environnements. L'interaction génotype-environnement était significativement élevé (P<0.05) dans trois groupes de maturité différente. L'analyse AMM de la variance dans les groupes de maturité avait aussi montré un effet significatif du génotype, localisation et G'L. La stabilité en performance de rendement était prédite utilisant neuf paramètres de stabilité (b, S2d, CV, SF, R1, R2, W, S1 et ASV). Le rang du coéfficient de corrélation parmi les neuf paramètres a indiqué que les paramètres de stabilitéétaient dissemblables pour tous les groupes de maturité. L'index de stabilité (STI) calculé en intégrant tous les neuf paramètres de stabilité a indiqué que les génotypes Lalat et OR 2006-12 du mi-premier groupe, les génotypes OR 1912-25, OR 2310-12 et MTU 1001 du mi-dernier groupe et les génotypes OR 1898-3-16, OR 1901-14-32, OR 2109-2, OR 2001-1, Mahanadi et Jagabandhu du dernier groupe ont produit considérablement de rendements très élevés au cours des 3 ans dans différentes zones agroclimatiques. Mots Clés: Adaptation, valeur de stabilité AMMI, index de stabilité INTRODUCTION Development of varieties with high yield potential coupled with wide adaptability is an important plant breeding objective. The presence of genotype by environment (GxE) interaction plays a crucial role in determining the performance of genetic materials, tested at different locations and in different years, influencing the selection process (Becker and Leon, 1988; Purchase et al., 2000). Multilocation trials provide useful information on genotypic adaptation and stability (Crossa, 1990). The GxE interaction estimates help breeders to decide the breeding strategy, to breed for specific or general adaptation, which depends on stability in yield performance under a limited or wide range of environmental conditions (Romagosa and Fox, 1993). Plant breeders generally agree on the importance of high yield stability, but disagree with the different methods used for stability analysis (Becker and Leon, 1988). Therefore, several biometrical methods including univariate and multivariate ones have been developed to assess stability (Akcura et al., 2005). Among the univariate approaches, the linear regression model of Eberhart and Russell (1966) is most widely adopted by the breeders (Chowdhury et al., 2002; Bose et al., 2004; Francis et al., 2005; Nanita Devi et al., 2006; Das et al., 2008) as it is mathematically simple. But this model could not determine which genotype is superior, because the genotype's response to environments is intrinsically multivariate and regression tries to transform it into a univariate problem. The use of stability analysis other than analysis of variance (ANOVA) may also help in prediction of adaptability of genotypes. Wricke's ecovalence is an alternative method that is used by breeders to determine stability of genotypes based on GXE interaction effects (Mahapatra, 1993; Chandrasari et al., 2002; Das et al., 2008). It indicates the contribution of each genotype to the GXE interaction. When exposed to different environments, the responsive genotypes are not necessarily unstable, rather more desirable if there is consistency in yield as measured by coefficient of variation (CV) (Francis and Kannenberg, 1978). Mahapatra and Das (1998) and Chandrasari et al. (2002) used CV to predict adaptability in rice. Among the multivariate approaches AMMI model is widely used (Asenjo et al., 2003; Mahalingam et al., 2006 and Das et al.,,2008). In AMMI, the response patterns of the genotypes to environmental change can be extrapolated to a much wider range of environments. AMMI stability value (ASV) statistic was developed by Purchase (1997) to quantify and rank the genotypes on the basis of their yield stability. ASV is based on AMMI model's PCA 1 and PCA 2 scores for each genotype. It is in effect the distance from the co-ordinate point to the origin in a two dimensional scatter gram of PCA 1 score against PCA 2score. Many methods are available for the analysis of GxE interaction and adaptability (Lin et al., 1986; Hohls, 1995). But the prediction of adaptability of the genotypes may vary depending on the biometrical methods followed, i.e. a genotype found to be stable in one biometrical method may not be stable in other. Therefore, the integration of several biometrical approaches may give a better result than the use of a single method in predicting the adaptability and stability in yield performance. The aim of the present investigation was to analyse genotypic adaptation in rice by integrating both univariate and multivariate methods of stability analysis. MATERIALS AND METHODS Thirty six rice genotypes ( Table 1) of 3 different maturity groups 11 of mid-early (115-125), 13 mid-late (126-140) and 12 of late (145-165)group were evaluated in three multilocation trials each at 4 different agroclimatic zones of Orissa (Bhubaneswar, Chiplima, Jeypore and Ranital; Table 2), India over 3 years, during 2004-2006 in kharif (wet) season using a randomised block design with three replications. For all trials, nursery sowing was done during last week of June to the first week of July. Twenty-five to thirty days old seedlings were transplanted with 20 cm × 15 cm spacing and 2 seedlings per hill. In each trial, the plot size was 2 m × 3 m containing 10 rows of 3 m length each. The yield data of the 12 environments (4 locations x 3 years) were subjected to stability analysis following univariate methods like regression co-efficient (b) and deviation from regression (S2d) of Eberhart and Russell (1966), co-efficient of variation (CV) of Francis and Kannenberg (1978), two range parameters (R1 and R2) of Langer et al. (1979), stability factor (SF) proposed by Lewis (1954), ecovalence (W) of Wricke (1962), mean absolute rank difference (S1) of Nassar and Huhn (1987) and the multivariate method AMMI(Additive main effects and multiplicative interaction) stability value (ASV) of Purchase (1997). The models are described below. Linear regression model. Adaptability and stability of performance of genotypes for grain yield were analysed, using the linear regression model of Eberhart and Russell (1966) as follows: Yij = ai + bi Ij + dij, (i= 1, g ; j =1, n),where: Yij = mean of ith genotype in jth environment; Ij = environmental index of jth environment, i.e. jth environment mean (over all genotypes) minus the grand mean; ai = mean of ith genotype over all environments; bi = regression coefficient which measures the response of ith genotype to the varying environments; dij = deviation from regression of ith genotype at jth environment, i.e., dij = Yij . The regression coefficient `b' was estimated as:
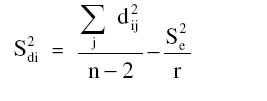
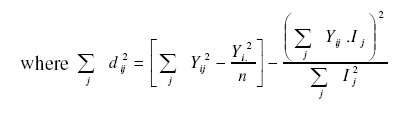
The stability parameter, measuring deviation from regression () was estimated as follows:
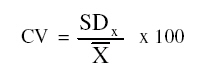
Se2 = pooled error mean square; r = number of replications; and n = number of environments. Coefficient of variation (CV). Use of coefficient of variation as a stability parameter was proposed by Francis and Kannenberg (1978). The parameter was estimated as:
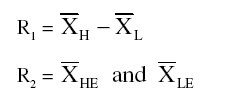
where SDx is standard deviation of the means of a genotype over environments and is the mean of the genotype over all environments. Range parameters. Two range parameters (R1 and R2) were estimated as follows, after Langer et al. (1979).
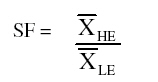
where Stability factor. Stability factor (SF) of a genotype as proposed by Lewis (1954) was estimated as:
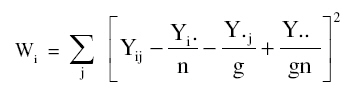
where Ecovalence (W). According to Wricke (1962) Ecovalence (Wi) of a genotype was estimated as:
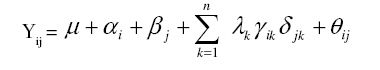
where Yij = mean of ith genotype in jth environment; Yi. = total of ith genotype over environments; Y.j. = total of jth environment over all genotypes; and Y.. = grand total. Mean absolute rank difference (S1). Mean absolute rank difference' is a stability parameter proposed by Nassar and Huhn (1987). The rank of a genotype in each environment is determined first. If there are `n' no. of environments/locations then the possible pair-wise rank difference across the environments of the genotype would be n x (n-1)/2. Then all the rank differences were added and the average is calculated to get mean absolute rank difference of the genotype. Mean absolute rank difference estimates are all possible pair-wise rank differences across locations for each genotype. Genotypes with less change in rank are expected to be more stable. AMMI stability value (ASV). The PCA scores of a genotype in the AMMI analysis are an indicator of the stability of a genotype over environments. The greater the IPCA (Interaction Principal Component Axis) scores, either negative or positive, indicated the specific adaptation of a genotype to certain environments. The more the IPCA scores approximate to zero, the more stable the genotype is over all the environments considered for the study. The mathematical function of the AMMI model following Zobel et al. (1988) is:
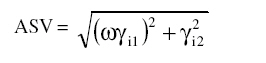
where Yij = mean yield of ith genotype in jth environment; µ = grand mean; αi = mean deviation/effect of ith genotype; βj = mean deviation/effect of jth environment; λk = eigen value of kth IPCA axis; ãik = genotypic score of ith genotype on kth IPCA; δjk = environment score of jth environment on kth IPCA, θij = residual of G × E interaction effect in Yij ; and n = number of IPC axes retained in the model. A stability parameter called AMMI stability value (ASV) was estimated for each genotype using the following formula, after Purchase (1997).
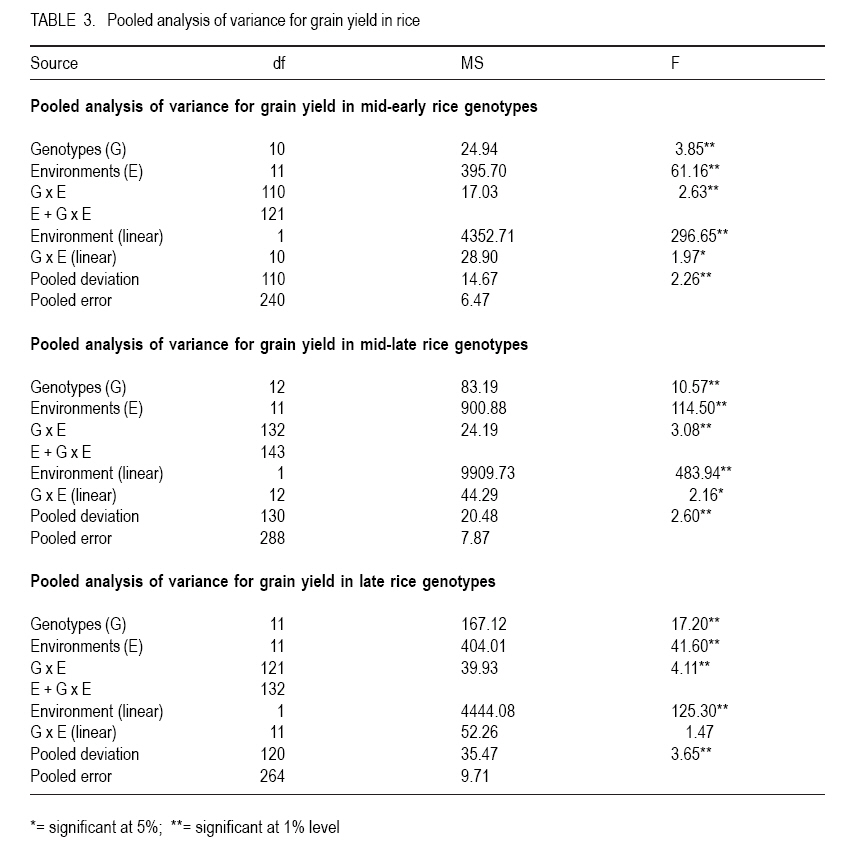
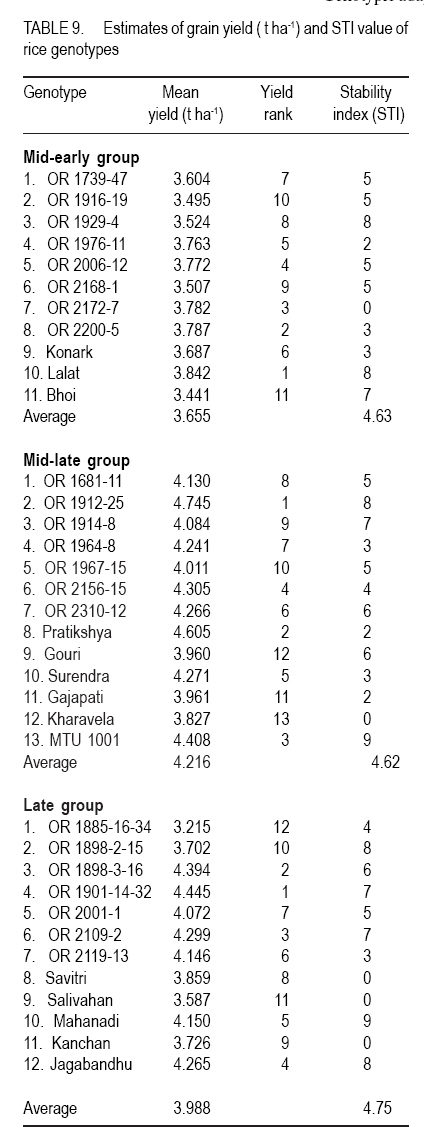
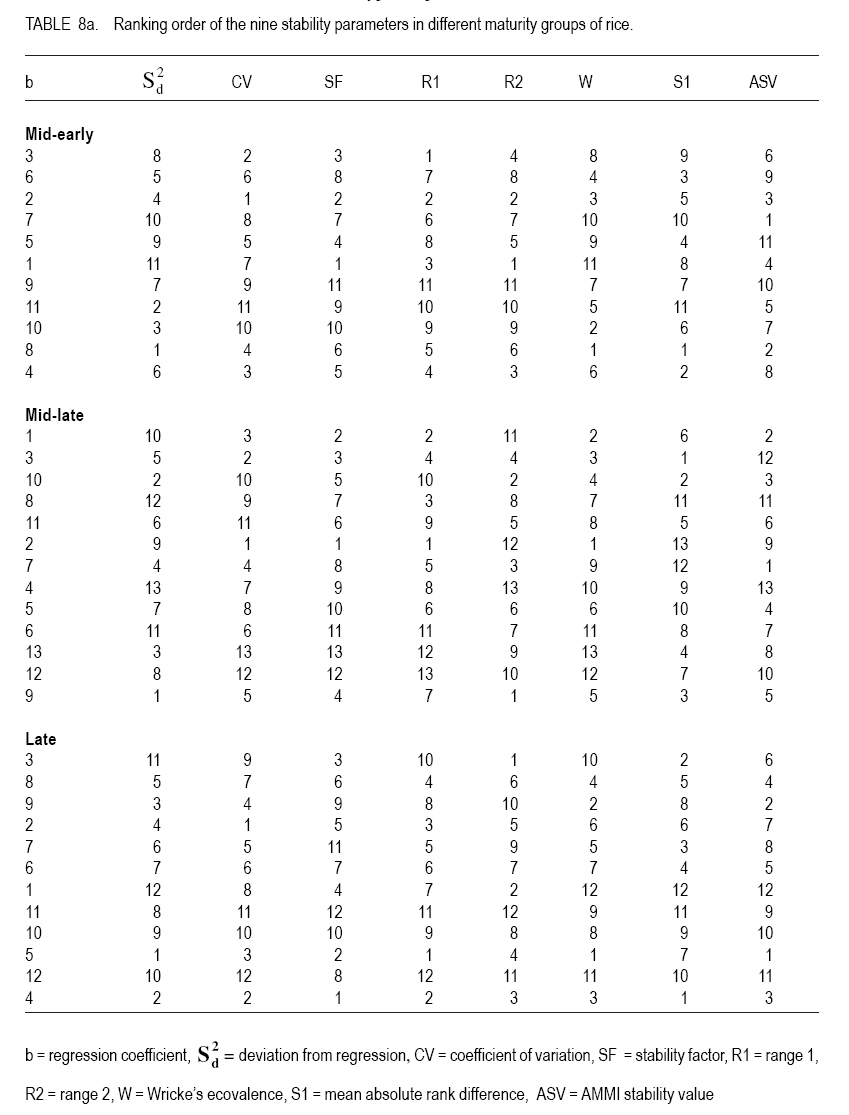
where ω = IPCA 1 SS/IPCA 2 SS (weight to IPCA 1); γi1 = IPCA 1 score of ith genotype; and γi2 = IPCA 2 score of ith genotype. Estimation of stability index (STI). Stability of performance of each genotype was expressed in terms of a stability index (STI). For estimating STI, the genotypes of each maturity group were classified into stable and unstable categories on the basis of each stability parameter as discussed above and the stable genotypes were scored 1, while unstable genotypes were scored 0. Genotypes having b values of 0.8-1.2 (b≠1) were considered stable and those having b<0.8 or >1.2 (b≠ 1) were considered unstable. Non-significant Sd2 of a genotype indicated stability and significant Sd2 indicated unstable perfor-mance. Low (below average) value in case of CV, SF, R1, R2, W, S1 and ASV indicated stability and high (above average) value indicated unstable performance. Finally, the numerical scores of a genotype on all the 9 parameters were added to get stability index (STI) of the genotype. High value of this index indicated higher stability of yield performance of the genotypes. RESULTS Analysis of variance (Table 3) of yield data of the three multilocation trials of mid-early, mid-late and late groups over 12 environments showed significant differences (P<0.05) among genotypes of each maturity group and among environments and highly significant G X E interaction indicated differential response of the genotypes to environmental changes. Regression analysis indicated that the mean sum of squares due to environment (linear) was highly significant. Mid-early group. Table 4 showed the stability parameters of Eberhart and Russell (1966). In the case of mid-early group, the regression coefficient (b) of the genotypes OR 1916-19, OR 1976-11, OR 2006-12 and Lalat was found to be unity (b = 0.8 - 1.2). Genotypes OR 2200-5, OR 2172-7 and Konark had `b' values greater than unity (b>1.2). The remaining four genotypes had b-values less than unity (b< 0.8). Sd2 of the genotypes Lalat, OR 2200-5, Konark , OR 1929-4 , OR 1916-19 and Bhoi were not significantly different from zero. Genotypes showing below average value for CV, SF, R1, R2, W and S1 (Table 5) ranked in the stable category, while those having above average value were classified as unstable. There were 7, 6, 5, 5, 6, and 6 genotypes showed stability on the basis of CV, SF, R1, R2 W and S1 parameters, respectively. The AMMI analysis of variance showed that both main effect components, i.e. genotype and location and interaction component were significant (Table 6). The main effects of genotypes and locations accounted for 8.43% and 80.86%, respectively; and G´L interaction accounted for 10.71% of the total variation in G-L data for grain yield. Table 7 indicated the AMMI 2 model IPCA 1 and IPCA 2 scores and the ASV with its ranking for the mid-early genotypes. According to ASV ranking, the most stable genotypes were OR 1976-11, Lalat, OR 1929-4, OR 2168-1, OR 2200-5 and OR 1739-47. This clearly indicated that genotype found to be stable on the basis of one method may not be stable on the basis of another method(s). The rank correlation coefficient study among the nine stability parameters (Table 8b) revealed that b had positive significant correlation with CV, SF, R1 and R2 and negative correlation with and W. But Sd2 showed negative correlation with CV, SF, R1 and R2 and positive significant correlation with W. Both S1 and ASV had no significant correlation with any other stability parameters. So to predict stability in yield performance of a genotype all the 9 stability parameters were considered together, by scoring the genotypes in a 0-1 scale for each parameter. The STI values ranged from 0 to 8 (Table 9) in mid-early group. The genotypes OR 1739-47, OR 1929-4, OR 2168-1, OR 1916-19, OR 2006-12, Lalat and Bhoi scored high STI value (> 4.63) and were considered as stable irrespective of their yield performance. In mid-early group, the genotypes Lalat, OR 2200-5, OR 2172-7, OR 2006-12, OR 1976-11 and Konark gave above average yield (Table 9) and considered as high yielder. The two high yielding genotypes, i.e., Lalat and OR 2006-12 having high STI value indicated their wider adaptability over all environments. The genotype OR 2172-7 having high yield and STI of 0 indicated that it was highly unstable. Mid-late group. The regression coefficient (b-values) of the genotypes varied from 0.59 to 1.49. Nine genotypes had unity b-values. On the basis of Sd2 values (Table 4), the genotypes OR 1912-25, OR 1914-8, OR 2310-12, Gajapati and MTU 1001 were classified as stable ( 0). The remaining 8 genotypes showed high deviation from regression (Sd2 > 0). On the basis of CV, SF, R1, R2, W and S1 values 8, 6, 7, 6, 7 and 5 genotypes respectively, were found to be stable and the rest unstable. The AMMI analysis of variance showed that both main effect components, i.e., genotype and location and G × E interaction component were significant (Table 6). Based on ASV ranking, the genotypes OR 2310-12, OR 1681-11, OR 1914-8, Gouri, MTU 1001, OR 1967-15 and Surendra were found to be stable (Table 7). The rank correlation coefficient study among the nine stability parameters (Table 8b) showed that b had positive significant correlation with CV, SF, R1 and W and negative correlation with the rest four parameters.The Sd2 showed positive significant correlation with R2 and S1. The W exhibited positive significant correlation with b, CV, SF and R1. But the multivariate statistics ASV did not show significant correlation with the univariate stability parameters.Based on STI values (Table 9), the genotypes were identified as stable and unstable irrespective of their yield level. The genotypes OR 1912-25, OR 2310-12 and MTU 1001 with high yield and high STI value were considered as widely adapted genotypes and they were agronomically superior. Late group. The regression coefficient (b-values) of the late group genotypes ranged from 0.39 to 1.64 (Table 4). Five genotypes showed unit regression (b = 0.8-1.2). Based on Sd2 values, four genotypes were found to be stable and rest eight were unstable. There were 7, 7, 7, 6, 7 and 8 genotypes had below average values for the parameters CV, SF, R1, R2, W and S1(Table 5), respectively and were considered as stable (Table 5). The AMMI analysis of variance showed that genotype (G), location (L) and G´L interaction components were significant at 1% level. The multivariate stability statistics ASV indicated that the genotypes Mahanadi, OR 1898-3-16, Jagabandhu, OR 1898-2-15, OR 2109-2 and OR 1885-16-34 were stable. The rank and rank correlation coefficient study among the nine stability parameters (Table 8a and 8b) showed that b had positive significant correlation with CV, SF and R2 and limited correspondence with the rest five parameters. The Wricke's procedure of stability statistics exhibited positive significant correlation with Sd2 , CV, and R1. The multivariate statistics ASV showed significant positive correlation with Sd2, CV, R1 and W. But S1 did not show significant correlation with any other stability parameter. Stability index in late group (Table 9) revealed that genotypes OR 1898-2-15, OR 1898-3-16, OR 1901-14-32, OR 2109-2, OR 2001-1, Mahanadi and Jagabandhu with above average STI value (>4.75) had reflected consistency in their yield performance. High mean yield along with high STI value for the genotypes OR 1898-3-16, OR 1901-14-32, OR 2109-2, OR 2001-1, Mahanadi and Jagabandhu indicated their general adaptation. The high yielding genotype Mahanadi was found to be stable for each of the 9 parameters and considered as unique as compared to other high yielding genotypes. DISCUSSION The present study clearly showed that genotypes of mid-early, mid-late and late group differed greatly in their yield stability for each of the univariate and multivariate stability parameters (Tables 4, 5 and 7.). According to authors knowledge integration of both the univariate and multivariate methods to assess adaptability is very scanty. Mahapatra (1993) estimated adaptability of 12 rice varieties by integrating eight univariate methods along with mean yield. In mid-early group the number of stable genotypes is highest (7) according to CV and least (4) on the basis of b value. In the mid-late group, the number of stable genotypes is highest (9) according to b value and lowest (5) on the basis of Sd2 and S1value. In the late group, highest (8) number of stable genotypes is observed according to S1 parameter and least (4) on the basis of Sd2 value. The rank correlation coefficient in the present investigation indicated that the stability statistics showed variation in their degree of correlation and were not the same for all the maturity groups. In the mid-early group W showed positive significant correlation with Sd2 but not with other stability statistics. However, S1 and ASV did not have positive significant correlation with other stability parameters. In the mid-late group, W showed a positive significant correlation with b, CV, SF and R1; S1 showed positive significant correlation only with Sd2 and ASV had at all no significant correlation with any other stability parameters. In late group, the highest positive significant correlation was observed between W and Sd2 and ASV showed significant positive correlation with Sd2 , CV, R2 and W. Therefore, we integrate different stability parameters to predict genotypic adaptation in rice. According to STI estimate seven genotype from each maturity group are found to be stable. The high yielding genotypes MTU 1001 of mid-late group and Mahanadi of late group are stable for each of the stability parameters and it may be supposed due to the involvement of multiple genes in controlling sensitivity to environmental changes.The present study suggests that integration of several approaches of stability analysis is better than the use of a single approach in predicting genotypic adaptation. CONCLUSIONIntegration of univariate and multivariate approaches in the present study indicate that the mid-early group genotypes Lalat and OR 2006-12, the mid-late group genotypes OR 1912-25, OR 2310-12 and MTU 1001 and the late group genotypes OR 1898-3-16, OR 1901-14-32, OR 2109-2, OR 2001-1, Mahanadi and Jagabandhu have wide adaptability. ACKNOWLEDGEMENT The authors acknowledge the Department of Plant breeding and Genetics, OUAT, Bhubaneswar for providing facilities to conduct the research work. REFERENCES
Copyright 2011 - African Crop Science Journal The following images related to this document are available:Photo images[cs11002t8a.jpg] [cs11002t2.jpg] [cs11002t6.jpg] [cs11002t3.jpg] [cs11002t1.jpg] [cs11002t9.jpg] [cs11002t8b.jpg] [cs11002t7.jpg] [cs11002t4.jpg] [cs11002t5.jpg] |
| |||||||||
