 |
| About Bioline | All Journals | Testimonials | Membership | News |
|
||||||
|
||||||
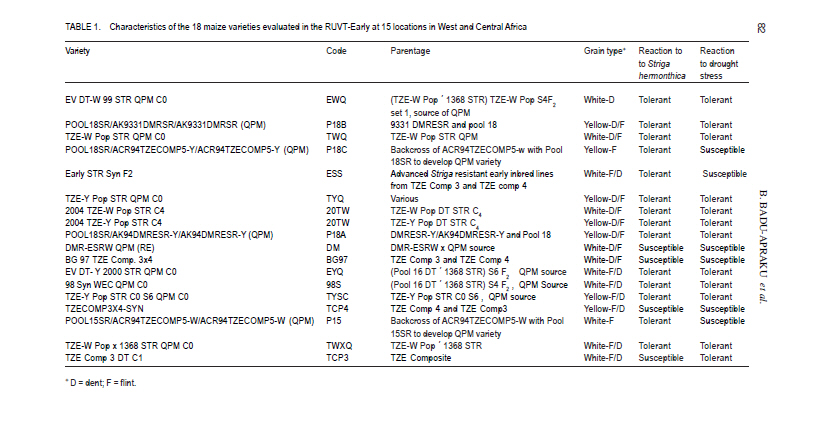
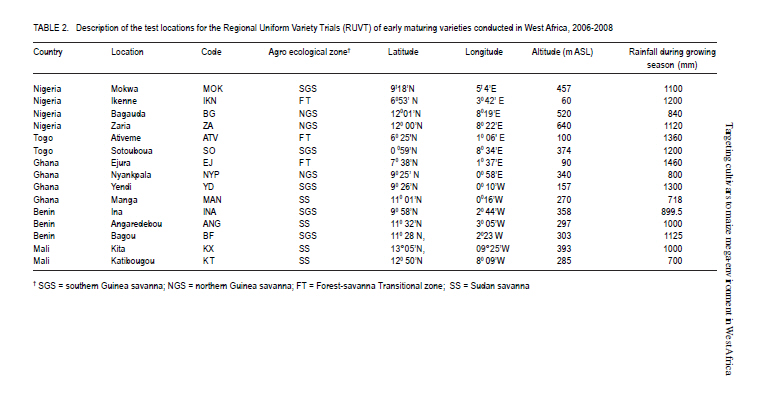
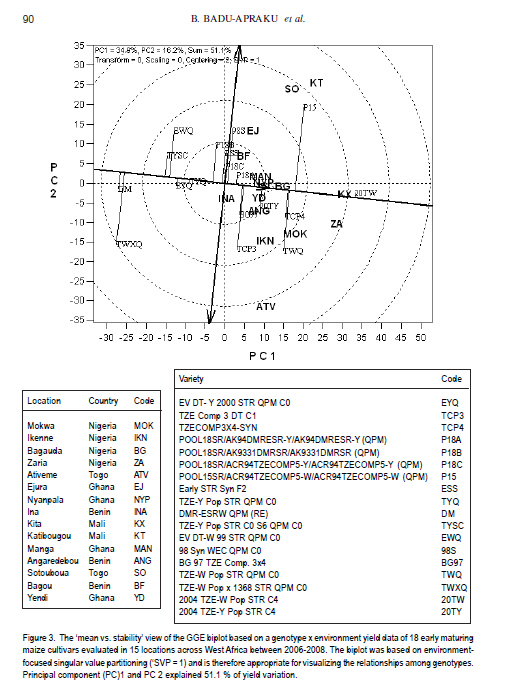
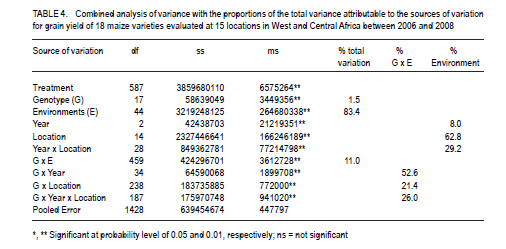
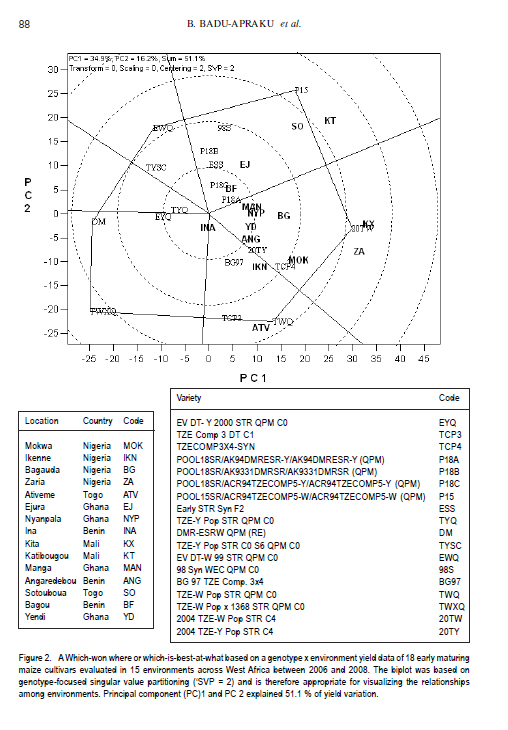
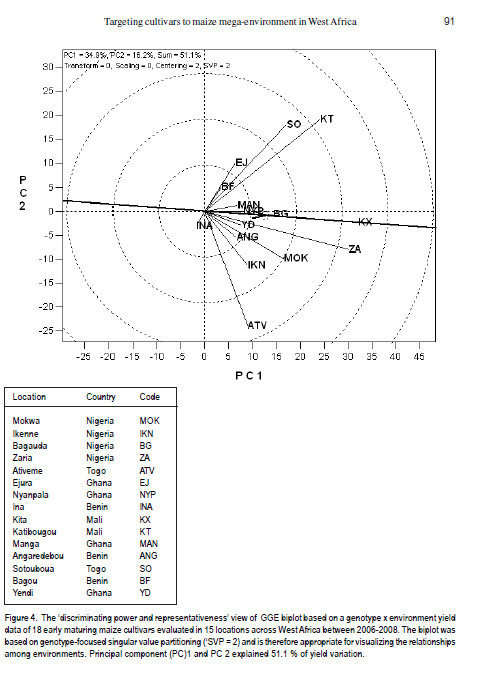
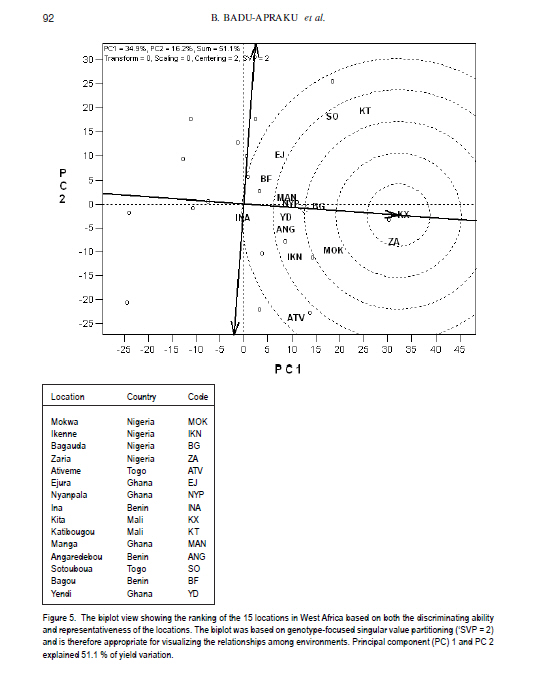
African Crop Science Journal, Vol. 19, No. 2, pp. 79 - 96 Use of GGE Biplot for Targeting Early Maturing Maize Cultivars to Mega-environmentS in West Africa B. Badu-Apraku, R.O. Akinwale, A. Menkir, K. Obeng-Antwi1, A.S. Osuman1,N. Coulibaly2, J.E. Onyibe3, G. C. Yallou4, M.S. Abdullai5 and A. Didjera6 International Institute of Tropical Agriculture (UK) Limited, Carolyn House, 26 Dingwall Road, Croydon, CR9 3EE, UK 1Crops Research Institute, Kumasi, Ghana, (Received 16 November, 2010; accepted 23 March, 2011) Code Number: cs11008 ABSTRACT Maize (Zea mays L.) is an important staple food consumed by people with varying food preferences and socio-economic backgrounds in West Africa (WA). Genotype by environment interactions (G×E) exist in WA implying the need for extensive testing of cultivars in multiple environments over years before cultivar realistic recommendations can be made. This study examined the effect of G×E on the performance and stability of early cultivars and to identify core test locations in the mega-environments of WA. Across locations, 2004 TZE-W Pop STR C4 produced the highest grain yield and was the most stable cultivar. DMR-ESRW QPM produced the lowest yield. The test environments contributed about 83.4% of the total variation in grain yield, while genotypes accounted for 1.5% and G × E, 11%. Test environments were classified into four mega-environments, namely, Katibougou, Sotouboua, Ejura, and Bagou as the first group; the second group consisted of Manga, Nyankpala, Bagauda, Yendi, Angaredebou, Mokwa, Katibougou, and Zaria; while the third group comprise of Ativeme, and Ikenne; and the fourth, Ina. Test locations Ejura, Sotouboua and Bagou and Katibougou were highly correlated in their ranking of the genotypes in group 1, suggesting that a promising early maturing cultivar selected in one of these locations in one country will also be suitable for production in the other locations within the same mega-environments in different countries. Kita was identified as the ideal location, while Zaria was close to the ideal location. Key Words: Genotypes, multiple environment, Zea mays RÉSUMÉ Le maïs (Zea mays L.) est une nourriture principale consommé par des personnes à préférence alimentaires et un passé socio-économique variés en Afrique de l'Ouest. Une interaction Génotype et Environnement (G×E) était trouvée, impliquant ainsi le besoin en test extensive des cultivars sur plusieurs années avant toute recommandation. Le but de cette étude était d'examiner l'effet G×E sur la performance et la stabilité des cultivars précoces, ainsi que d'identifier le test principal de milieu dans les méga-environnements de l'Afrique de l'Ouest. A travers les milieux, 2004 TZE-W Pop STR C4 avait produit le rendement en grain le plus élevé et était le cultivar le plus stable. DMR-ESRW QPM avait induit le rendement le moins élevé. La contribution du test d'environnements était d'environ 83.4% de la variation totale du rendement en grain, pendant que les génotypes et G × E présentaient 1.5% et 11%, respectivement. Les tests d'environnements étaient classifiés en quatre méga-environnements à savoir, Katibougou, Sotouboua, Ejura, and Bagou comme premier groupe; Manga, Nyankpala, Bagauda, Yendi, Angaredebou, Mokwa, Katibougou, and Zaria comme deuxième groupe, alors que le troisième groupe comprenait Ativeme, et Ikenne et le quatrième, Ina. Le test de milieux Ejura, Sotouboua, Bagou et Katibougou étaitent hautement corrélé sur le plan ranking des génotypes au sein du groupe 1, suggérant qu'un cultivar précoce promettant sélectionné dans un de ces milieux dans un pays sera approprié pour la production dans d'autres milieux au sein des mêmes méga-envoronnements dans différents pays. Kita était identifié comme un milieu ideal, alors que Zaria était proche du milieu ideal. Mots Clés: Génotypes, environment multiple, Zea mays Introduction Maize is an important staple food in West and Central Africa (WCA), accounting for about 15% of the total calorific intake of the rural communities (Badu-Apraku et al., 2011). It is grown in highly heterogeneous environments (Menkir, 2003) and is consumed by people with varying food preferences and socio-economic backgrounds (Badu-Apraku et al., 2006). To meet these demands, maize breeders at the International Institute of Tropical Agriculture (IITA) work in partnership with national programmes in West Africa (WA) to develop maize varieties adapted to the different agro-ecological zones and farming systems of WCA. The diverse maize growing areas are plagued by high incidence of diseases, insect pests and parasitic plants, especially Striga hermonthica, recurrent drought and low soil fertility. The multi-environment trials (METs) have demonstrated the existence of G × E (Fakorede and Adeyemo, 1986; Badu-Apraku et al., 1995; 2003; 2007; 2008) and have justified extensive testing of cultivars in multiple environments over several years to aid decisions on cultivar recommendations. Often, however, national maize research programmes of WCA are compelled to conduct cultivar evaluation in a few locations owing to resource limitation which sometimes limit the application of their results. From the results of Yan et al. (2007), it is important to properly examine environments for uniqueness and for information that would enable the separation and ranking of genotypes. This allows stratification and identification of core locations where testing of cultivars can be done without losing valuable information about genotypes. Furthermore, stratification of maize evaluation environments can help increase heritability of measured traits, accelerate the rate of gain from selection, strengthen the potential competitiveness for seed production and maximise grain yields for farmers (Gauch and Zobel, 1997). It is, therefore, important to improve our understanding of the agro-ecosystems of WCA and determine if it could be subdivided into different mega-environments to facilitate a more meaningful cultivar evaluation and recommendation. The result of such a study would simplify the selection of locations for METs that would permit inclusion of sample of environments that adequately cover the range of environmental conditions of the target geographical region. Gauch and Zobel (1996, 1997) defined a mega-environment as a portion of a crop species' growing region with a homogenous environment in which some genotypes perform similarly. They used the maize MET dataset for identification of maize mega-environments. Menkir (2003) used Geographic Information System (GIS) to analyse long-term data collected on seven climatic variables relevant to maize production to refine the stratification of the sub-region into well-defined agro ecological zones. GIS separated the locations into four distinct zones, namely, mid-altitude, rainforest, moist savannah, and dry savannah. Setimela et al. (2007) used the maize MET data set of CIMMYT and agro-climatic data to identify maize mega-environments for sub-Saharan Africa including WCA. The WCA sub-region was stratified into four distinct groups viz. dry savannah, wet savannah, dry mid-altitude and wet mid-altitude. The GGE biplot graphically displays genotype main effect plus G×E of a MET in a way that facilitates visual evaluation of cultivars and mega-environment identification (Yan et al. 2000). Badu-Apraku et al. (2008) and Badu-Apraku and Lum (2010) used the GGE biplot analysis to decompose the G×E in WCA and to obtain information on the early maturing maize cultivars that were suitable for Striga-infested and Striga-free environments and to investigate stability of cultivars in the various environments. However, GGE biplot has not been used to define core test locations for early maturing maize germplasm in maize variety evaluations in WA. Furthermore, the signing of the protocol on seed by the Heads of States of the Economic Community of West Africa (ECOWAS) member countries in 2009, and the availability of the West African Catalogue of Plant Species and Varieties (COAFEV), offer a unique opportunity for movement of good quality seed of improved maize varieties and hybrids across borders of the ECOWAS countries for production and marketing. Presently, a variety released in any ECOWAS member country does not need to be released again in other member countries within the sub-region. This new development in the seed sectors of the ECOWAS member countries calls for the identification of core testing locations in each of the current mega-environments in WA to facilitate the selection of high yielding and stable cultivars for seed production and marketing across the member countries of ECOWAS. The seed catalogue which contains the list of varieties whose seeds can be produced and commercialised within the territories of the 17 member countries is an aggregate of the varieties registered in the national catalogues of the Member States. The objective of this research was to use the dataset of the RUVT-Early and the GGE biplot technique to summarise the effects of G and G×E in early maturing maize cultivars, and identify core test locations in each mega-environment in WA. Materials and Methods Regional uniform variety trials - early. The regional early variety trials have since 1987 been organised by the West and Central Africa Collaborative Maize Research Network (WECAMAN) and IITA in collaboration with the National Agricultural Research Systems (NARS) of WCA. The trials serve as the vehicle for systematically and extensively testing and disseminating elite early maize cultivars across WCA. Both the National Agricultural Research Systems (NARS) and IITA nominate their best cultivars for evaluation in the trials. Eighteen elite early maturing maize cultivars, comprising six normal endosperm and twelve Quality Protein Maize (QPM) cultivars (Table 1) were evaluated between 2006 and 2008 in the Regional Uniform Variety Trials - Early (RUVT-Early) at 15 sites representing the dry savanna, moist savanna and forest/savanna transition zones of WA (Table 2, Fig. 1). A QPM cultivar, DMR-ESRW QPM was included as the reference check in the trials at all sites. A standard protocol was adopted at each site. The evaluations were conducted under rain-fed conditions in all locations. Trials were planted when rains at each test site had started. A randomised complete block design with four replications was used in the evaluations. Each plot consisted of 4 rows, each 5-m long, spaced 0.75 m apart with 0.40 m spacing between plants within the row. Three seeds were sown per hill and later thinned to two plants per stand to obtain a final population density of 66,666 plants per hectare. To optimise crop performance at each site, fertiliser application and pest control were carried out based on the recommendations for the respective sites in each country. Collection of agronomic data. Observations were recorded on the two centre rows of each plot for days to 50% silking, number of ears per plant (EPP), plant and ear heights and root lodging (% plants leaning more than 300 from vertical). Others included stalk lodging (broken at or below highest ear node), ear aspect, number of plants harvested, number of ears harvested and per cent moisture in the grain.. Days to anthesis (DA) and days to silking (DS) were computed as the number of days from planting to when 50% of the plants had shed pollen and had emerged silks, respectively. Anthesis-silking interval (ASI) was determined as the difference between 50% silking and anthesis. Plant and ear heights were measured as the distance from the base of the plant to the height of the first tassel branch and the node bearing the upper ear, respectively. Root lodging (percentage of plants leaning more than 300 from the vertical), stalk lodging (percentage of plants broken at or below the highest ear node), and disease reaction, were also recorded. Husk cover was rated on a scale of 1 to 5, where 1= husk tightly arranged and extended beyond the ear tip and 5 = ear tips exposed. Plant aspect was scored on a scale of 1 to 5, where 1 = excellent plant type and 5 = poor plant type. Ear aspect was based on a scale of 1 to 5, where 1 = clean, uniform, large, and well-filled ears and 5 =ears with undesirable features. Data on maydis leaf blight, (Bipolaris maydis) was recorded between 2-4 week period after 50% silking. About 10 plants were scored in the central part of the plot using a 1-5 rating scale where: 1 = slight infection Very few lesions on leaves, usually only on the lower leaves of the plant. 2 = light infection Few to moderate lesions on leaves below top ear, no lesions on leaves above the top ear. 3 = moderate infection Moderate to large number of lesions on leaves below top ear, few lesions on leaves above the top ear. 4 = heavy infection Large number of lesions on leaves below top ear, moderate to large number of lesions on leaves above the top ear. 5 = very heavy infection All leaves with large number of lesions leading to premature death of the plant and light ears Also, data were recorded on rust, Puccinia polysora, or Puccinia sorghi within 2-4 week period after 50% silking using a scale of 1-5 or 1-9 where 1=no rust and 5 or 9= severe rust. Number of ears per plant (EPP) was obtained by dividing the total number of ears per plot by the number of plants harvested. Grain yield was calculated based on 80% (800 g grain kg-1 ear weight) shelling percentage and adjusted to 150 g kg-1 moisture content. Even though data were collected on several traits, only those on the most important traits in the studies are presented in the results. Statistical analysis. Analyses of variance (ANOVA), combined across environments were performed on plot means for grain yield, DS, ASI, EPP, plant height, plant and ear aspects, percentage stalk lodging, husk cover with PROC GLM in SAS using a RANDOM statement with the TEST option (SAS Institute, 2002). In the combined ANOVA, the year, location, G x E interaction and replicates were considered as random factors, while entries were considered as fixed effects. Means were separated using the LSD at P<0.05. ANOVA was done for each site and across sites and years. Data relating to scores and counts were natural logarithm-transformed before the analyses of variance. Subsequently, the data on grain yield were subjected to GGE biplot analysis to decompose the G x E interactions. The GGE biplots were constructed using the first two principal components (PC1 and PC2) that were derived from subjecting environment-centred grain yield means for each location (averaged over years) to singular value decomposition. The data were not transformed (`Transform=0'), not standardised (`Scale=0), and were environment-centred (Centering=2'). This provided information on the cultivars that were suitable for the different environments, investigation of stability of cultivars in the various environments and identification of the mega-environments. The analyses were done using GGE biplot, a Windows that fully automates biplot analysis (Yan, 2001). The programme is available at www.ggebiplot.com (verified 1 December 2009). The GGE biplot Model 3 equation used is as follows: Yij - Yj = λ1ζi1ηj1 +λ2ζi2hj2 + εij Where: Yj is the average yield across all genotypes in environment j; λ 1 and λ 2 are the singular values for PC1 and PC2, respectively; ζ i1 and ζ i2 are the PC1 and PC2 scores, respectively, for genotype i; η j1 and η j2 are the PC1 and PC2 scores, respectively, for environment j; and ε ij is the residual of the model associated with the genotype i in environment j. The decision as to whether each group of locations could be considered as representative of a mega-environment was based on the similarity of grouping of winning genotypes across years (Yan et al., 2000; 2007). RESULTS AND DISCUSSION Field performance of early maturing maize cultivars. Combined analysis across sites and locations for the nineteen genotypes in the RUVT - early revealed that genotypes, environments and Genotype x year interaction (G × E) were significantly (P<0.05) different for all traits measured except EPP, plant height, ear height, plant aspect, ear aspect and husk cover for which the G × E was not significant (Table 2).The test environments contributed about 83.4% of the total variation in grain yield; while the genotypes accounted for about 1.5%, and G x E sources of variation, about 11% (Table 3). The contribution of locations to the environmental variation was nearly eight times that of years and about double the contribution of the interaction of years with locations to the environmental variation. G × year interaction accounted for more than half of the G x E sum of squares. Grain yield across the environments ranged from 2835 kg ha-1 for the reference QPM cultivar, DMRE-SR-W QPM, to 3563 kg ha-1 for the drought tolerant and Striga resistant cultivar, 2004 TZE-W Pop STR C4. However, there were no significant (P>0.05) differences in grain yield among the five top ranking cultivars. It is striking to note that the QPM cultivar, TZE-W Pop STR QPM C0, was comparable in grain yield to 2004 TZE-W Pop STR C4, both of which were derived from the same source population, TZE-W Pop DT STR C4. This indicates that QPM cultivars with comparable performance to the normal endosperm type are available in our programme. Similar findings were reported by Badu-Apraku and Lum (2010). The highly significant cultivar × environment interaction for grain yield and most measured traits justified the use of the GGE biplot to decompose the cultivar × environment interactions to determine the yield potential and stability of the early cultivars and to investigate the best core test locations in the various mega-environments in WA using the GGE biplot tool (Yan et al., 2000; 2005; 2010; Yan, 2001 ; Setimela et al., 2007 ) and adopting the cultivar and environment codes listed in all Figures and Tables. GGE biplot analysis of grain yield response and stability of early cultivars. The principal component (PC) axis 1 explained 34.9% of total variation; while PC2 explained 16.2% and, thus these two axes accounted for 51.1% of the total variation for grain yield (Fig. 1). These results suggest that the biplot of PC1 and PC2 adequately approximated the environment-centred data. The GGE biplot for grain yield of the 18 early-maturing maize cultivars evaluated at fifteen locations across WA from 2006 to 2008 is shown in Figures 1 and 2. According to Yan (2001) and Yan et al. (2000; 2005; 2010), in the polygon view (Fig. 2), the vertex cultivar in each sector represents the highest yielding cultivar in the location that falls within that particular sector. Based on this information, P15 was the highest yielding cultivar at EJ, BF, SO and KT; 20TW was top-ranking at KX, ZA, MOK, BG, MAN, NYP, YD, ANG; TWQ was the vertex cultivar at ATV and IKN; TWXQ and DM were the winning cultivars at INA. The vertex cultivar, EWQ was the lowest-yielding cultivar at all or some locations. Furthermore, no environments fell into the sector with EWQ, indicating that this cultivar was not the best in any of the environments. This also implies that it was the poorest cultivar in some or all of the environments. Cultivars within the polygon, particularly those located near TYQ were less responsive than the vertex cultivars. In the entry/tester view of the GGE biplot of grain yield for the 18 early maturing cultivars (Fig. 3), the genotypes were ranked along the average-tester axis (ATC abscissa), with an arrow pointing to a greater value based on their mean performance across all environments. The double-arrowed line separates entries with below-average means from those with above-average means. The average yield of the cultivars is approximated by the projections of their markers on the average-tester axis. The stability of the cultivars is measured by their projection onto the double-arrow line (average-tester coordinate [ATC] y axis). The greater the absolute length of the projection of a cultivar, the less stable it is (Yan et al., 2000; 2005; 2010; Yan, 2001). Thus, 20TW was the highest yielding and most stable cultivar, while DM was the lowest yielding but very stable cultivar. The cultivars P15, TCP3 and TWQ were high yielding, but were the most unstable; while TWXQ was not only low yielding but also one of the least-stable cultivars. Figure 4 shows location groupings with similar rankings of the early maturing maize varieties as follows: KT, SO, EJ, and BF constitute the first group; the second group consists of MAN, NYP, BG, and KX; the third group contains YD, ANG, MOK, and ZA; the fourth group comprise ATV, IKN, with INA isolated from all the other locations. Discriminating power and representa-tiveness of the test environments. In the present study, test environments were classified into four mega-environments based on the method of Yan et al. (2007), who proposed that test locations should be classified into three types. They indicated that the first group are locations with low genotype discrimination that should not be selected as test locations. The second group are locations with high genotype discrimination and representative of the mega-environments that are close to ideal and should be chosen for superior genotype selection. The third group are locations with high genotype discrimination that do not represent the mega-environment, which could be used for unstable genotype evaluation. The discriminating power of an environment refers to the ability of an environment to identify an ideal test environment, while the representativeness refers to the ability of a test location to represent the mega-environment. The discriminating power versus representativeness view of GGE biplot analysis of the results of the test locations are presented in Figure 5. The small circle is the average-environment axis (AEA), and the arrow pointing to it is used to indicate the direction of the AEA (Yan and Tinker, 2005). Test environments that have small angles with AEA are more representative of the mega-environment than those that have large angles with it. This implies that the cosine of the angle between any environment vector and the AEA approximates the correlation coefficient between the genotype values in that environment and the genotype means across the environments (Yan et al., 2007). The environments that have shorter vectors are less informative compared to those with longer vectors and provide little or no information about the genotypes and could therefore be excluded when choosing test environments. Furthermore, shorter environ-mental vectors indicate that the specific environments were not strongly correlated with environments with longer vectors and that they were probably not strongly correlated with one another either. Thus, the short-vector environments BF, MAN, NYP, YD, ANG, and INA may be regarded as independent research environments and may be treated as unique and, therefore, essential research environments. On the other hand, the long-vector research environments EJ, SO, KT, KX, ZA, MOK, IKN, and ATV were more powerful in discriminating among the cultivars. The environments which have long vectors and small angles with the AEC abscissa are ideal for selecting superior genotypes. Furthermore, test environments with long vectors and large angles with the AEC abscissa may not be used for selecting superior genotypes, but are useful in culling unstable genotypes (Yan et al., 2007, 2010). Based on the above information, environ-ments BF, MAN, NYP, BG, YD, ANG, and NYP were highly correlated in their ranking of the genotypes, implying that these environments provided similar information about the genotypes. KT and ATV had long vectors and large angles with the AEC abscissa indicating that they may not be used in selecting superior genotypes, but may be used in culling unstable genotypes. KX and ZA had the longest vector lengths and small angles with the AEC abscissa and were, therefore, the most discriminating and representative test environments. KT and KX were located in the dry savanna, while ZA was in the moist savanna, which is characterised by moderately high rainfall (1100 mm of rainfall) and are moderately prone to risk of drought stress. The second group of locations were SO, MOK and ATV, which are in the Southern Guinea savanna. The third group comprised of IKN, BG, and EJ, which are in the forest savanna transition zone except Bagauda which is in the dry savanna; and the fourth group comprising INA, ANG, YD, NYP, MAN and BF in the dry savanna (Sudan savanna). The classification of Bagauda into the forest-savanna transition zone is not surprising since this location was characterised by excessive rainfall and waterlogging in 2008 and 2009 (Table 2). Similarly, NYP and YD, moist savanna sites, were grouped into the dry savanna agroecology due to low precipitation during the study period as shown in Table 2. On the basis of representativeness, the locations EJ, SO and BF and KT were highly correlated in their ranking of the genotypes in Group 1, confirming that these locations produced similar information about the genotypes. The implication is that a promising early maturing cultivar selected in one of these locations in one country will also be suitable for production in the other locations within the environments in different countries. Similarly, MAN, NYP, BG, YD, ANG, MOK, KX, and ZA were highly correlated in their ranking of the genotypes in Group 2 and, therefore, a promising cultivar in one location will likely be adapted to the other locations. Selecting a cultivar out of these two locations, will likely result in varieties adapted to IKN and other locations within the same mega-environment. ATV and IKN were highly correlated in their rankings of the genotypes and, thus, were grouped into the same mega-environment. INA stood alone in its ranking of the genotypes. Its correlations with other locations were either weak or negative, indicating its uniqueness in the ranking of the genotypes. An ideal test location should effectively discriminate genotypes and represent their mega-environment (Yan and Rajan, 2002). The biplot display in Figure 4 identified KX as the ideal location in WA, while ZA was close to the ideal. The other locations were ranked on the basis of their discriminating power and representativeness in the following order: MOK, BG, IKN, ANG, YD, NYP, MAN, KT, SO, EJ, BF, ATV and INA. It is striking that KX, a dry savanna site in Mali was identified as the ideal location in this study. This could be attributed to the moderately high rainfall (1000 mm) at this location during the study period. The identification of Zaria as the closest to the ideal environment is not surprising and confirms our long time observation that it is an excellent location for testing for genotypes with high yield potential. The four mega-environments stratified in this study do not correspond closely to the maize agroecological zones identified by maize breeders (Efron, 1985; Fajemisin et al., 1985; Menkir et al., 2003; Setimela et al., 2007) (Fig. 1). For example, in the present study, the locations Katibougou, Sotouboua, Ejura, and Bagou were classified into one mega-environment. According to the classification of Figure 1, only Katibougou and Bagou represent the dry savanna, while Ejura and Sotouboua belong to the forest-savanna and the moist savanna, respectively. The second mega-environment was represented by Manga, Nyankpala, Bagauda, Yendi, Angaredebou, Mokwa, Kita and Zaria. According to the classification in Figure 1, Yendi, Zaria, Mokwa, and Nyankpala are in the moist savanna; while Manga, Bagauda, Angaredebou and Kita are classified into the dry savanna. The third mega-environment which comprised of Ativeme and Ikenne represent the forest-savanna transition zone; while Ina, which constituted the fourth mega-environment represent the moist savanna Fig. 1). The fewer locations sampled and the fact that there was no location in the mid-altitude agroecology included in our study might have accounted for the differences in the results of our study and those of earlier researchers. CONCLUSION The results of this study show that G x E influences the ranking of the genotypes in different environments with some locations better for genotype evaluations than others. 2004 TZE-W, Pop STR C4 is the highest yielding and most stable cultivar while DMR-ESRW QPM is the lowest yielding but very stable cultivar. The cultivars POOL15SR/ACR94TZECOMP5-W/ACR94TZECOMP5-W (QPM), TZE Comp 3 DT C1, and TZE-W Pop STR QPM C0 are high yielding, but the most unstable. TZE-W Pop x 1368 STR QPM C0 is not only low yielding but also one of the least-stable cultivars. Test environments are divided into four mega-environments as follows: Katibougou, Sotouboua, Ejura, and Bagou constitute the first group, the second group consists of Manga, Nyankpala, Bagauda, Yendi, Angaredebou, Mokwa, Katibougou, and Zaria; while the third group comprises of Ativeme, Ikenne, and the fourth, Ina. On the basis of representativeness, the locations Ejura, Sotouboua, Bagou, and Katibougou are highly correlated in their ranking of the genotypes in group 1, confirming that these locations produce similar information about the genotypes and that a promising early maturing cultivar selected in one of these locations in one country will also be suitable for production in the other locations within the same mega-environments in different countries. Similarly, Manga, Nyankpala, Bagauda, Yendi, Angaredebou, Mokwa, Katibougou and Zaria are highly correlated in their ranking of the genotypes in group 2 and therefore, a promising cultivar identified in one location will likely be adapted to the other locations. Selecting a cultivar out of these two locations will likely result in varieties adapted to Ikenne and other locations within the same mega-environment. ACKNOWLEDGMENT Financial support of United States Agency for International Development (USAID) and the Drought Tolerant Maize for Africa (DTMA) Project for this study is gratefully acknowledged. The authors are also grateful to the staff of the IITA Maize Programme for technical assistance. REFERENCES
Copyright ©2011, African Crop Science Society The following images related to this document are available:Photo images[cs11008t2.jpg] [cs11008f4.jpg] [cs11008f3.jpg] [cs11008t4.jpg] [cs11008f1.jpg] [cs11008t1.jpg] [cs11008t3.jpg] [cs11008f2.jpg] [cs11008f5.jpg] |
| |||||||||
