 |
| About Bioline | All Journals | Testimonials | Membership | News |
|
||||||
|
||||||
African Crop Science Journal, Vol. 19, No. 2, pp. 117 - 124 Energy use pattern AND sensitivity analysis of rice production: A case study of Guilane province of Iran Seyyed Hassan Pishgar, S. Rafiee1 and P. Sefeedpari Department of Agricultural Machinery Engineering, Faculty of Agricultural Engineering and
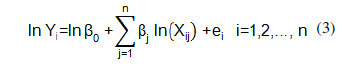
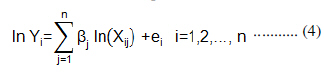
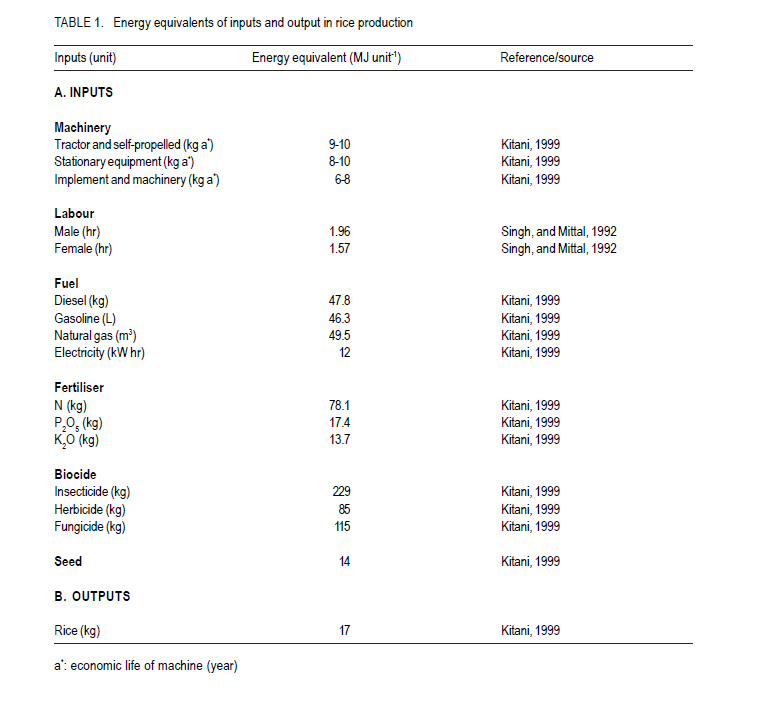
Technology, University of Tehran, Karaj, Iran (Received 3 November, 2010; accepted 31 March, 2011) Code Number: cs11011 ABSTRACT Rice is one of the most important crop supplying the world's population's food. Because of the direct links between energy and crop yields, and food supplies, rice energy analysis is essential. The objective of this study was to evaluate the energy balance between inputs and outputs of rice production in Guilane Province of Iran. Data were collected from 105 rice farmers with face to face questionnaire. A total energy input and output of 39.3 and 60.3 G J ha-1 was observed. Fertiliser and fuel were the highest energy inputs with amount of 14.1 and 11.6 G J ha-1, followed by electricity and seed with 5.2 and 3.1 G J ha-1, respectively. Energy use efficiency, energy productivity, specific energy and net energy were 1.57, 0.09, 11.20 and 21 G J ha-1, respectively. The share of non-renewable energy was almost 89%, while the direct and indirect energy usage based on inputs was approximately equal (49 and 51%, respectively). The econometric model showed that fuel and machinery had a significant effect on rice yield. The marginal physical productivity (MPP) value of fuel and machinery was 0.93 and 0.23, respectively. The total cost of production, gross and net returns were 3156, 1629 and 927 US$ ha-1, respectively. The benefit-cost ratio was calculated to be 1.29. Key Words: Energy ratio, fuel, renewable energy RÉSUMÉ Le riz est parmi d'importantes cultures qui fournissent de la nourriture aux populations du monde. A cause des liens directs entre l'énergie et les rendements de cultures, l'analyse de l'énergie pour le riz est primordial. L'objectif de cette étude était d'évaluer la balance énergétique entre apports et sorties de la production du riz dans la Province de Guilane en Iran. De données étaient recuillies de 105 riziculteurs à l'aide d'un questionnaire face à face. Un total d'apport et sortie d'énergie de 39.3 et 60.3 G J ha-1 était respectivement observé. Les fertilisants et le carburant constituaient un apport plus élevé d'énergie de l'ordre de 14.1 et 11.6 G J ha-1 suivis de l'électicité et semence avec 5.2 et 3.1 G J ha-1, respectivement. L'utilisation efficiente de l'énergie, la productivité de l'énergie, l'énergie spécifique et l' énergie nette étaient de 1.57, 0.09, 11.20 et 21 G J ha-1, respectivement. La part de l'énergie non renouvelable était d'environ 89%, pendant que l'usage direct et indirect de l'énergie basé sur les apports était approximativement égal (49 et 51%, respectivement). Le modèle économétrique avait montré que le carburant et les machines avaient 0.93 et 0.23, respectivement. Le coût total de production, le gros et le revenu net étaient de 3156, 1629 et 927 US$ ha-1, respectivement. Le rapport coût-bénéfice calculé était de 1.29. Mots Clés: Rapport énergétique, carburant, énergie renouvelable Introduction Rice (Oryza sativa) is the most important staple food for the large part of the world's human population, especially in East, South, Southeast Asia, the Middle East, Latin America and the West Indies. The worldwide average yield of rice in 2007 was 4.15 tonnes per hectare (FAO, 2008). The annual production of rice in Iran was more than 2.2 million metric tonnes in 2008 (Anonymous, 2009). The province of Guilan with 34.2% of rice production is one of the main rice producing areas in Iran. In order to sustain agricultural production, effective energy use is required, since it provides ultimate financial saving, preserves fossil resources and reduces environment distortion (Demircan et al., 2006). Agriculture is a process of energy conversion; the conversion of solar energy into food, feed and fiber through photosynthesis (Stout, 1990). Energy use in agricultural production has become more intensive due to the use of fossil fuel, chemical fertilisers, pesticides, machinery and electricity to provide substantial increases in food production. However, more intensive energy use has brought some important human health and environment problems. Thus efficient use of inputs has become important in terms of sustainable agricultural production (Yilmaz et al., 2005). Energy requirements in agriculture are divided into two groups, direct and indirect. Direct energy is required to perform various tasks related to crop production processes such as land preparation, irrigation, intercultural, threshing, harvesting and transportation of agricultural inputs and produce (Singh, 2000). Direct energy is directly used at farms and on fields. Indirect energy, on the other hand, consists of the energy used in the manufacture, packaging and transport of fertilisers, pesticides, seed and farm machinery (Kennedy, 2000). Energy use patterns and the contribution of energy inputs vary depending on farming systems, cropping season and farming conditions. Considerable work has been done on the use of energy in agriculture with respect to efficient and economic uses for sustainable production (Yaldiz et al., 1993). It has been realised that crop yields and food supplies are directly linked to energy (Stout, 1990). The main objective in agricultural production is to increase yield and decrease costs. In this respect, the energy budget is important. Energy budget is the numerical comparison of the relationship between inputs and out-put of a system in terms of energy (Gezer et al., 2003). Substantial research has been conducted on energy and economic analysis to determine the energy efficiency of different crop production practices in the developed countries (Singh and Mittal, 1992; Kuesters and Lammel, 1999; Mandal et al., 2002; Ozkan et al., 2004; Canakci et al., 2005; Hatirli et al., 2005; Jianbo, 2006; Çetin and Vardar, 2008). However, very few studies have been published on energy and economic analysis of rice crop with respect to Iran. Khan et al. (2009) studied energy use patterns and the relationship between energy inputs of two regimes of rice cultivation (Bullock Operated Farms (BOF) and Tractor Operated Farms (TOF) in Dera Ismail Khan, District of Pakistan. Consumption of animal energy on BOF was more than TOF due to heavy use of animal energy in land preparation and output-input ratio on BOF (6.32) was higher than TOF (4.16). Gajaseni (1995) analysed energy usage of transplanting and direct seeding systems of wetland rice systems in Thailand. The output-input ratio was 4.5 for the transplanting system and 2.7 for the direct seeding system. The aim of this study was to determine the energy use efficiency for the rice production in Iran. Materials and Methods This study was done in Langroud city of Guilane Province, Iran in 2008-2009 production years. Guilan Province was selected because of its high rice production area (34% of country area) (Anonymous, 2009). The data were collected using a face-to-face questionnaire from 105 farmers growing sole rice. The sample size was determined using a stratiûed random sampling technique (Yamane, 1967). Using the socio-economic structures of the farms, the inputs and the energy requirements of each input were collected. The output was rice and inputs were machinery, human labour, chemical fertilisers, diesel fuel, pesticides and electricity. The energy consumption of all inputs was calculated using energy equivalents in Table 1. The labour energy was calculated by multiplying the number of man-hours by estimated power rating of human labour (Table 1). Other inputs like fertilisers, seed and biocides were transformed to energy values by multiplying the quantity of the inputs by the energy equivalent of each input. To prepare water for irrigation, diesel fuel and electrical pump were used so irrigation energy was included in fuel energy. Machinery was estimated using Equation 1. ME=ExGxT.............................(1) Where ME is the machinery energy (MJ), E the production energy of machine (Table 1), G the weight of machine (kg), and is the economic life of machine (year). Input energy was also classified into direct and indirect, and renewable and nonrenewable forms. The direct energy (DE) included human,diesel, water and electricity energy that was used in the production process and; indirect energy (IDE) consisted of machinery, pesticide, seed and fertiliser. On the other hand, renewable energy (RE) consisted of human, seed, water and animal, and non-renewable energy (NRE) included machinery, electricity, diesel, biocide and fertiliser (Singh et al., 2003). Following the calculation of energy inputs and output values, the energy ratio (energy use efficiency), energy productivity, specific energy and net energy were calculated using the procedure outlined by Demircan et al. (2006). Cobb-Douglas function was used to evaluate statistical significance. CobbDouglas function has been used by others to examine the relationship between energy inputs and yield (Singh et al., 1998; Singh et al., 2003). Cobb-Douglas production function is expressed as: Y = f(x)exp(u) ..................................................... (2) Eq. (3) can be linearised and expressed in the following form:
where Yi denotes the yield of the ith farmer, Xij the vector of inputs used in the
production process. In β0 the constant term, βj represent coefficients of inputs which are estimated
from the model; and
With the assumption that yield is a function of inputs energy Eq.(4) can be expanded to Eq.(5); InYi=b1 In(X1)+b2 In(X2)+b3 In(X3)+b4 In(X4)+b5 In (X5) + b6 In(X6)+ ei ................................(5) Where X1 is machinery energy, X2 fuel energy, X3 labour energy, X4 fertiliser energy, X5 biocide energy and X6 seed energy. In addition to the influence of each energy inputs on rice yield, Cobb-Douglas function was utilised to evaluate the impact of direct, indirect, renewable and noun-renewable forms of energy on rice yield as a following forms In Yi = y1 In (DE)+y2 In (IDE)+ei .............. (6) In Yi = d1 In (RE)+d2 In (NRE)+ei .................... (7) Where Yi denotes the yield of the th
farmer, DE, IDE, RE and NRE are direct,
indirect, renewable and noun-renewable energy that
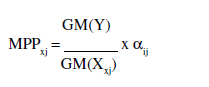
are used for rice production respectively, To analyse the sensitivity of energy inputs on rice yield, MPP method based on the response coefficients of inputs was used. MPP factors express the changes of output with a unit change of input, while other inputs are fixed in their geometric mean value (Singh et al., 2004). A positive value of MPP indicated with an increase in input value, output value will increase and a negative value of MPP indicates with increasing in input value, output value will decrease. The MPP value of each inputs, αij was utilised following Gündogmus (2006) and Singh et al. (2004).
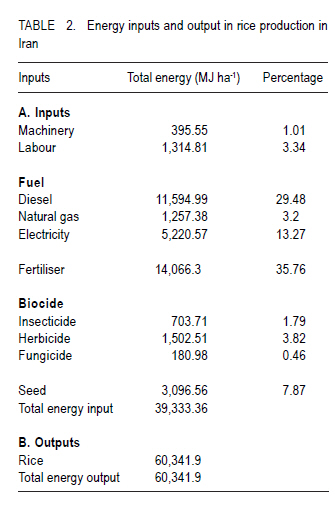
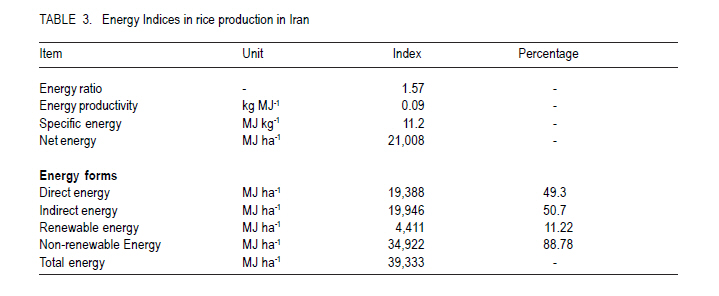
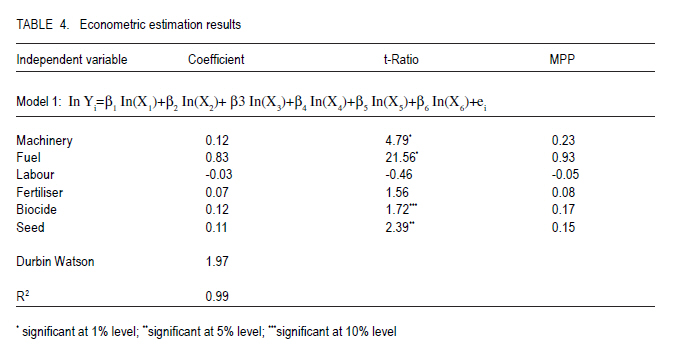
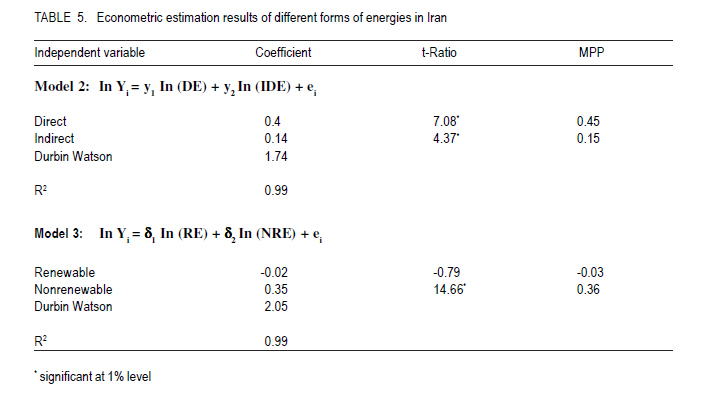
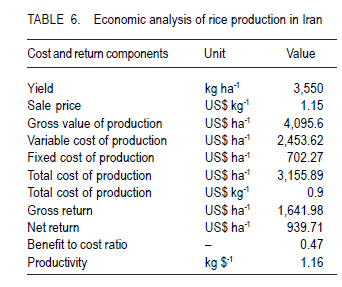
Where MPPxj is marginal physical productivity of jth input, αij regression coefficient of jth input, GM(Y) geometric mean of crop yield and GM(Xxj) geometric mean of jth input energy. Energy inputs and rice yield information were analysed using the Statistical Package for the Social Sciences (SPSS) and Shazam9.0 software programme and Eqs. (4) - (7) were calculated. Results and discussion Energy analysis. Total energy used as inputs was 39,333.36 MJ ha-1 (Table 2). Of all the inputs, the chemical fertiliser including N, P2O5 and K2O had the biggest share of total energy with 36%. The result was similar to that of Khan et al. (2009) where fertiliser had the highest consumption among all inputs in rice production. With the lack of knowledge, most Iranian farmers do not know proper amount of fertiliser needed by the crop. With this problem and subsidised price, a large amount of fertiliser is used. According to Singh et al. (1998), energy used in the production of chemical fertilisers accounted for about 40% of total energy in agricultural production in developed countries. Fertiliser energy is followed by fuel energy, with the share of 29% of total energy inputs (Table 2). Fuel energy was mainly used for irrigation, ractors and various machinery operations. Because of a large amount of water is pumped in rice production and due to the low price (U$ 0.018390 L-1) of this input (due to subsidies), high consumption of fuel energy was observed. Electricity with a share of 13%, took the third position. Electricity was mainly utilised in post-harvest operations. Due to conventional technology and old machineries, electricity was highly consumed in rice production. The share of biocide (insecticide, herbicide and fungicide) energy was 7%. Herbicide had the highest consumption of chemicals (4%), followed by insecticide and fungicide (2 and 1%, respectively) (Table 2). Due to low mechanisation, machinery energy consumption was 395.55 MJ ha-1 (share of 1%); while the human power was 3% of total input energy. The data revealed the average yield of 3,500 kg ha-1 and therefore, total output energy of rice production calculated was 60,341.90 MJ ha-1. Table 3 shows energy indices of rice production and the forms of energy input as direct and indirect energy, and renewable and non-renewable energy. Energy ratio is one of the best energy indices that shows the efficiency of rice production. The results indicated that 1.57 was less than rice energy ratio in Pakistan (Khan et al., 2009). Energy productivity, specific energy and net energy of rice production were 0.09, 11.20 and 21,008 MJ ha-1, respectively. The energy ratio values greater than 1 illustrates that production is efficiency and the output energy value is higher than the input energy values. The result revealed 19,388 MJ ha-1 (49%) and 19,946 MJ ha-1 (51%) for direct and indirect energy, respectively. Renewable and nonrenewable energy were 4,411 and 34,922 MJ ha-1, with share of 11 and 89%, respectively. With these results, it is clear that in comparison with renewable energy, the portion of non-renewable energy was high. It is obvious that in research area, rice production depends on non-renewable energy such as fossil fuels. Using non-renewable sources of energy leads to production of more greenhouse gas (GHG) and GHG emissions speeds up the global warming. Regression results showed significant impacts of machinery and fuel energy on rice yield (P<0.05) (Table 4). In addition, seed and biocide had significant impacts on rice yield. Other input such as labour and chemical fertiliser had no significant impacts on rice yield. Of all inputs, fuel had the highest impact (0.83), followed by machinery (0.12) and biocide (0.12) energy. From the regression results, with 10% increasing in fuel, labour and machinery energy, rice yield will increase 8.3, 1.2 and 1.2%, respectively. The results of MPP indicated that 1 MJ increase in fuel and machinery energy led to 0.93 and 0.23 kg ha-1 increase in yield of rice, respectively. To validate Model 1 of Cobb-Douglas function, Durbin Watson test was performed (Hatirli et al., 2005). Model 1 analysis resulted 1.97 for Durbin Watson value i.e., there was no autocorrelation in the estimated model (P>0.05). The Model's coefficient of determination R2 was 0.99. The regression analyse was used to realise the relationship between rice yield and forms of energy (direct and indirect) (Table 5). It was evident that the impact of direct and indirect energy on rice yield was highly significant (P<0.01) at 0.40 and 0.14, respectively. From Table 5, the impacts of renewable and nonrenewable energy focus were -0.02 and 0.35, respectively and between this two forms of energy non-renewable form was significant (P<0.01). By calculating the MPP value, it became obvious that consuming more (1 MJ) non-renewable, direct and indirect energy led to more (0.36, 0.45 and 0.15 kg ha-1) rice yield; while by using more (1 MJ) renewable energy, rice yield decreased (0.03). Durbin Watson values of Model 2 and 3 were 1.74 and 2.05, respectively (P<0.05). In addition, the model's coefficient of determination was 0.99 for two specified models (Table 5). Economic analysis of rice production. Table 6 presents variable and fixed costs of US$ 2453.62 and 702.27 ha-1, with shares of 77 and 23%, respectively. The gross value of rice production was US$4082.5 ha-1. Total cost of production based on cultivated area and the mass of harvested rice was US$ 3155.89 and 0.90 kg-1, respectively. The Gross (Total production value ($ ha-1)) - Variable cost of production ($ ha-1)) and net return (Total production value ($ ha-1) - Total production cost ($ ha-1)) were 1628.88 and 926.61 $ ha-1, respectively. The benefit-cost ratio of rice production was 1.29, which was lower than those reported earlier (Mandal et al., 2002; Khan et al., 2009). The benefit-cost ratio value indicated that rice production has economic efficiency in the research area. Economic productivity was 1.12. References
Copyright ©2011, African Crop Science Society The following images related to this document are available:Photo images[cs11011t5.jpg] [cs11011t3.jpg] [cs11011t4.jpg] [cs11011t2.jpg] [cs11011t1.jpg] [cs11011t6.jpg] |
| |||||||||
