 |
| About Bioline | All Journals | Testimonials | Membership | News |
|
||||||
|
||||||
African Crop Science Journal, Vol. 19, No. 3, pp. 173-182 Imazapyr-Resistant Maize Technology Adoption For Witch Weed Control In Western Kenya D.B. Mignouna1, 2, K.D.S. Mutabazi1, E.M. Senkondo1 and V.M. Manyong2 1 Department of Agricultural Economics and Agribusiness, Sokoine University of Agriculture,
P. O. Box 3007 Morogoro, Tanzania
2International Institute of Tropical Agriculture (IITA), P. O. Box 34441, Dar es Salaam, Tanzania
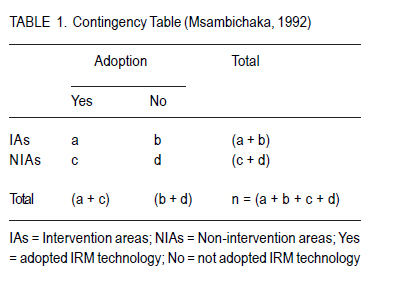
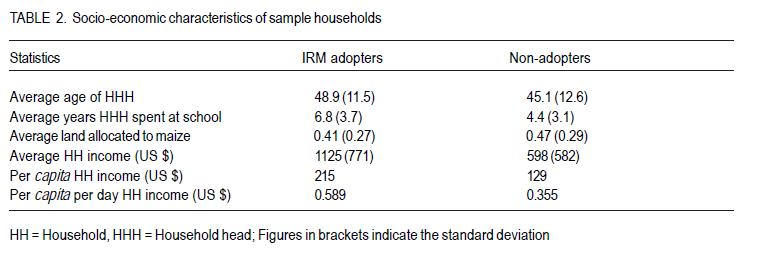
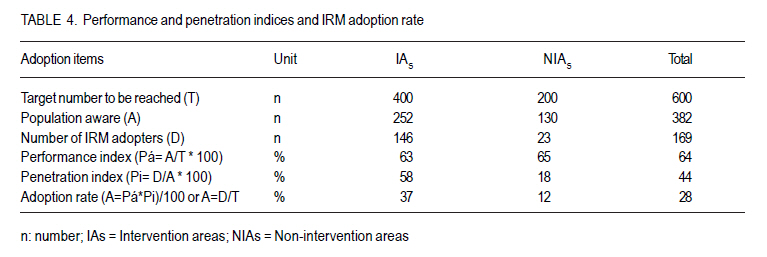
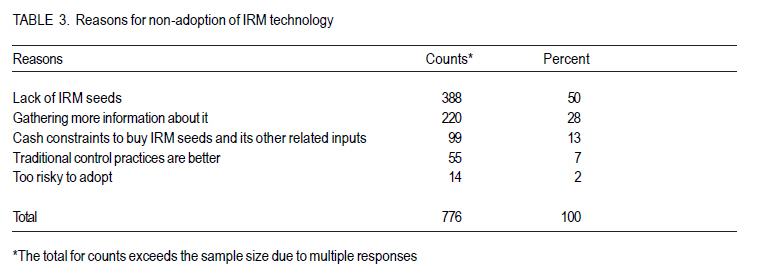
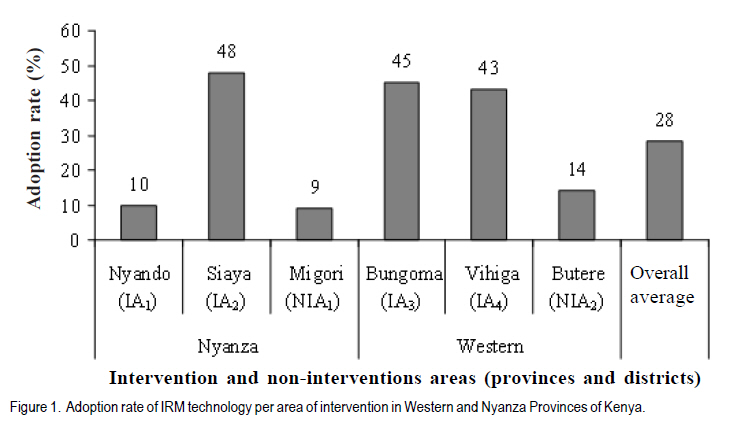
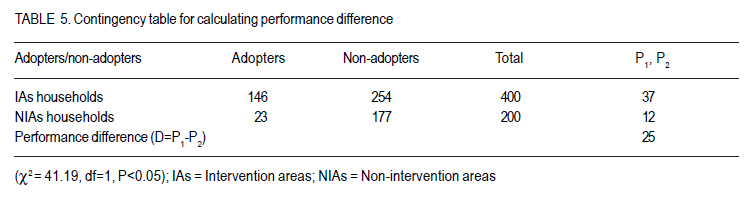
(Received 30 October, 2010; accepted 14 September, 2011) Code Number: cs11017 ABSTRACT Witch weed (Striga (genus) is a major constraint to cereal production in sub-Saharan Africa. A new technology known as imazapyr-resistant maize (IRM) has proven to be effective in controlling it. This study examined the status of IRM adoption in western Kenya. A cross sectional survey that included 600 households, of which 169 were IRM adopters and 431 were non-adopters, was conducted in Nyanza and Western Provinces of Kenya. There was a considerable difference in IRM use according to location. The adoption rate was 28% of the targeted farming population. The performance difference in adoption between the intervention and non-intervention areas was in the range of 25%. Initiating a cluster-based approach to enhance information flow and increasing stakeholders’ interaction and involvement within the farmers’ clusters can help potential adopters to make more informed decisions by protecting maize (Zea mays L.) crop in western Kenya from Striga. Key Words: Adopters, Zea mays RÉSUMÉ Le Striga genus est une herbe qui constitue une containte majeur à la production des céréales en Afrique sub-Saharienne. Une nouvelle technologie du nom de ma¿s résistant imazapyr (IRM) a été trouvée efficace dans le contrôle de cette herbe. Cette étude a examiné le niveau d’adoption IRM à l’ouest du Kenya. Une enquête transversale incluant 600 ménages parmi lesquels 169 adoptants et 431 non adoptants de la technologie IRM, était conduite à Nyanza et dans les provinces Ouest du Kenya. Il y avait eu une différence considérable dans l’utilisation de IRM basée sur la localisation. Le taux d’adoption était de 28% de la population cible. La différence en performance en terme du taux d’adoption entre les milieux d’intervention et ceux sans intervention, était dans l’intervalle de 25%. L’initiation d’une approche de groupement pour améliorer le circuit d’information et accroître l’interaction entre les partenaires et la participation entre les groupes de fermiers, peut aider les adoptants potentiels de prendre plus de décisions responsables en protégeant la culture du ma¿s (Zea mays L.) contre le striga à l’ouest du Kenya. Mots Clés: Adoptants, Zea mays INTRODUCTION Approximately 21 million hectares of cereal production in Africa is infested by Striga (Striga spp.), and this causes an annual grain loss of about 8 million metric tonnes (Gressel et al., 2004). The most deleterious effects occur under maize (Zea mays L.), where about 2.5 million hectares suffer grain losses of 30 to 80% (AATF, 2006). This causes economic losses in excess of US $1 billion annually (AATF, 2009). In sub-Saharan Africa, efficient and profitable production of maize is severely constrained by Striga, especially Striga hermonthica Benth. (Oswald, 2005). In Kenya, Striga infestation is most severe in Nyanza and Western provinces (Manyong et al., 2008a; b) and is found in over 210,000 ha of farmland (AATF, 2006). In monetary terms, about US$ 29 million per annum worth of maize is reportedly lost in the country (Woomer and Savala, 2007). In some cases, Striga infestation leads to complete loss of the local maize varieties. It has been reported widely that decline in soil fertility favours Striga proliferation (Kanampiu et al., 2003; Oswald, 2005). Farmers use traditional Striga control methods such as uprooting, burning and manuring, which unfortunately are ineffective (Manyong et al., 2008a). Consequently, these available Striga control technologies have failed to contain Striga epidemic, therefore, integrated Striga control technologies have been proposed. One of such efforts is the novel imazapyr-resistant maize (IRM) technology which utilises herbicide resistant maize seed, coated with the herbicide imazapyr (CIMMYT, 2004; AATF, 2006). The adoption of this novel technology has become a paramount means of stopping the disaster caused by Striga in smallholder farming in western Kenya. The duration of adoption of a technology varies among economic units, areas and attributes of the technology itself. From 2000 to 2006, evaluations of IRM technology trials were conducted during field days in all villages of selected districts in western Kenya (Kisumu, Siaya, Rachuonyo, Nyando, Bondo, Busia, Bungoma, Teso, Vihiga and Kakamega) and the participatory evaluations data were analysed by farmers. Other stakeholders (extension, seed companies) also did validation on their sites which encouraged promotion of the outputs through seed multiplication (companies) and technology transfer (extension). The biophysical measurements in adaptation trials were cross-evaluated by the International Agricultural Research Scientists (IARS). The economic analysis was done by social scientists from the centres. Meanwhile, the Badische Anlin& Soda Fabrik (BASF) and the African Agricultural Technology Foundation (AATF) formed in mid-2004 a steering committee to oversee the deployment of IRM under the trade name StrigAway technology. The committee enlisted the support of three local seed companies in Kenya, namely, Lagrotech, Kenya Seed and Western Seed; and Western Regional Alliance for Technology Evaluation (WeRATE). WeRATE is a consortium of non-governmental organisations including SACRED-Africa, the Sustainable Community Oriented Development Programme, Forum for Organic Resource Management, and Agricultural Technology; with the aim of spearheading and facilitating the dissemination of the technology. The Tropical Soil Biology and Fertility of International Centre for Tropical Agriculture was also involved in bulking and disseminating the seed for trials. Striga continues to depress maize grain productivity by 20 - 100%, often leaving farmers with little or no food grain at harvest (AATF, 2008). Therefore, the question whether farmers are adopting IRM technology remains important. MATERIALS AND METHODS The study was carried out in Nyanza and Western provinces in Kenya In this region, cereal production is constrained by Striga; and this weed accounts for more than 50% of yield losses (Woomer and Savala, 2007). Source of data. A structured questionnaire containing both closed and open-ended questions was used. A multistage, random sampling procedure was employed in selecting 600 households from Nyanza, and Western provinces of Kenya. This method ensures a high degree of representativeness, by providing the elements with equal chances of being selected as part of the sample (Babbie, 2009). The sample selected was drawn from the same region, comprising first of 400 households from areas accessible by WeRATE and seed companies for spearheading and facilitating IRM dissemination; and of 200 households from inaccessible areas where no organised IRM dissemination programmes had been designed. The latter served as the control group that provided background information for explaining IRM dissemination. The areas accessible were named “Intervention Areas” (IAs) and the inaccessible as “Non-Intervention Areas” (NIAs). The districts retained as IAs in the study area in Nyanza province were: Nyando (IA1) and Siaya (IA2). Those selected in Western province were: Bungoma (IA3), Vihiga (IA4). The sampled districts under NIAs were: Migori (NIA1) in Nyanza province and Butere (NIA2). The total sample size of households obtained for the study was from the overall sample of 100 respondents randomly picked from each of the six districts. The sample data were distributed as follows: IRM adopters (169) and IRM nonadopters (431). Data analysis. The mathematical expression of the adoption rate (Ai) is shown in Equation 1. A1 = N/T * 100 ............................. Equation (1) Where: Ai = percentage of adopters; N = number of adopters; and T = number total of participants in the project. Adoption could be estimated also as a function of performance and penetration indices as shown in Equation 2. Ai = (Pá * Pi)* 100 ........................ Equation (2) Where: Pá = performance index; and Pi = penetration index. The performance and penetration indices were used as indicators to assess the success or acceptability levels of messages, which had been communicated to farmers before the adoption decision. Performance index. Performance index (Pá) shows the actual number of households reached against the target number that should be reached (here the total sampled households) (Casley and Lury, 1982). The mathematical expression of Pá is as shown in Equation 3. Pá = A / T * 100 ............................. Equation (3) Where: A= Actual number reached; and T= Target number to be reached. Penetration index. Penetration index (Pi) shows the number of households accepting to adopt IRM practice out of the actual number reached (Casley and Lury, 1982). The mathematical expression of Pi is as shown in Equation 4. Pi = D / A * 100 ........................... Equation (4) Where: D = Number accepted to adopt IRM technology Performance difference between IAs and NIAs. Performance difference in this case is the difference in adoption rates between IAs and NIAs of IRM technology. This was done using a Contingency table of Msambichaka (1992) (Table 1). The difference (D) in performance between farmers in IAs (P1) and in NIAs (P2) is given in Equation 5. D = P1 – P2 = [a / (a + b)] – [c / (c + d)]. Equation (5) A smaller figure of D indicates that the diffusion rate of the new technology is to a smaller segment of the population in the two cases and vice versa. RESULTS AND DISCUSSION Socio-economic characteristics of households. Table 2 presents data on demographic and socioeconomic characteri-stics associated with the adoption of improved technologies. The average age of households head for IRM adopters was significantly (P<0.05) greater than that of nonadopters. The overall average years spent in school by adopters was about 7, while nonadopters spent about 4 years. This conforms to the findings of other earlier researchers (Anandajayasekeram et al., 1996; Million and Belay, 2004; Abdulai and Huffman, 2005). Education could have helped adopters in their decision regarding IRM. This observation though is contradicted by that of Hassan et al. (2003) who asserted that though education plays a significant role in the adoption decision, this variable may not be significant in affecting the decision to adopt recommended practices such as doses of Padan in Gujran Wala District in Pakistan. Farmers in western Kenya are engaged in different income generating activities, and the main sources of income are crop and livestock trade (Table 2). Adopters of IRM had significantly (P<0.05) higher household income than non-adopters (Table 2). This suggests that, adoption of IRM technology was associated with high household income probably due to higher purchasing power required to support all the costs prerequisite for IRM cultivation. This meant that farms facing financial constraints were less likely to adopt new technologies than those with sufficient funding. These findings are similar to those of Salam (1985) and Nzomoi et al. (2007) who identified costs as key determinants of adopting fertilisers and technology in the production of horticultural export produce in Kenya, respectively. The per capita household income of about US$ 0.59 day-1 for adopters and 0.36 for non-adopters, is characteristic of extreme poverty in Western Kenya (Table 2) according to World Bank (2006). About 33% of the households declared to have had contact with extension agents, and within those visited farmers; adopters had significantly (P < 0.05) higher number of visits by extension agents (twelve times) than nonadopters. Extension visits is a major means of dissemination of new technologies. It is also a very important determinant of technology adoption (Tiamiyu et al., 2009). Visits by extension agents to farmers, and participation of the latter in field days, tours, agricultural shows or seminars are important means of reaching out with IRM technology (Ali-Olubandwa et al., 2011). Adoption rate. In Western Kenya, the adoption and diffusion of IRM were illustrated by the adoption rate and performance and penetration indices (Table 4). More than 25% of the sample households adopted IRM technology. This might be the reason why local and hybrid maize varieties still dominate the production system of the region and farmers have not yet made headway towards eradicating Striga from their lands. The adoption rate of IRM was low (Table 3). Half of the responses for non-adoption were related to lack of IRM seeds in the market places (Table 3). This was due to slow commercialisation of the IRM in the seed supply chain in local market places accessible to farmers. The commercialisation of IRM was slowed by: (i) poor infrastructure that inhibited market access for inputs and outputs, coupled by the poor seed distribution networks; (ii) financial constraints which forced farmers to resist ideas that could lead to expenses; and (iii) competition from other maize varieties that could raise production levels. In order to speed up IRM commercialisation, there is a need to facilitate farmers’ access to inputs. There is also need for supporting seed companies with incentives and stimulants to expand their stockist distribution networks. Some of the non-adopters (28%) were still gathering more information about IRM technology before deciding its adoption. Other reasons for non-adoption are as shown in Table 3. Adoption rates varied across the six studied districts presented in Figure 1. The rate was reasonably highest in Siaya (IA2), followed by Bungoma and Vihiga. It was low in Butere and Nyando with considerably lower adoption in Migori than elsewhere. The observed low adoption rates can be explained by the fact that many smallholder farmers were still unaware of IRM. In Nyando (IA1), every year during the rainy seasons, floods are experienced in the lower course of the Nyando River, covering approximately half of Nyando district, further shrinking the farm sizes (Njogu, 2002; Otiende, 2009; Nyakundi et al., 2010). This prevents farms from adopting technology. Also, education level of head of households which is supposed to contribute to general awareness and exposure of information and should favour the farmers to adopt, was low (1.8 years). This could have led to reduced awareness of IRM (27%) leading to poor adoption, despite the effort made by WeRATE and seed companies to persuade farmers to adopt the technology. Moreover, of the 90 non-adopters in Nyando district, 73% reported to have got late IRM seeds. Performance index. Table 4 presents data for performance index of IRM in Western Kenya. About 64% of farmers in the target population had been informed regarding IRM existence. These farmers listed the benefits from IRM as increase in yield, increased household income and reduced poverty as the benefits. However, being part of the IRM programme (IAs) was not necessarily sufficient to ensure benefits from IRM. Thus, despite the intervention by WeRATE with IRM, a performance index of 0.6 was obtained in the NIAs. This was surprisingly fairly greater than that of the IAs areas. This can be explained by the possibility of interpersonal communication between WeRATE households and non-particiating neighbours. “Exposed” households learnt about IRM from multiple sources (Table 4). Of the responses from 130 households in NIAs at the survey time, 82% stated to have been aware about IRM from households from the same area, while few mentioned to have been informed by others from IAs. The information received from IAs was then widely propagated to the neighbourhoods, depicting the high level of inter-communication among farmers from different households in NIAs which has led to a high level of awareness. Farmers eagerness in seeking information about new technologies or practices, was evident and this could be tapped to control Striga in maize production system. Penetration index. This was the reverse of the performance index in both IAs and NIAs (Table 4). The penetration index was more than three times as much in IAs (0.58) as in NIAs (0.18) implying that exactly 58% and 18% of farmers in IAs and NIAs, respectively, who were aware about IRM existence, got interest and decided to use it. The disparities found between IAs and NIAs could have come from incomplete information due to absence of intervention in NIAs. Encouragement and support from stakeholders (WeRATE, Regional government, National government) directly or indirectly affected farmers’ decision-making in adopting IRM. The situation was different in NIAs where diverse actions lacked a catalyst for IRM adoption. Despite the importance of intercommunication which may have occurred among farmers in NIAs, the respective farmers were still not well equipped to innovate; thus very few decided to use it. Farmers in NIAs lacked reliability on the added credibility of farmer-tofarmer communication about IRM and this could have impeded their interest in it. This is in line with the report by Lionberger (1960) that technical information is needed by farmers in the adoption process. The penetration index underscores the fact that for widespread of IRM, awareness about the existence of a new technology in the adoption decision should be increased by coupling it with incentive scheme. The performance and penetration indices confirmed the theory of Rogers (2003) on innovation decision process substantiating learning about the innovation as a first stage in the adoption process; and that this is followed by persuasion. Persuasion from WeRATE and other stakeholders’ technical staff involved in IRM technology dissemination explained the higher penetration index in IAs than that in NIAs. Similar studies indicate that a good deal of the study population does not possess the necessary information and level of awareness concerning the new technology and lack of producer information regarding the profitability of adopting improved practices might be one of the reasons why widespread adoption of improved technologies has not occurred (Feather and Amacher, 1994; Saha et al., 1994; Dimara and Skuras, 2003). Performance difference. The margin of 25% between farmers’ adoption rates in IAs and NIAs (Table 5) is relatively small but important. This difference illustrates the contribution of different agents in IRM technology transfer. Of the 169 adopters, 37% had been sensitised in IAs on the advantages of the technology; while only 12% in the NIAs had been sensitised. Awareness about IRM technology among farmers seems to have less influence than sensitisation mounted by WeRATE technical staff. Sensitisation is close to awareness; however sensitisation, is related to the feeling of being more touched. Therefore, sensitisation on new IRM by WeRATE appears to be related to promotion of adoption of IRM technology. Sensitisation was through visits and demonstrations, trials by WeRATE staff or from other stakeholders, formal short-term training. Also the adopters and their localisation area were associated, meaning that being an adopter or non-adopter, depended significantly (P<0.05) on the area where the farmers were located. IRM technology diffusion. Figure 2 presents IRM technology diffusion curve. The Figure is S- shaped, complying with the adoption theory (Rogers, 1995; 2003) and is in line with many cases in the past with same feature of the process (Griliches, 1957; Mansfield, 1968). From the slope of Figure 2, the adoption rate of IRM was higher between 2005 and 2006 seasons as the growing community of adopters was established. According to the secondary information gathered during this study, such high adoption rate would have resulted from a series of dissemination activities including: (i) launching of IRM technology in June 2005 at Kisumu in western Kenya, (ii) over 1300 on-farm testing during long rains season of 2005 carried out in 12 districts covering a total of 50 hectares in western Kenya, and (iii) more than 120 tonnes of IRM production by the International Maize and Wheat Improvement Center in collaboration with Western Seed Company for commercialisation in March 2006. The S-shape in Figure 2 indicates a small gradual slope denoting a slower rate of adoption. As suggested by Mishra (2007), a strategic analysis could be considered to maintain the adoption rate going well or in rapid growth. IRM dissemination measures and strategies remain to be accomplished or enhanced, so that IRM technology could diffuse rapidly so as to create a steeper S-curve instead. ACKNOWLEDGEMENT We are grateful to the International Institute of Tropical Agriculture (IITA), Ibadan in Nigeria for funding this research through a grant received from African Agricultural Technology Foundation (AATF). REFERENCES
Copyright © 2011, African Crop Science Society The following images related to this document are available:Photo images[cs11017t3.jpg] [cs11017t1.jpg] [cs11017f2.jpg] [cs11017t5.jpg] [cs11017f1.jpg] [cs11017t4.jpg] [cs11017t2.jpg] |
| |||||||||
