 |
| About Bioline | All Journals | Testimonials | Membership | News |
|
||||||
|
||||||
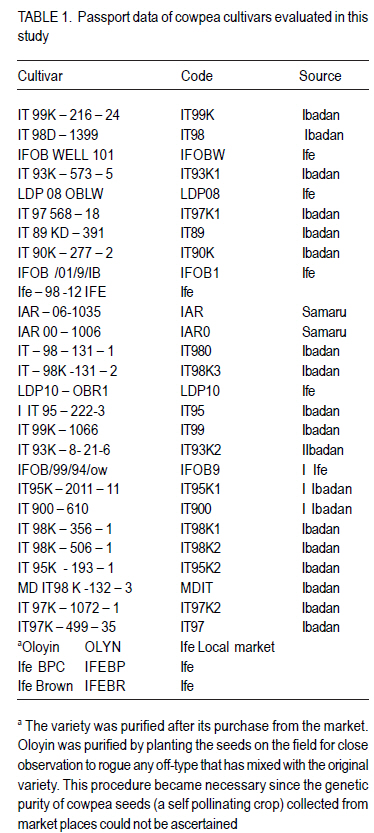
African Crop Science Journal, Vol. 19, No. 3, pp. 189-200 Interrelationships Between Grain Yield And Other Physiological Traits Of Cowpea Cultivars A.S. Oladejo1, R.O. Akinwale1,2 And I.O. Obisesan1 1Department of Crop Production and Protection, Obafemi Awolowo University, Ile Ife, Nigeria 2International Institute of Tropical Agriculture, Ibadan, Nigeria Corresponding author: oladejosamuel@yahoo.com (Received 13 December, 2010; accepted 20 September, 2011) Code Number: cs11019 ABSTRACT Adequate knowledge of the interrelationships among physiological traits is essential in planning and evaluating breeding programmes for cowpea improvement. The objective of this study was to determine the interrelationships among physiological traits of thirty cowpea cultivars and identify suitable traits for indirect selection for improved crop yield. The study was conducted for two consecutive growing seasons at the Obafemi Awolowo University, Teaching and Research Farm, Ile-Ife in Nigeria. Combined analysis of variance, cluster analysis and genotype-bytrait (GT) analysis were carried out on the measured traits. Results showed significant genotype differences for all phenological and morphological traits, except grain yield and associated yield components. The GT biplot analysis revealed close associations among the phenological traits. Grain yield was positively correlated with all morphological traits except the two peduncle traits and negatively correlated with flowering traits. IT98-131-1 was the best cultivar based on multiple traits and was identified as the ideal cultivar that can be used as a reference check. Seed growth rate, yield growth rate, yield per plant, and pod weight were identified as traits that are most appropriate for indirect selection for improved grain yield of cowpea. Key Words: GGE biplot, genotype-by-trait, Nigeria RÉSUMÉ La connaissance adéquate des relations mutuelles parmi les traits physiologiques est essentielle dans planification et l’évaluation des programmes d’amélioration du petit pois. L’objectif de cette étude était de déterminer les relations mutuelles parmi les traits physiologiques de trente cultivars de petit pois et d’identifier des traits appropriés pour la sélection indirecte de cultures à rendement amélioré. L’étude était conduite en deux consecutives saisons de culture à l’Université Obafemi Awolowo, une Ferme de Recherche et d’éducation, Ile-Ife au Nigeria. L’analyse de la variance combine, l’analyse par groupement et l’analyse du génotype par trait, était conduit sur les traits mésurés. Les résultats ont montré des différences génotypiques significatives pour tous les traits phénologiques et morphologiques, excepté le rendement en grain et les composants associés aux rendements. L’analyse de biplot GT a révélé des associations proches parmi les traits phénologiques. Le rendement en grain était positivement corrélé avec tous tous les traits morphologiques excepté les deux traits de pédoncules et négativement correlé avec les traits de floraison. IT98-131-1 était le meilleur cultivar basé sur de traits multiples et était identifié comme un cultivar ideal qui peut être utilisé comme un matériel de reference. Le taux de croissance, le taux de rendement, le rendement par plant, et le poids de gousses étaient identifiés comme des traits appropriés à la sélection indirect pour l’amélioration du rendemen en grain du petit pois. Mots Clés: Biplot GGE, génotype-par-trait, Nigeria INTRODUCTION Cowpea (Vigna unguiculata L.) is comparatively a cheap source of quality protein, phosphorus, iron, vitamins and excellent substitute for meat, egg, and other protein-rich foods (Alghali, 1991). It is highly nutritious and provides superior and cheap source of protein for the resource-poor farmers in sub-Saharan Africa (Alghali, 1991). Yield is the major breeding objective of any crop improvement programme. It represents the final product from physiological and developmental processes which occur from time of sowing to plant maturity (Obisesan, 2004). From the crop production view point, yield is the sum total of all production efforts on the farm. It is always measured in terms of the quantity of desired crop part per unit area of land and it can be partitioned into several components that constitute physiological determinants of yield. Although yield is the universal breeding objective, cultivars gain acceptability as a package of various multiple traits. This is because a cultivar is more or less a complex biological system rather than simple collection of independent traits, and an effective breeding programme requires a proper understanding of the essential components of the system and the interrelationship among them (Yan and Kang, 2003). Grain yield in crop plants is governed by yield components. According to Obisesan (1986), yield can be analysed using two different approaches: the yield system analysis (YSA) and the systematic modelling approach. To obtain maximum benefits from selection procedure, plant breeders must be able to identify and manipulate a combination of morphological and phenological traits that positively enhance grain yield increase in cowpea. Several studies on the interrelationship among agronomic traits of cowpea have been reported using correlation and regression analysis (Ogunbodede, 1989; Musvosvi, 2009). The genotype-by-trait (GT) biplot analysis, proposed by Yan and Kang (2003) is another powerful statistical tool for studying relationships among traits, evaluating cultivars based on multiple traits and for identifying those that are superior in certain traits. These could be candidates for use as parents in a breeding programme or directly released for commercial production. The GT analysis allows visual display of the genetic correlation among traits (Yan and Rajcan, 2002; Lee et al., 2003). It also provides information on the usefulness of cultivars for production as well as information that helps to detect less important (redundant) traits, and identify those that are appropriate for indirect selection for a target trait. Since a cultivar gains wide acceptability based on a package of desirable traits and not just its yield potential (Yan and Kang, 2003), evaluating cowpea cultivars based on multiple traits becomes very essential in assessing them for production. GGE biplot has proven to be a very useful tools for evaluating maize cultivars in this regard (Yan and Fregeau-Reid, 2008; Badu-Apraku and Akinwale, 2011; Badu-Apraku et al., 2011). Evaluating the genetic potentials of cowpea cultivars based on multiple traits for breeding programmes is rare in literature. Akande (2007) and Akande and Balogun (2009) used the tool and reported interesting trends in the genotype x environment interaction. However, this tool has not been used to study relationships among traits of cowpea (Badu-Apraku and Akinwale, 2011). Information is limited in the area of identifying traits that can be used for indirect selection of improved grain yield in cowpea. Imran et al. (2010) found significant correlation (r =0.585) between number of branches plant-1 with leaf area but no such significant association was obtained between number of leaves per main branch and green fodder yield. They also reported no significant association with number of seeds per pod and grain yield. The objective of this study was to identify ideal cultivars based on multiple morphological and other traits that are suitable for indirect selection for improved grain yield using genotype-by-trait biplot. MATERIALS AND METHODS Thirty elite cowpea cultivars (Table 1) obtained from the International Institute of Tropical Agriculture (IITA), Ibadan, and the Department of Crop Production and Protection, Obafemi Awolowo University (OAU) Ile-Ife, Nigeria, were evaluated for agronomic performance in a randomised complete block design, with three replicates in two consecutive growing seasons (May 2007 and May 2008). Two weeks before anthesis (flowering stage), the field was sprayed with Nuvacron (400 g L-1 monochrotophos) to control insect pests like Clavigralla tumentoscolis, Mirperus jaculus and Megalurotrips sjostedsti which destroy flowers and pods. This was subsequently carried out weekly until physiological maturity (PM). Rougueing was done during vegetative stage. Data on the physiological traits were collected mainly from five tagged plants in the two net rows of each plot. Data were collected on days to first flower node (DFN), days to first flower (DFL), days to fifty percent flowering (DF50), days to first pod formation (DP), days to physiological maturity (DPM), days to fifty percent podding (DP50), days to 50% harvest maturity (DHM50), number of peduncles per plant (PED/PLT), peduncle length (PED/LT), number of pods per plant PD/PLT), pod weight (PDY), and grain yield (YLDHA). Some secondary traits were generated from the primary traits mentioned above. These included:
Data collected in the field were subjected to combined analysis of variance using General Linear Model (GLM) procedure of Statistical Analysis System (SAS) Version 9.2, with random statement TEST option (SAS Inc., 2002). Means were separated using Fisher’s Least Significant Difference (LSD). Ward’s minimum variance cluster procedure of SAS was used on the standardised values of some selected phenological traits, to classify the cultivars into maturity classes. Because the traits were measured in different units, the biplots were generated using the standardised values of the traits means using GGE biplot software, Version 5.4 (Yan, 2001). The biplot analyses were based on Model 2 (i.e., dataset was not transformed (Transform=0) within-trait standard deviationstandardised (Scale=1), and trait-centred (Centering=2). The polygon views were based on genotype-focused singular value partitioning (SVP=2), while the vector views were based on the trait-focused singular value partitioning and is, therefore, appropriate for visualising the relationships among traits and genotypes. The GGE biplot model equation for genotype by trait interaction biplot analysis is presented as follows:
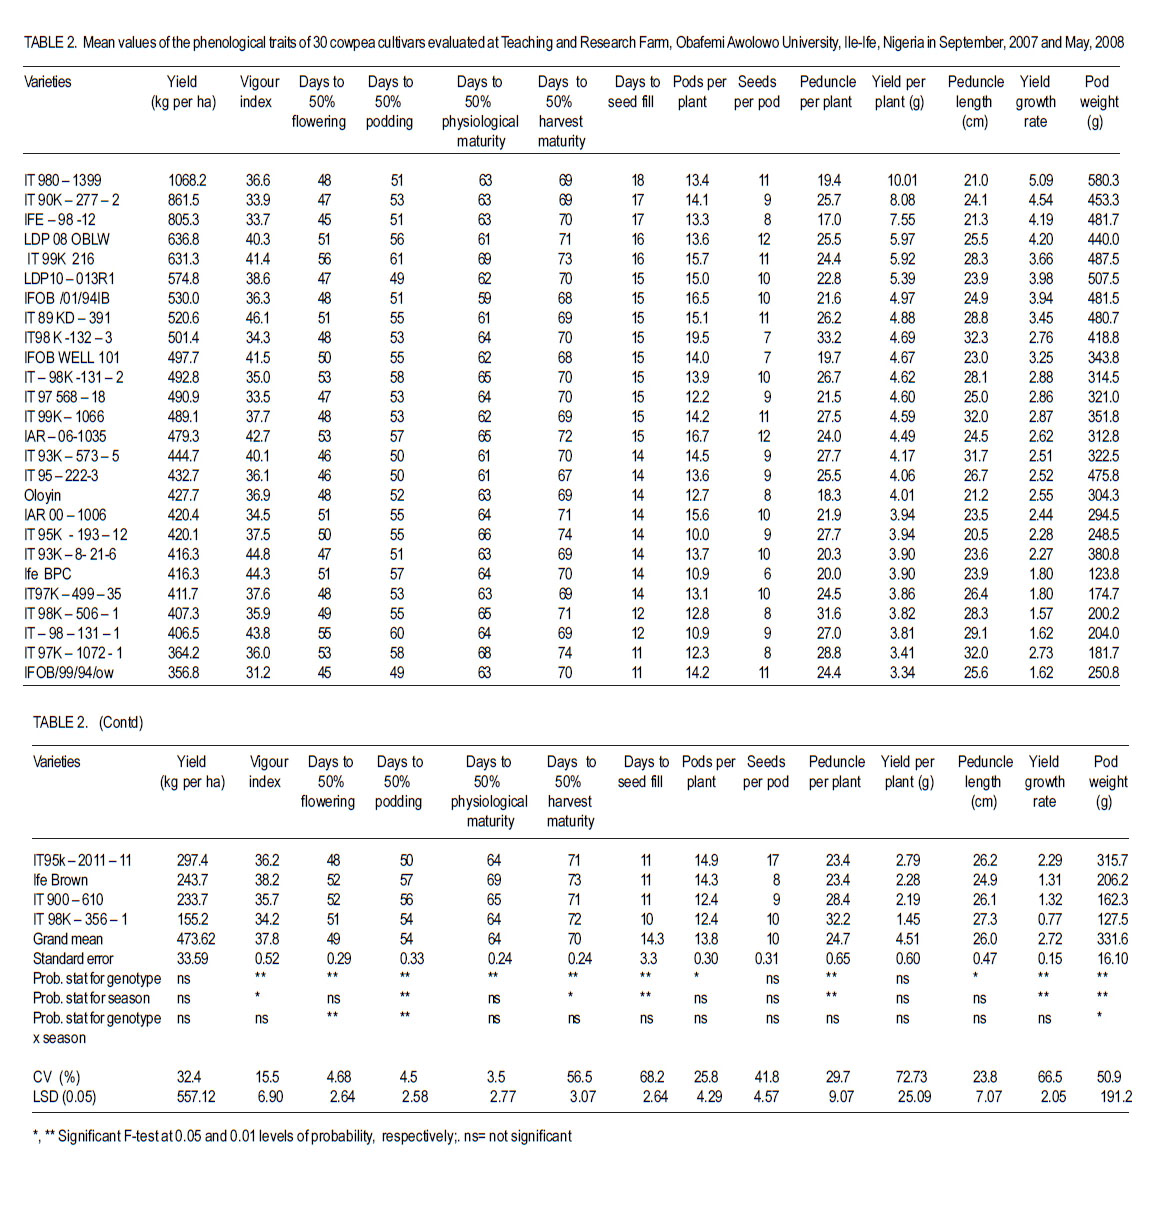
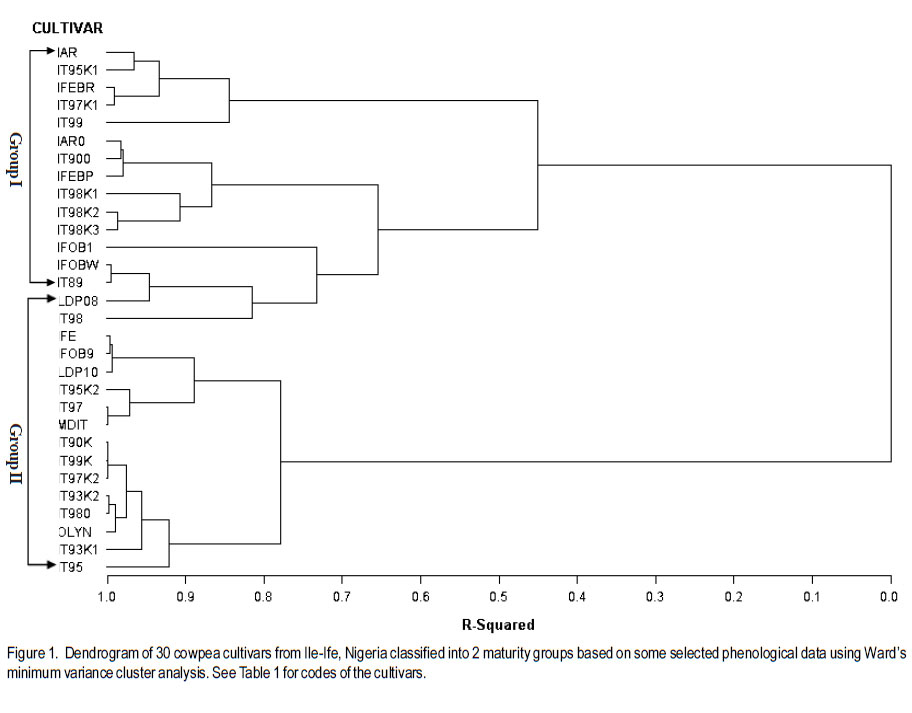
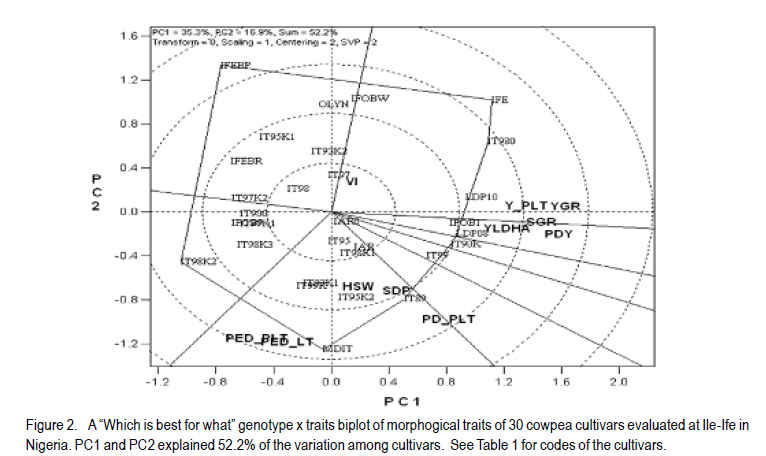
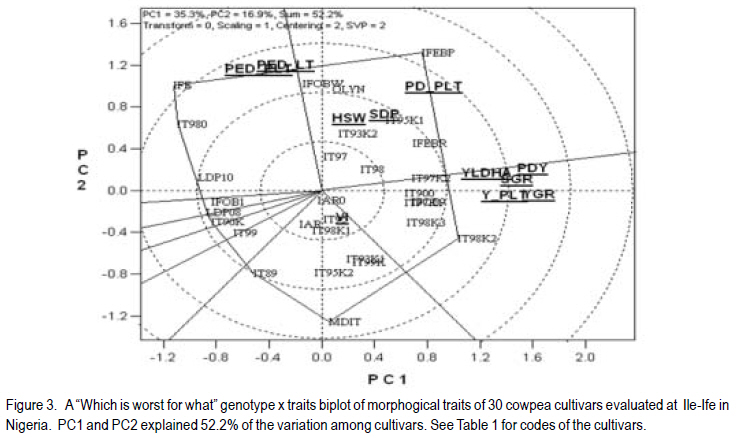
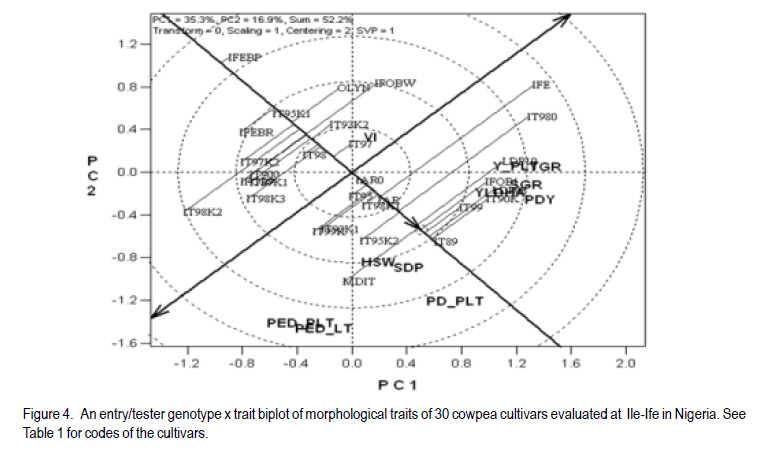
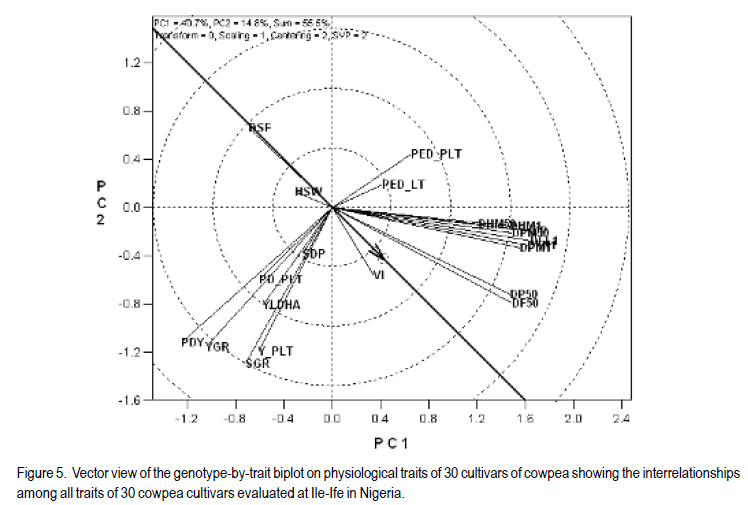
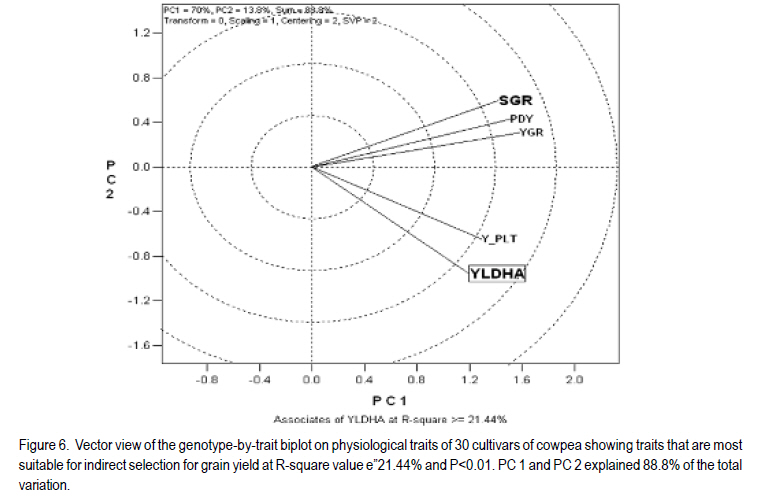
Where: Yij is the genetic value of the combination between inbred i and trait j; µ is the mean of all combinations involving traitj; βj is the main effect of trait j; λ1and λ2 are the singular values for principal component (PC)1 and PC2; gi1 and gi2 are the PC1 and PC2 eigenvectors, respectively, for inbred I; e1j and e2j are the PC1 and PC2 eigenvectors, respectively, for trait j; dj is the phenotypic standard deviation; and εij is the residual of the model associated with the combination of Inbred i and trait j. RESULTS AND DISCUSSION Results of the combined analysis of variance showed significant cultivar means for days to first node formation, days to flowering, days to pod maturity, harvest maturity and days to seed fill (Table 2). Also, significant cultivar x season interactions were detected for days to first node formation, 50% flower, first pod formation, 50% pod formation, and days to first harvest maturity. These relatively high significant means in the flowering traits among the cowpea cultivars suggest that the 30 cultivars may not belong to the same maturity class. It is important to ensure that genotypes in a breeding programme are clearly classified into maturity groups so as to take advantage of earliness of the germplasm for developing cultivars (drought-escaping cultivars) that are well adapted to areas or locations with short rainfall. No effort has been made to classify different cowpea cultivars in the germplasm of Obafemi Awolowo University, Nigeria into clear maturity groups and this confounds the management of the germplasm for breeding purposes. In this study, the significant mean for flower traits indicated wide variability among the 30 cultivars for these traits and suggested further analysis to classify them into different maturity groups. Cluster analysis on the standardised values of these three flowering traits, using Ward’s minimum variance procedure of SAS helped to identify two distinct maturity groups (Fig. 1). The first group was later maturity and they included IAR-06-1935, IT93K-573-5, Ife Brown, IT97K-1072-1, IT99K-610, Ife BPC, IT98K356-1, IT98K-131-2, IT98K-506-1, IT99K-216-24, IFOB WELL 101, IAR00-1006, and IT900-610. The second group was earlier maturing and consisted of IFOB/99/94/OW, IT89KD-391, IT90K-277-2, IT93K-573-5, IT93K-8-21-6, IT95-222-3, IT95K193-12, IT95K-2011-11, IT97-568-18, IT97K-49935, IT98-131-1, IT980-1399, IT99K-1066, LDP08, IFOBWELL, LDP10-013R1, MDIT98K-132-3 and Oloyin. In their study, Akande and Balogun (2009) reported that IT93K-452-1 was later maturing; while IT89K-288 was earliest in maturity. Among the morphological traits, HSW, SDP, PED_PLT, PED_LT, VI and PDY showed significant differences among the cultivars and only pod weight showed significant cultivar x season interaction (Table 2). Cultivar evaluation based on multiple traits analysis using GGE biplot. Figures 2 and 3 are biplots showing the polygon view of the genotype x traits analysis on the morphological traits based on Principal Component axes (PC)1 and PC2. The traits were considered as the tester and the cultivars as entries. The two axes explained 52.2% of the total variation among the cultivars due to morphological traits measured. Figure 2 shows which cultivar(s) were best at what trait and Figure 3 shows the reverse situation. The cultivar(s) at each vertex (vertex cultivar) of the polygon in the biplot were the best or worst in terms of the trait(s) found within the sector demarcated by any two lines that meet at the origin of the polygon. From Figure 2, Ife98-12 and IT980-1399 were the best in terms of vigour, grain yield, SGR and YGR, indicating that they can be used as parents in the development of variety hybrids and populations that are outstanding in these traits. MDIT98K-132-3 and IT98-131-1 were the best cultivars for peduncle length, number of peduncles per plant, number of seeds per pod, number of pods per plant and hundred seed weight. Even though both materials were identified for good peduncle and pod characters, they were not the best for grain yield, indicating that peduncle and pod characters might not be a good trait-indicators for grain yield. This result agreed with Imran et al. (2010), who reported no significant correlation between pod number, 1000 seed weight and grain yield. Ife BPC and IT98K-356-1 were also vertex cultivars but no trait was found in their respective sector, an indication that they are not outstanding for any of the morphological traits. From Figure 3, Ife BPC was the worst in terms of pods per plant, hundred seed weight and seeds per pod. Ife-98-12 and IT980-1399 were the worst in terms of peduncle number and length. IT98K-356-1 was the worst at grain yield, SGR, pod weight and YGR; while MDIT 98K-132-3 and IT98-131-1 were relatively the least vigorous. Akande and Balogun (2009) and Egbe et al. (2010) reported similar superior performance of many cowpea cultivars developed by International Institute of Tropical Agriculture (IITA), Nigeria, designated (IT) over the local cultivars. Identification of an ideal cultivar. In the context of genotype-by-trait analysis, an ideal cultivar has been defined as the cultivar that combines several good traits in its genetic composition (Badu-Apraku and Akinwale, 2011). In the biplot displayed in Figure 4, the single-arrow line that passes through the biplot origin is referred to as the average-tester axis (ATC) abscissa, and on this line is ranked the cultivars in terms of their morphological performance. The double-arrow line (ATC ordinate) divides the ATC abscissa into two at the middle (Yan et al., 2007). The portion of the ATC towards the right displays the above average cultivars and towards the left shows those cultivars below average. Based on this biplot, the cultivars that performed above average were IT89KD-391, IT99K-216-24, IT90K-277-2, IFOB-/01/94IB and MDIT 98K- 132-3; while Oloyin, IT95K-193-12, Ife Brown and Ife BPC performed below average in terms of morphological parameters. The poor performance of Ife Brown observed in this study is in agreement with the findings of Egbe et al. (2010), who reported that IT04K-221-1, IT03K316-1, IT03K-324-9,IT03K-351-1, IT00K-1217, IT98K-692, IT99K-377-1, and IT03K-378-4 cowpea varieties performed better than Ife Brown, which was used as a check variety in number of pods produced per plant, dry pod weight and grain yield. An ideal cultivar should possess the highest mean performance across traits (i.e., longest projection onto the average tester axis (ATC abscissa) and shortest entry-vector, thus, it should be close to the ideal genotype represented by the innermost concentric circle with an arrow pointing to it (Yan and Kang, 2003). Such ideal cultivar can, therefore, be used as a reference check in subsequent trials where the set of morphological traits will be measured. From Figure 4, IT89KD-391 is closest to the position of an ideal cultivar. It is ranked the highest in term of morphological performance because it is desirable in terms of most of the morphological traits. This cultivar could serve as a good genetic raw material from which better cultivars, synthetic varieties and pure lines can be developed. This result is corroborated by the findings of Akande and Balogun (2009), who reported that IT89K-288, a closely related cultivar to IT89KD-391, was the most superior cultivar in many agronomic and yield traits when evaluated in a mutilocational trial. Interrelationships among traits and identification of redundant traits. Figure 5 is a vector view of GGE biplot showing the interrelationship among all the traits measured. Principal component (PC)1 and PC2 explained 55% of the total variation observed among the cultivars based on all the traits. The lines connecting each trait marker to the origin of the biplot are called the trait vectors and the length of each trait vector approximates the standard deviation of each trait (Yan et al., 2007). The cosine of the angle between the vectors of any two traits approximates the correlation coefficient (degree of association) between the traits. Trait vectors that are approximately at right angle are not closely related and traits that are at angle 180o (directly opposite) are negatively correlated (Yan et al., 2007). From Figure 5, DP, DHM50, DPM50, DHM1, DPM1, DFL1 and DPM50 were highly positively correlated and it shows they all gave similar information about variability among the genotypes. Considerable efforts, time and funds can be saved without sacrificing useful information if one or two traits are taking instead of all. Days to 50% flowering and 50% pod formation are closely correlated and taking any one of the two will give the same information with less effort. Grain yield was highly positively correlated with all the morphological traits, except peduncle traits, which had approximately negative correlation with it. Yield was also positively, but weakly correlated with the phenotypic traits. This means that the higher the values of these morphological traits, the more the grain yield. The morphological traits were not redundant. They were mutually exclusive and each supplies useful and unique information about the cultivars. This was indicated by various angle sizes and vector lengths displayed in the biplot. These results were in agreement with those reported by Imran et al. (2010). Traits suitable for indirect selection for improved grain yield. The biplot in Figure 6 is a vector view of the Auto Find QTL function of GGE biplot that selects and displays traits that have close association with a target trait among other traits. Based on the biplot, Y_PLT, PDY, SGR and YGR were identified as traits suitable for indirect selection for grain yield improvement. Thus, selecting for these traits is expected to lead to improved grain yield under optimal growing conditions. This suggests that selection index that incorporates these traits will not only result in the development of high yielding cultivars but with other desirable agronomic traits that enhance wide acceptability of such cultivars. ACKNOWLEDGEMENT Technical assistance of Mr Tanimojo, O.O. and other field staff of Obafemi Awolowo University, Teaching and Research Farm is highly acknowledged. REFERENCES
Copyright © 2011, African Crop Science Society The following images related to this document are available:Photo images[cs11019f6.jpg] [cs11019f4.jpg] [cs11019f2.jpg] [cs11019t2.jpg] [cs11019t1.jpg] [cs11019f3.jpg] [cs11019f1.jpg] [cs11019f5.jpg] |
| |||||||||
