 |
| About Bioline | All Journals | Testimonials | Membership | News |
|
||||||
|
||||||
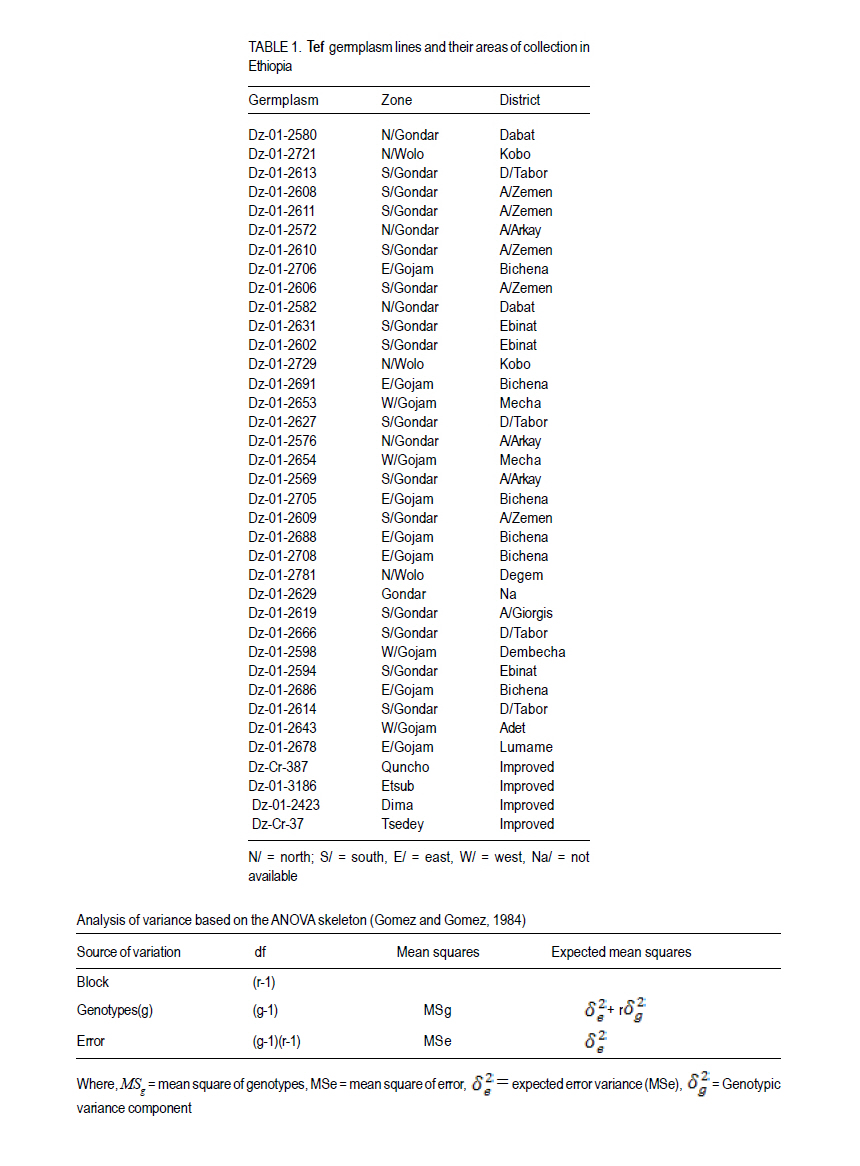
African Crop Science Journal, Vol. 19, No. 3, pp. 201-212 Multivariate Diversity, Heritability And Genetic Advance In Tef Landraces In Ethiopia Habtamu Ayalew, Tsige Genet1, Tadesse Dessalegn1 and Landuber Wondale Adet Agricultural Research Center P. O.Box 08, Bahir Dar, Ethiopia 1Bahir Dar UniversityCollege of Agriculture and Environmental Sciences Corresponding author: habtsh99@yahoo.com (Received 30 May, 2011; accepted 11 September, 2011) Code Number: cs11020 ABSTRACT Characterisation of exiting genetic variability is a prerequisite for further crop improvement activity. This study was designed to assess genetic variability among randomly selected Eragrostis tef, Zucc.Trotter (Tef) genotypes from five administrative zones in the Amhara region in Ethiopia. The experiment was conducted in 2010 main cropping season at Adet Agricultural Research Center. All traits, except first inter-node length showed highly significant differences among the 37 lines. Number of productive tillers per plant, grain yield per plant, and biomass yield per plant showed high phenotypic coefficients of variation; 18.9, 17.5 and 16.9% in that order. Harvest index (15.1%) showed the highest genotypic coefficient of variation while the lowest (3.5%) was for days to maturity. Heritability in broad sense was highest for days to heading (80.7%), followed by culm length (72.4%). Grain yield and shoot biomass yield showed heritability values of 54.6 and 57.3%, and GAM values of 18.9 and 20.6%, respectively. The first three principal components (PCs) with eigenvalues greater than one explained 75% of the observed variation. Four PCs were effective in explaining 93% of the variation among zones. Cluster analysis grouped the 37 lines into five real clusters, while zones of collection were grouped into three major clusters. These data are useful for future tef breeding/crop improvement programmes and undertakings. Key Words: Clusters analysis, principal component analysis, Tef RÉSUMÉ La caractérisation de la variabilité génétique existante est une Characterisation of exiting genetic variability is a préalable dans des activités d’amélioration cultural. La présente étude était conçue pour évaluer la variabilité génétique parmi les génotypes svlectionnés de tef Eragrostis, Zucc.Trotter (Tef) dans cinq zones admonistratives dans la région Amhara en Ethiopie. L’étude était conduit au cours de la saison culturale principale 2010 au Centre de Recherche Agricole Adet. Toutes les caractéristiques, excepté la longueur inter-node ont montré de différences significativement élevées parmi les 37 lignées. Le nombre de talles par plant, le rendement en grains par plant, et le rendement en biomasse par plant ont montré des coefficients de variation phénotypique élevés de 18.9, 17.5 et 16.9% respectivement. L’index de récolte (15.1%) a montré un coefficient de variation le plus élevé pendant que le coeffiecient génotypique le moins élevé (3.5%) était celui du nombre de jours à la maturité. L’héritabilité au sens large était plus élevée pour les jours relatives au heading (80.7%), suivi de la longueur du culm (72.4%). Le rendement en grains et le rendement en biomasse de tiges ont montré des valeurs d’héritabilité de 54.6 et 57.3%, et les valeurs de GAM de 18.9 et 20.6%, respectivement. Les trois premiers composantes principales (PCs) avec des valeurs eigen plus grandes que un, ont expliqué 75% de la variation observée. Quatre PCs ont effectivement expliqué 93% de la variation parmi les zones. L’analyse par groupements, a groupé les 37 lignées en cinq groupements réels, pendant que les zones de collection étaient groupées en trois groupements majeurs. Ces données sont sont utiles pour dans le programme d’amélioration du tef. Mots Clés: Analyse par groupement, analyse du composant principal, Tef Tef (Eragrostis tef (Zucc.) Trotter) belongs to the family Poaceae, subfamily Eragrostoideae, tribe Eragrosteae and genus Eragrostis. It is a C4, selfpollinated, chasmogamous annual cereal. It has a fibrous root system with mostly erect stems, although some cultivars are bending or elbowing types (Ayele, 1999).The genus contains about 350 species of which tef is the only cultivated species. The common name of the crop in Ethiopia is tef which seems to be derived from the Amharic word ‘tefa’ to mean ‘lost’ to reflect the small size of the grain which disappears if scattered on the ground (Ketema, 1997). Several endemic and non-endemic species of Eragrostis; some of which are considered to be the wild relatives of tef, are found in Ethiopia. Genetic diversity for tef exists nowhere else in the world, except in Ethiopia which indicates that tef is originated and was domesticated in Ethiopia (Ketema, 1997). Fifty four Eragrostis species are found in Ethiopia, out of which fourteen are known to be endemic. Worldwide, Africa contributes 43% of the genus, while South America contributes 18%. Likewise, 12, 10, 9, 6 and 2% of the genus Eragrostis is from Asia, Australia, Central America, North America, and Europe, respectively (Ketema, 1997). Gojam, Gonder, Wello, Shewa and Welega are the major tef producing areas in Ethiopia. It is widely grown in both high potential and marginal production areas. These areas include most parts of the vertisols that suffer from water logging, and other soil types in different parts of the country that suffer from low moisture stress. The Central Statistics Agency report (CSA, 2008) indicate the area covered by tef to be 2.56 million hectares covering 28.29% of the total land allotted to cereals. In the same report, an annual production of 2.99 million tonnes of tef grain was recorded contributing 21.85% of the total cereal produce. Understanding the pattern and extent of genetic diversity in a population is pivotal to the success of any crop improvement programme. It can provide valuable information for plant breeders who are interested in introgressing agronomically desirable traits into established cultivars or to select lines from the existing diversity. To this end, there had been efforts in tef germplasm collection and characterisation in the country. Ketema (1997) reported that there were about 3,843 accessions and the need for further collection as there were areas not addressed. According to Demisie (2001), there were 4,395 tef accessions, out of which about 1,100 were from Amhra region. The existence of broad variation in many of the phenotypic traits has been demonstrated by several previous studies on tef germplasm (Ketema, 1993; Tefera et al., 2003; Asefa et al., 1999, 2001, 2003a; Chanyalew et al., 2009). Seed storage protein analyses showed polymorphism among tef cultivars (Bekele et al., 1995). But Bai et al. (2000) reported a relatively low level of DNA polymorphism using RAPD markers. On the other hand, inter-simple sequence repeats (ISSR) analysis showed great diversity among tef cultivars (Asefa et al., 2003b). However, these efforts were not all inclusive since Ethiopia has a huge endowment of tef genetic diversity. In fact activities to characterise, classify and identify the regional genetic wealth are minimal. Therefore, this research was undertaken to assess the genetic diversity, heritability and genetic gain of tef lines from the Amhara region in Ethiopia. MATERIALS AND METHODS Experimental site. The field experiment was conducted at Adet Agricultural Research Center in 2010 main cropping season. Adet is located at 37°29 ´E and 11°16 ´N in the Amhara National Regional State at an altitude of 2240 metres above sea level. It receives mean annual rain fall of 1230 mm. Experimental procedures. Landraces from the former province of Gojam, Gondar, and Wollo, were accessed from Debrezeit Agricultural Research Center. Improved varieties from both late(Dz-Cr-387, Dz-01-3186,Dz-01-2423) andearly (Dz-Cr-37) sets were included, totaling the test materials to 37 (Table 1). The experiment was laid out in randomised complete block design with three replications. A plot size of 1 m x 0.2 m was used with 1 m and 2 m inter row and between block distance, respectively. Based on the recommended seed rate of 30 kg ha-1, 0.6 g of seed was broadcasted on the surface of the plots. At tillering, the plants in each plot were thinned to 5 cm plant-to-plant spacing to ease individual plat inspection. Data collection and analysis. Main tillers of five randomly selected plants in each plot were pretagged and evaluated for fourteen quantitative traits (Table 3). Days to heading, and maturity were estimated on plot basis. Prior to the actual data analysis, traits that deviated from normal distribution were transformed using different transformation methods. The first and second inter-node lengths were normalised by square root transformation while; number of nodes per culm, number of productive tillers per culm and shoot biomass yield were log10 transformed. Grain yield was double log10 transformed, all satisfying the requirement of normal distribution. For all analyses, SAS Version 8 statistical software was used. Analysis of variance was conducted based on the ANOVA skeleton below (Gomez and Gomez, 1984). The linear model of the experiment was:
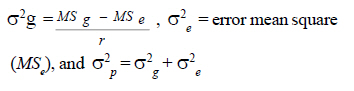
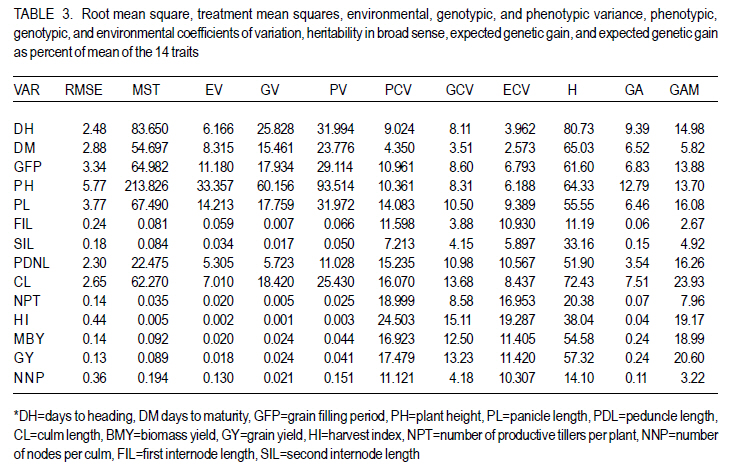
Where, Yij =observed variation, μ =overall mean, gi = effect of the ith genotype, rj =effect of the jth replication, and εij =experimental error. The genotypic and phenotypic variance components were estimated based on the following formula (Sharma, 1998).
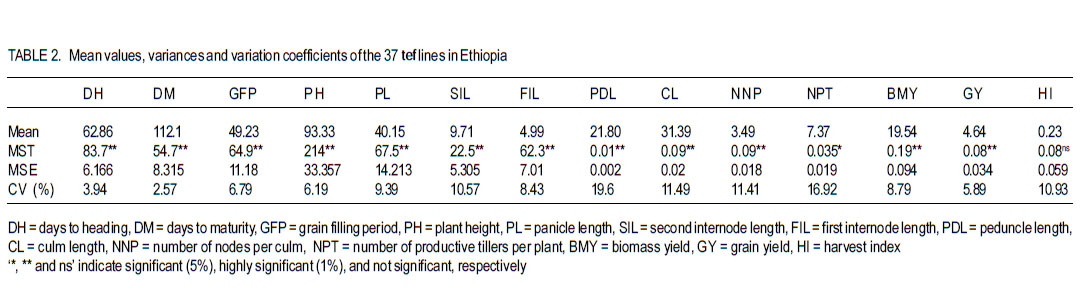
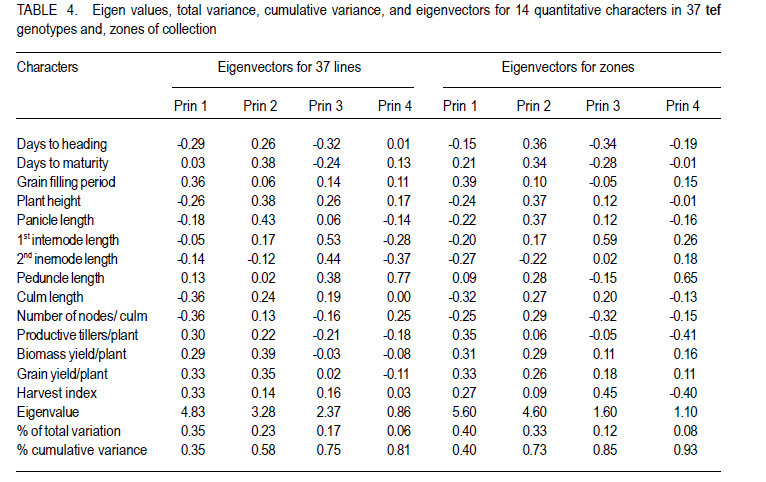
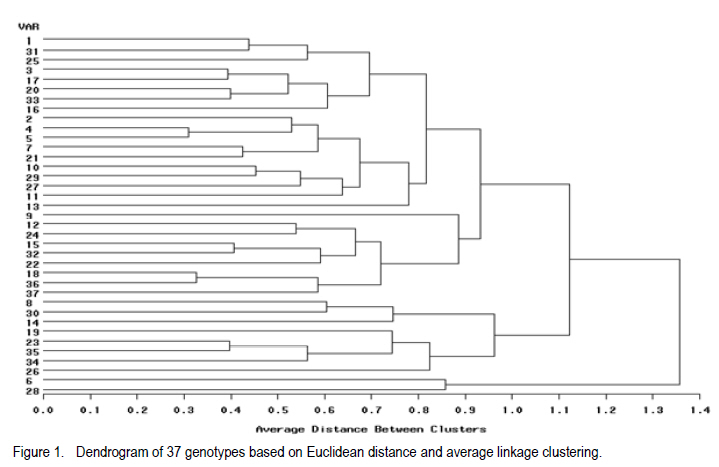
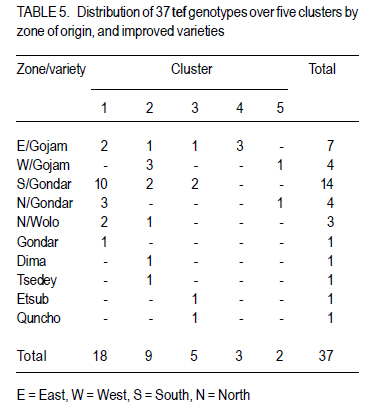
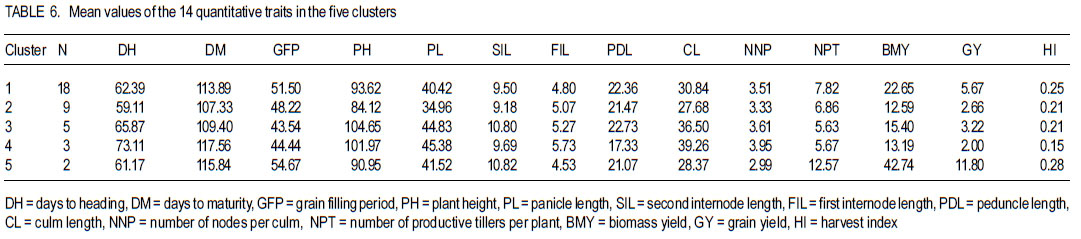
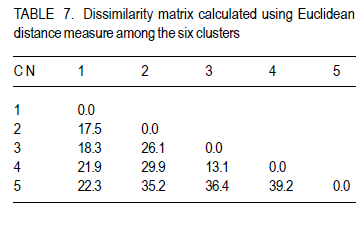
Where, MSg = mean square due to genotypes, MS e = environmental variance (error mean square), σ 2p= phenotypic variance, and r = the number of replication. Phenotypic (PCV), genotypic (GCV), and environmental (ECV) coefficients of variation were computed as the square roots of the respective variances divided by their mean and converted in to percent. Heritability in broad sense was computed as the ratio of genotypic variance to phenotypic variance, i.e., H=GCV/PCV*100% (Falconer, 1989). Expected genetic advance for each character at 5% selection intensity (K=2.056) was computed using the methodology described by Johnson et al. (1955). Genetic advance, as percent of mean, was also calculated to compare the extent of predicted genetic gain of different traits under selection. For multivariate analysis, the mean values of the 37 lines were used. Prior to multivariate analysis, data were standardised to mean zero and variance one to avoid differences in measurement scale. Principal component analysis was computed to reduce the number of variables into a few uncorrelated components that can explain much of the variability. It also helps to identify traits that load most in explaining the observed variation. PCs with eigenvalues greater than unity were considered important in explaining the variability. The PROC PRINCOMP of SAS version 8 (SAS Institute, 2000) was used for principal component analysis. Euclidean distance between each line for mean values of each variable was used as a measure of genetic divergence for clustering. Cluster analysis was done on the genetic distance matrix of the lines to envision their grouping pattern. The PROC CLUSTER of SAS Version 8 (SAS Institute, 2000) using Unweighted Pair Group Method using Arithmetic Average linkage (UWPGMA) was employed. The number of clusters was determined based on the pseudo F and t2 values. RESULTS Hierarchical analysis of variance for the different zones showed significant differences for different traits (Table 2). In accessions from east Gojam, highly significant (p<0.01) differences were observed for phenological traits, i.e., days to heading, days to maturity and grain filling period. Significant differences (P<0.05) were recorded for plant height, peduncle length and culm length among these genotypes. However, yield and yield related traits like number of productive tillers per plant, panicle length, biomass yield, grain yield and harvest index were not significantly different for these genotypes (Table 2). But for accessions from west Gojam, differences in biomass yield, grain yield, harvest index, days to heading and days to maturity were highly significant (P<0.01). Genotypes from south Gondar were significantly different for most of the traits (Table 2). Differences in days to heading, days to maturity and grain filling period, plant height, panicle length, culm length, and peduncle length were highly significant (P<0.01). But yield related traits like biomass yield, grain yield and grain filling period were not significantly different. Unlike collections from Gojam, differences in number of nodes per culm, number of productive tillers per plant, and second inter-node length were highly significant in south Gondar. Improved varieties were significantly different for days to heading and days to maturity (Table 2). Highly significant differences were also recorded for plant height, panicle length, peduncle length, and culm length. But these varieties were not significantly different for biomass yield and grain yield. For days to heading, Quncho was significantly different from the rest of the varieties except Etsub. Tsedey was the earliest of the varieties confirming earlier findings (standard check for earliness) in this zone. The same scenario was observed for days to maturity, except that the latest maturing was Etsub, though not significantly different from Quncho. Based on plant height, the four varieties were grouped into three; Quncho being the longest followed by Etsub. There were significant differences between Quncho and the rest of the varieties, and also Etsub and the remaining two varieties for culm length. But for biomass yield grain yield and number of productive tillers per plant, differences were only numeric. Generally, there was strong evidence that the 37 accessions were highly variable for all the quantitative traits except first inter-node length. Estimation of genetic parameters. Phenotypic coefficients of variation ranged from 4.35 (days to heading) to 24.5 % (harvest index) (Table 3). Relatively higher PCV values were observed for number of productive tillers per plant, grain yield per plant, and biomass yield per plant. Moderate to high PCV values were also observed for panicle, peduncle and culm length. PCV values were lower for days to heading, days to maturity and second inter-node length than the rest of the traits. Harvest index showed the highest GCV, while days to maturity was the one with the lowest GVC value. Environmental coefficients of variation ranged from 2.6% (days to maturity) to 19.3% for harvest index. Comparable ECV values (14.4%) were observed for grain yield and shoot biomass yield. Heritability in broad sense was highest for days to heading, followed by culm length (Table 3). Generally, most of the traits showed moderate to high heritability values. Grain yield and shoot biomass yield showed heritability values of 54.6% and 57.3%,respectively. Grain fillingperiod, plant height, and days to maturity also had high heritability values. Genetic gain was also divergent across the test materials. Culm length showed the largest GMA (Table 3) value; while first inter-node length was the lowest. Principal component analysis. Of the total variation, 81% was explained by the first four PCs out of the fourteen PCs employed. Eigen values were greater than one only for the first three PCs, which together explained 75% of the observed variation. Therefore, three PCs were retained to explain the observed variation without losing a substantial variability to be explained. The first PC explained about 35%, the second 23%, and the third explained 17% of the variation. Grain filling period, culm length, number of nodes per culm, number of productive tillers per plant and harvest index showed greater loadings in the first PC (Table 4). Similarly, days to maturity, plant height, panicle length, biomass yield and grain yield contributed in the second PC; while days to heading, first inter-node length, secondinter node length and peduncle length were significant in the third PC. Principal components analysis on the zonal average data was effective in that only the first four PCs were able to explain about 93% of the total variation. The first PC explained 40%, the second 33%, and the third 12% of the variations observed among the different zones of collection and the two sets (early and late sets) of improved cultivars. Grain filling period, culm length, number of productive tillers per plant, biomass yield and grain yield showed greater loadings in the first PC (Table 4). Similarly, days to heading, days to maturity, plant height, panicle length, and peduncle length, were important in the second PC; while the second inter-node length, number of nodes per culm and harvest index were significant in the third PC. In the fourth PC, peduncle length and number of productive tillers were important traits. Cluster analysis. Average linkage, single linkage, and complete linkage were tried, but clearer and more understandable clustering was achieved by average linkage clustering (Fig. 1). The number of clusters was determined based on the pseudo F and t2 values which classified the test materials in to five real clusters each being able to be classified further. The number of accessions in each cluster varied from two in cluster five to eighteen in cluster one. Cluster one consisted of 18 genotypes, which were mixes of lines from four zones. Ten of them were from South Gondar, 3 from north Gondar, 2 from north Wollo and 2 from east Gojam (Table 5). Similarly, cluster two was composed of lines from four zones and two improved varieties, while cluster three had 4 lines from Gojam, 2 lines from south Gondar, and the other 2 improved varieties. Members of the fourth cluster were only from east Gojam, while that of cluster five were from north Gondar and west Gojam, one from each. Cluster one was more heterogeneous than others. Lines in cluster two were the earliest, the shortest; in plant height panicle length, both first and second inter-node lengths; and culm length, and the least yielding ones in biomass. Cluster three consisted of 5 lines in which the longest average peduncle length was recorded. The period required to fill was also shortest in this cluster. Average plant height was highest for lines in cluster three. The latest lines, both in days to heading and days to maturity were clustered in cluster five (Table 6). Culm length and number of nodes per culm were also highest in this cluster. Low grain yield and harvest index were characteristics of the cluster four. Of all clusters, cluster five consisted of lines that were high yielder both in biomass and grain yield. The number of productive tillers was also highest in this cluster, and conformed with the recorded biomass and grain yield; whereas the number of nodes per culm was the lowest. Inter-cluster distance. The longest genetic distance was measured between clusters four and five while the shortest one was measured between clusters three and four (Table 7). Alltraits studied were highly significantly different, except for first inter-node length. Cluster analysis on the different germplasm sources, i.e., the five zones of collection, and improved varieties was also done based on the correlation matrix and pair wise Euclidean distances among the entities. As a result three major clusters were determined based on the pseudo F and t2 test criterion. The first cluster consisted of four zones of germplasm collection namely south Gondar, north Gondar, north Wollo and one accession from Gondar whose exact zone of collection was not available. The second and third clusters consisted of three entities each. In the second cluster were the improved varieties Quncho, and Etsub, and the mean values for east Gojam, while the last cluster was composed of the improved varieties, Dima and Tsedey, and the mean value of lines from West Gojam. DISCUSSION There was a large diversity for all traits, except for the first inter-node length (Table 2); but this variability was not uniform across zone of collection indicating the possibility of selection for different traits in different zones. For instance, lines from east Gojam were highly variable for plant height, panicle length and for phonological traits; while those from west Gojam were significantly different for biomass and grain yield. However, in this particular study the sample size was not uniform across zones of collection, so a different scenario may be observed especially for those claimed non-significant if samples are increased and equally sized to validate the zonal comparison. The present study is in agreement with many of previous findings in tef germplasm (Ketema 1993; Tefera et al., 2003; Asefa et al., 1999, 2001, 2003a; Chanyalew et al., 2009). Improved varieties were significantly different for days to heading and days to maturity (Table 2). This was however, predictable in that improved lines were included from both late and medium maturing varieties. Highly significant differences were also recorded for plant height, panicle length, peduncle length and culm length. But these varieties were not significantly different for biomass yield and grain yield. This is also true because improved lines are highly selected especially for grain yield so that much of the variability is lost through selection. Relatively higher GCV (12.5-15.11)values were observed in harvest index, grain and biomass yield and culm length; while days to heading, grain filling period, plant height, panicle length and number of productive tillers per plant showed intermediate GCV values. Similar findings with relatively higher GCV values were reported by Tefera et al. (2003), Asefa et al. (1999) and Chanyalew et al. (2009). Unlike these findings, the present study showed highest GCV in harvest index, which was intermediate in all those studied. Discrepancies between GCV and PCV was high for harvest indices and number of productive tillers per plant (Table 3), indicating the high proportion of ECV which is the contribution of non-additive gene effects. Therefore, selection for these traits may not be proportional to the observed variation as the proportion of additive gene effect is low. This was manifested by the low heritability value for these traits, though heritability alone does not determine the predicted improvement of a trait. Days to heading showed the highest heritability value followed by culm length (Table 3). Grain and shoot biomass yield, grains filling period, plant height, and days to maturity had high heritability values. However, this does not mean that these values guarantee success in selection because resemblance between relatives is controlled by the proportion of the additive genes, not by all of the genetic variation (Falconer and Mackay, 1996). Asefa et al. (2001) reported similar kind of heritability values for days to heading and peduncle length. But, in this particular report heritability value for grain yield and biomass yield were lower than the ones recorded in the present study. This confirms that heritability values vary with the nature of the test materials and the area where the experiment is conducted. Heritability, coupled with genetic gain at specified selection intensity, is a reliable tool to guide selection. As such, in this study, a change in rank was observed among lines with high heritability values, rendering only small genetic gain in selection. High GA values were recorded in culm length, grain yield and harvest index different from the rank for heritability values. A trend similar was reported by Asefa et al. (1999). Generally, lines in this study showed figures of significant magnitude pointing to the possibility of screening promising lines for yield. Principal component analysis reduced the 14 variables (characters) to three uncorrelated components (principal components) each having eigenvalues greater that one. The first PC explained about 35% of the variation, which was mainly due to variations in grain filling period, culm length, number of nodes per culm, number of productive tillers per plant and harvest index (Table 4). Similarly, days to maturity, plant height, panicle length, biomass yield and grain yield had greater loadings (contribution) in the second (23%) PC; while days to heading, first inter nodelength, second inter-node length and peduncle length were significant in the third principal component. The result of PCA is also in agreement with variance analysis results in that it was only 75% of the total variation that was explained by the first three PCs. This indicates the complexity in variability in these lines. The first five PCs were reported to explain 79% of variation in sorghum (Sorghum bicolor) germplasm by Ayana et al. (1999); while in mustard (Brassica carinata) 96.01% of variation was explained by the first five PCs each having eigenvalues greater than unity (Genet et al., 2005). Principal components analysis on the zonal average data and the four improved varieties was effective in that only the first four PCs were able to explain about 93% of the total variation. The first PC explained 40%, the second 33% and the third 12% of the variations observed among the different zones of collection and the two sets (early and late sets) of improved cultivars. Similarly, the first four PCs explained 93.9% of regional variation in tef germplasm (Asefa et al., 2003a). Unweighted Pair Group Method using ArithmeticAverage linkage (UWPGMA) grouped the 37 tef lines in to five real clusters each consisting 2 to 18 lines (Fig. 1). The number of clusters was determined based on the pseudo F and t2 values such that the pseudo F reaches its pick and at the same time it is larger than values before and after it in the list, while the pseudo t2 being at its minimum. This procedure also fulfills the way of determining the number of clusters such that each cluster has to have at least two members (Ayana et al., 1999). Cluster one was the most heterogeneous consisting of lines from all the five zones, except west Gojam (Table 5). Ten of the 14 lines from south Gondar were grouped in cluster one in which two lines from east Gojam and north Wollo each, and three from north Gondar were included. A line from Gondar was also included in this cluster, though its zone of collection was not known. Short first inter-node length was the distinguishing feature of this cluster. This cluster was second to cluster five in biomass yield, grain yield and harvest index. Generally, clustering does not strictly apply to the zones of collection in that lines were mixed in all clusters except the third cluster, which solely contained lines from east Gojam. Similar findings were reported by Ayana et al. (1999) on sorghum and Asefa et al. (2003a) on tef accessions in that a clear cut differentiation of lines in to their region of origin was not apparent. However, the improved varieties Dima and Tsedey were in a group, while Quncho and Etsub were grouped together in another cluster. Cluster two which encompassed Dima and Tsedey, had nine lines which were aggregates from all zones of collection, except north Gondar. This cluster was characterised by the earliest, the shortest; in plant height panicle length, both first and second inter-node lengths and culm length. They were the least yielding ones in biomass. This indicates the possibility of developing lines adapted to drought prone areas or where early cessation of rainfall is prevalent. Early maturing lines can also be developed to fit a double cropping system. CONCLUSION This study has revealed the presence of large genetic diversity both within and among zones of Tef genotypes collection. It also indicates the need for giving equal emphasis to all zones during collection as they are diverse in the germplasm pool they house. Hybridisation can also be done among lines from divergent clusters to create heterotic lines and to enrich the existing diversity. ACKNOWLEDGEMENT Adet Agricultural Research Centre is acknowledged for financing this study. Debrezeit Agricultural Research Centre provided landraces; while the improved varieties were accessed from Adet Agricultural Research Centre, tef breeding project. REFERENCES
Copyright © 2011, African Crop Science Society The following images related to this document are available:Photo images[cs11020t6.jpg] [cs11020f2.jpg] [cs11020t2.jpg] [cs11020t3.jpg] [cs11020f1.jpg] [cs11020t5.jpg] [cs11020t1.jpg] [cs11020t7.jpg] [cs11020t4.jpg] |
| |||||||||
