 |
| About Bioline | All Journals | Testimonials | Membership | News |
|
||||||
|
||||||
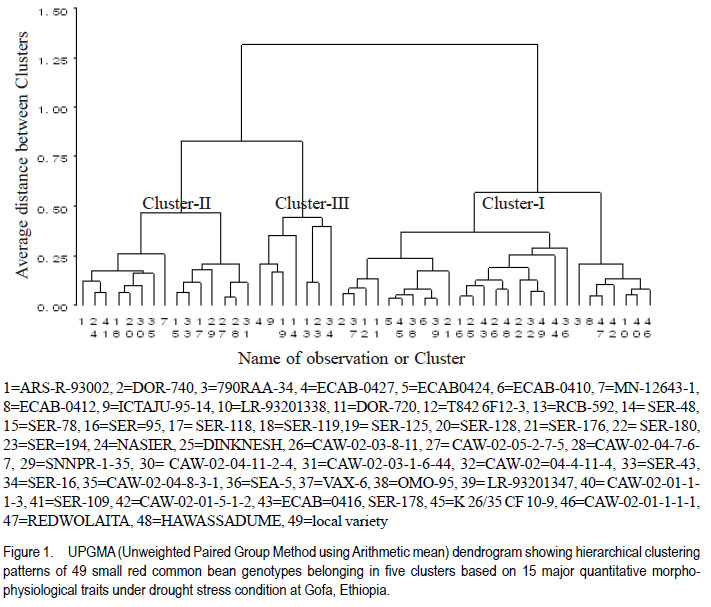
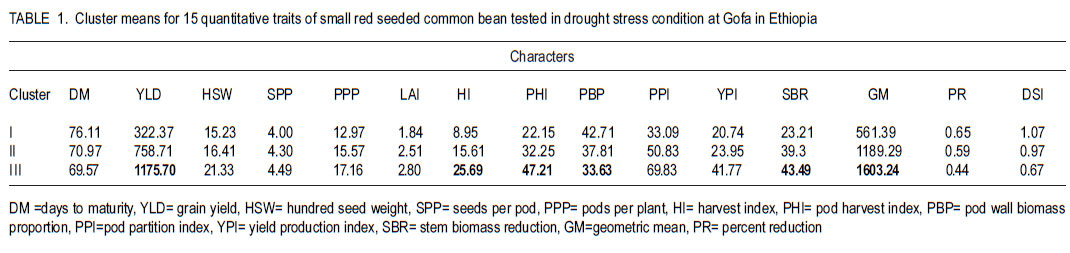
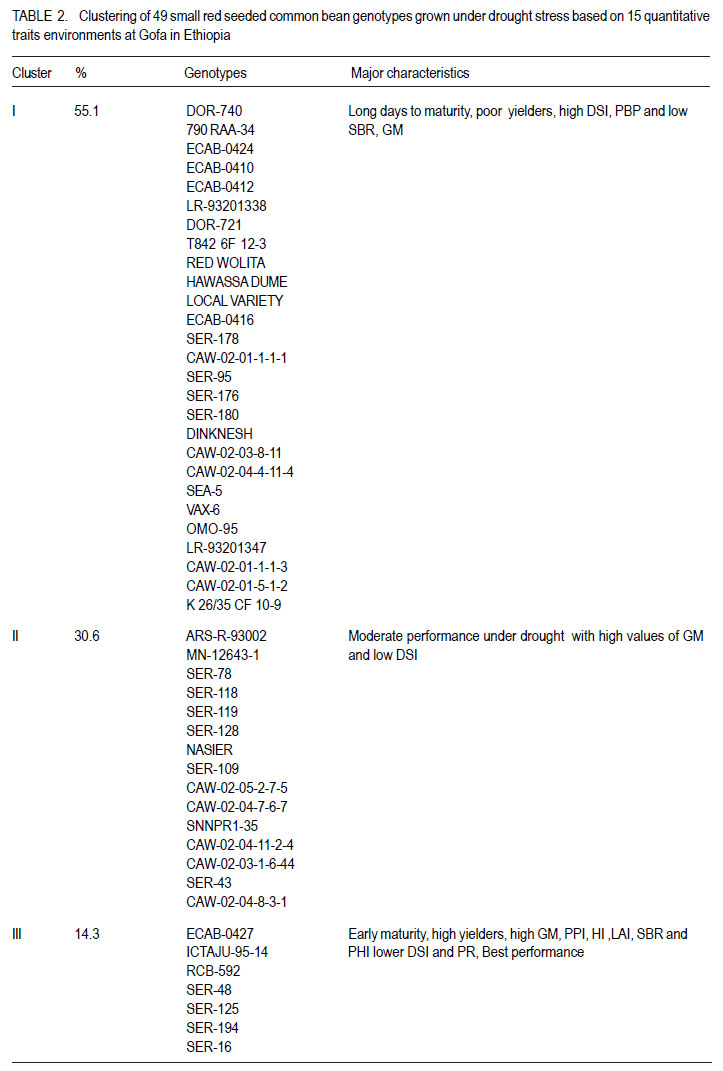
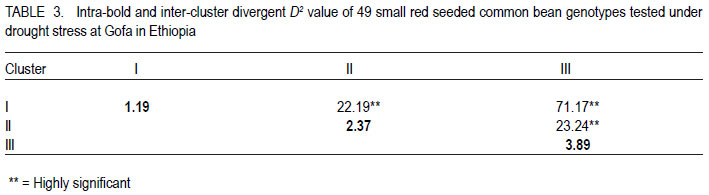
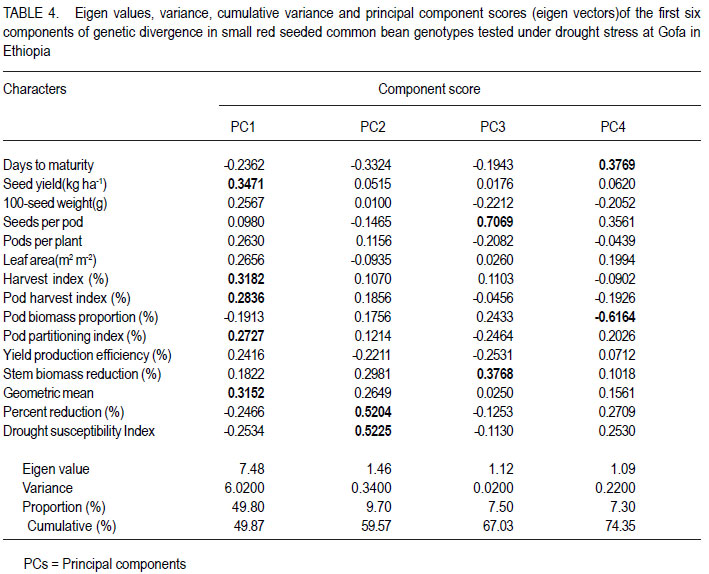
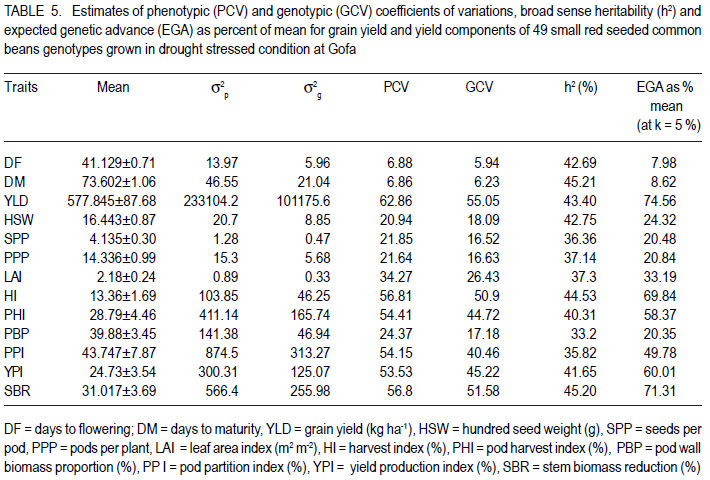
African Crop Science Journal, Vol. 19, No. 4, 2011, pp. 303-311 Genetic variation for drought resistance in small red seeded common bean genotypes Yayis Rezene, Setegn Gebeyehu1 and Habtamu Zelleke2 Areka Agricultural Research Center, P.O. Box 79, Areka Ethiopia Code Number: cs11028 ABSTRACT Common bean (Phaseolus vulgaris L.) productivity is low in major growing regions of Ethiopia mainly due to drought, caused by low and erratic rainfall. A field experiment was carried out at Gofa in Southern Ethiopia, to assess genetic variability for drought resistance in forty-nine small red seeded common bean genotypes of both local and foreign origin. The genotypes were evaluated under two soil moisture regimes, non-stress (NS) and drought stress (DS). Drought stress was initiated at flowering by withholding application of irrigation water. The average linkage method of clustering grouped the forty-nine genotypes grown under drought stress condition in five clusters. The maximum distance was found between Cluster I and Cluster III. Pattern of variation examined through principal component analysis (PCA) involving morpho-physiological traits showed that the first four PCs accounted for more than 74% of the total variation, of which 59.9% was contributed by the first two PCs. The first principal component alone explained 49.9% and was highly correlated with seed yield, harvest index and geometric mean. The second PC explained 9.7% of the total variation and was highly correlated with days to maturity and drought susceptibility index. Both PCs had higher relative contributions to the total diversity and were the ones that most differentiated the genotypes. Key Words: Genetic distance, PCA, Phaseolus vulgaris RÉSUMÉ La productivité du haricot commun (Phaseolus vulgaris L.) est basse dans beaucoup de régions productrices ethiopiennes principalement due à la sécheresse et aux pluies irrégulières. Un essai sur terrain était mené à Gofa au Sud de l’Ethiopie, pour évaluer la variabilité génétique, pour résistance à la sécheresse dans quarante quatre génotypes de petits grains de haricot rouges, tous d’origine locale et exotique. Les génotypes étaient évalués sous deux régimes d’humidité de sol, non-stress (NS) et stress hydrique (DS). Le stress hydrique était initié à la floraison par la réduction de l’eau d’irrigation. A l’aide de la méthode de la moyenne des liens des groupements, quarante neuf génotypes plantés en condition de stress hydrique étaient classés en cinq groupes. La distance maximale était trouvée entre le groupe-I et le groupe-III. Le mode de variation examiné par l’analyse de la composante principale (PCA) impliquant des traits morpho-physiologiques a montré que les quatre premiers PCs comptaient pour plus de 74% de la variation totale parmi lesquels 59.9% étaient induits par les deux premiers PCs. Le premier composant principal expliquait seul 49.9% et était hautement correlé avec le rendement en grains, l’index de récolte et la moyenne géométrique. Le second PC a expliqué 9.7% de la variation totale et était hautement corrélé avec les jours à la maturité et l’index de susceptibilité à la sécheresse. Tous les PCs offraient des contributions élevées à la diversité totale et étaient celles qui avaient différenciées le plus les génotypes. Mots Clés: Distance génétique, PCA, Phaseolus vulgaris INTRODUCTION Common bean (Phaseolus vulgaris L.) is one of the principal grain legumes of eastern and southern Africa, occupying more than 4 million hectare annually. It provides food for more than 100 million people (Wortmann et al., 1998). In Ethiopia, common bean has been known as an export crop, contributing to foreign exchange earnings. Hence, in 2008 Ethiopia earned 36.2 million United States dollars from common bean export (Ethiopia Custom Authority, 2009, unpublished). Drought stress is the single greatest abiotic factor contributing to common bean yield loss in southern Ethiopia (SARI, 2007). In most common bean growing regions, rainfall is erratic in distribution yet the soil is often sandy with low moisture holding capacities (Belay and Struik, 1993). However, drought resistance has not been top in the breeding agenda in the common bean improvement programme in the country. Efforts have been made for the improvement of common bean for biotic stress by the National Bean Research Programme and RARI’s; but relatively little attention has been made for the evaluation and development of resistance common beans varieties to moisture stress areas, with focus on drought (Asrat et al., 2006; Chemeda and Buliti, 2006). Assessment of genetic diversity in common bean genotypes under drought stress environments would facilitate development of cultivars for specific production constraints by providing an index of parental lines to be used in breeding programmes. To this end, genotypic variation for drought resistance in small red seeded common bean genotypes is considered a key approach in crop improvement to minimise crop failure and improve food security of small scale farmers through genetic improvement where these types of beans are predominantly grown. This study was undertaken to examine the level of genetic variation within red common bean genotypes under drought stress environment in Ethiopia. MATERIALS AND METHODS The study area. The experiment was carried out at Gofa in southern Ethiopia. The experimental site is located at 1348 metres above sea level and lies at 06o 18´ 17.6´´ N latitude and 036o 50´28.5´´ E longitude. The area receives mean annual rainfall of 758.5 mm and experiences annual maximum and minimum temperatures of 29.3 and 17.2 oC, respectively. Plant materials. Forty-nine small red seeded common bean genotypes, constituted inbred lines and released varieties obtained from Awassa Agricultural Research Center in Ethiopia and introduction made from the Centro Internacional de Agricultura Tropical (CIAT) were used in the study. The inbred lines represented SER and SEA families, developed for specific adaptation to drought stress by CIAT; ECAB lines developed for East and Central African Bean growing environments and introduced by the National Bean Research Programme. The CAW and SNNP lines generated through crossing at Awassa Agricultural Research Centre were, five of the varieties released for wider or specific adaptation and a popular local variety cultivated in the area was also included. Treatments and design. The forty-nine genotypes were evaluated in 7 x 7 simple lattice design. Each genotype was planted on a plot made of two rows of 4 m length, with a row-to-row distance of 60 cm, and a plant-to-plant spacing of 10 cm. To measure important drought resistance traits, the genotypes were grown under two soil moisture regimes; namely, non-stress (NS) and drought stress (DS) conditions. Both watering regimes were managed uniformly, following research recommendations (Asrat et al., 2006). The total rainfall during the crop development period was 280 mm. For drought stressed treatments, drought was initiated at flowering by withholding application of irrigation. Depending on the rainfall gravity, irrigation at field capacity were applied every 10 to 12 days from planting until physiological maturity in the non-stress. Water balance for each application was calculated based on excess or deficit water in the bean root zone relative to field capacity. Since the experiment was conducted during the dry season, rain fall was minimal in the experimental period. Soil moisture measurements were made at depths of 0-30, 31-60 and 61-90 cm at 10 days intervals between planting and physiological maturity. Irrigation was applied when the root zone water deficit equaled the maximum allowable 40% depletion of the available soil water. The soil moisture was monitored gravimetrically by oven-drying the soil sample at 105 °C for 24 hours to obtain the dry weight for each sampled plot. For the drought treatment, a total of 3 irrigations were applied (each about 40.5 mm) and supplemental irrigation was suspended after 80% of each plot flowered until the crop was physiologically mature. But the control plots were kept irrigated for the period, and in this case a total of 6 irrigations were given (each 40.5 mm). Data collection. Days to flowering and to maturity were recorded as the number of days from planting to when 50% of plants in a plot had at least one open flower and when 75% of plants in a plot had at least 90% of their pods dried, respectively. Leaf area index (LAI) was calculated as the ratio of total leaf area to ground area occupied by the plant computed using the CIAT protocol (Rao et al., 2007).Total leaf area was determined by measuring the area of three leaves from top, middle and lower part of three randomly taken plants from each plots using CID-202 leaf area meter (CID, Inc., USA). Pod harvest index (PHI), pod wall biomass proportion (PBP) and pod partitioning index (PPI) were generated following the drought phenotypic protocol (CIAT, unpublished). Seed yield and yield components (number of pods per plant, number of seeds per pod and 100-seed weight) were determined as described in CIAT (1995). Harvest index (HI) was calculated as the ratio of seed yield to total above-ground biomass multiplied by hundred. Geometric mean (GM) and drought sensitivity index (DSI) were calculated following the methods employed by Fernandez (1993) and Fisher and Maurer (1978), respectively. Data analysis. Clustering of genotypes was performed by average linkage method of SAS software (2001) using fifteen traits that were found to be significantly different among the genotypes. The pseudo F statistic and the t2 statistics were examined to decide the number of clusters. Genetic distance between clusters as standardised D2 statistics were calculated according to Mahalanobis (1936). RESULTS Clustering genotypes. The average linkage technique produced three clusters of the 49 small red seeded genotypes (Fig. 1), where by individuals within any clusters were more closely related for tolerance to drought than were individuals in different clusters. The first Cluster was the largest and included twenty seven (55.1%) genotypes. Cluster II comprised fifteen (30.6%) genotypes, in which six genotypes were from Awassa Agricultural Research Center and eight from CIAT; as well as one released variety NASIER. Cluster III included the best performing seven genotypes (14.3%), in which all of the genotypes were from CIAT out of which four materials were SER lines. Late maturing small red seeded bean genotypes grown under drought stressed were represented in Cluster I. On the other hand, early maturing small red seeded genotypes were included in Cluster III. Cluster III included genotypes with the highest harvest index and pod harvest index compared with Cluster I. Under drought stress, genotypes which gave superior yields with less yield reduction and with lower drought susceptible indices were grouped in Cluster III. Whereas, those genotypes when exposed to drought with poor yield, high reduction and high drought susceptible indices were grouped in Cluster I. The second best performing genotypes with average seed yield, relatively less percent yield reduction and smaller drought susceptible index were grouped in Cluster II. Cluster III that comprised of small red beans with early maturing, higher HI and less DSI genotypes produced relatively higher seed yield than Cluster I. Early maturing genotypes which were grouped in Cluster III relatively escaped moisture stress and produced better seed yields. Among the genotypes, ECAB-0427, ICTAJU95-94, RCB-592, SER-48, SER-125, SER194 and SER-16 were the most promising due to their better yielding ability under drought stress conditions. Cluster analysis of the fifteen quantitative traits revealed that those genotypes in Cluster I had a high drought susceptibility index (DSI), pod wall biomass proportion (PBP) and lower seed biomass reduction (SBR) than Cluster III (Table 1). Under drought stress, twenty seven genotypes performed poorly in terms of yield; with lower leaf area index (LAI), harvest index (HI), pod harvest index (PHI) and geometric mean (GM). They further had higher mean values of percent reduction (PR) and drought susceptible index (DSI). Among the released small red seeded genotypes, four varieties (OMO-95, HAWASSADUME, RED WOLIYTA and DINKENESH) comprised the first Cluster. NASEIR (most popular variety) was in the second Cluster (Fig. 1 and Table 2). Divergence analysis. The pair-wise generalised square distance (D2) among the three clusters is presented in Table 3. The maximum distance was found between Cluster I and Cluster III (D2= 71.17), followed by Cluster II and III (D2 = 23.24). The genetic divergences between the Clusters were highly significant (P<0.01). Principal component analysis. Four of the 15 principal components explained more than 74% of the variations encountered (Table 4). The first principal component accounted for 49.9% of the variation, and illustrated primarily the variations in seed yield, pods per plant, harvest index, pod harvest index and yield geometric mean had relatively higher values of PC1. The second principal component accounted for an additional 9.7% of the total variation, and described primarily the patterns of variation in percent reduction and drought susceptible index. The third component gave emphasis on the seeds per pod and stem biomass reduction (Table 4). The PCA showed that the first four PCs accounted for more than 74% of the total variation, of which 59.9% was contributed by the first two PCs (PC 1 and PC 2). Characters in PC1 had a higher relative contribution to the total diversity and they were the ones that most differentiated the genotypes. Under drought stress environments, the genotypic variance took relatively much of the total variances for seed yield, harvest index, pod harvest index, pod wall biomass proportion, pod partitioning index, yield production efficiency and stem biomass reduction (Table 5). Under the same growth condition, the estimate of broad sense heritability varied from 33.2% for pod wall biomass proportion to 45.2% to days to maturity (Table 5). On the other hand, relatively lower variance shares of the total variance were observed for number of days to flowering, days to maturity, pods per plant, seeds per pod and leaf area index indicating the over masking effect of the environmental variance in total variability. DISCUSSION The terminal drought stress imposed during reproductive development in this study is comparable to drought stress encountered in many bean production zones due to limited amount and erratic distribution of rainfall. The presence of genetic variability for morphophysiological traits of drought resistance detected in small red seeded common bean genotypes is due to the differential response of the genotypes to the stress imposed. Similar results on the presence of genetic variability in common bean for drought resistance in Durango, Mexico and at Michigan, USA were reported by Acosta and Adams (1991) and Beebe et al. (2000). Maximum genetic recombination and variation in subsequent generations is expected from crosses that involve parents from clusters characterised by maximum distance. Crosses between genotypes selected on the basis of special merits are, therefore expected to provide relatively better genetic recombination and segregation in their progenies. It is normally assumed that characters with larger absolute values closer to unity within the first PCs influence the clustering more than those with absolute value closer to zero (Gemechu et al., 2005). Thus traits like seed yield, harvest index and geometric mean contributed for the total variability than the other trait. Principal component analysis identified some similar characters as the most important for classifying the variation within and among the small red seed common bean genotypes (Table 4). This included seed yield, harvest index, pod harvest index, pod wall biomass proportion, pod partitioning index, yield production efficiency and stem biomass reduction. In this study, most of the individual characters contributed very small effects to the total variation and, therefore, the differentiation of the genotypes into different clusters is rather dictated by the cumulative effects of the characters which were considered under drought stress conditions. A relatively higher heritability (45.2 for stem biomass ratio versus 44.53 for harvest index) and genetic advance 71.3 for stem biomass reduction versus 69.8 for harvest index implied that both traits could be used as indirect selection criteria for improvement of common bean under drought condition. Similarly, moderate to higher values of heritability for seed yield, 100-seed weight, and maturity were reported by Singh and Chaudhary (1985). Therefore, even if heritability estimates provide the basis for selection on phenotypic performance, the estimates of heritability and genetic advance should always be considered simultaneously, as high heritability is not always associated with high genetic advance (Johnson et al., 1955). CONCLUSION Genetic distances among the red seeded common bean clusters in Ethiopia are highly significant indicating presence of high genetic diversity for drought resistance. This needs to be considered during planning of breeding a programme. Maximum genetic recombination and variation in subsequent generation are expected from crosses that involve parents from the clusters characterised by maximum distance. Inter-cluster gene recombination of sample genotypes drawn from significantly distant clusters followed by selection should prove to generate agronomically desirable progenies as expected. ACKNOWLEDGMENT We acknowledge Southern Agricultural Research Institute (SARI), Ethiopia for the financial support during the experiment. Partial support received from CIAT/Pan-Africa Bean Research Alliance (PABRA) is also acknowledged. REFERENCES
Copyright © 2011, African Crop Science Society The following images related to this document are available:Photo images[cs11028t3.jpg] [cs11028t2.jpg] [cs11028t1.jpg] [cs11028t5.jpg] [cs11028f1.jpg] [cs11028t4.jpg] |
| |||||||||
