 |
| About Bioline | All Journals | Testimonials | Membership | News |
|
||||||
|
||||||
African Crop Science Journal, Vol. 20, Supp. 1, 2012, pp. 1-13 Improvement of resistance to fusarium root rot through gene pyramiding in common bean J. Obala1, C. Mukankusi2, P.R. Rubaihayo1, P. Gibson1, 3 and R. Edema1 1College of Agricultural and Environmental Sciences, Makerere University, P. O. Box 7062, Kampala, Uganda
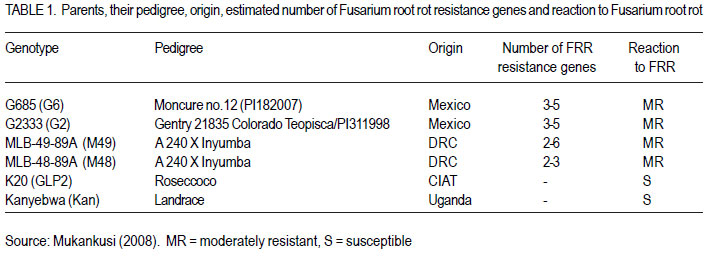
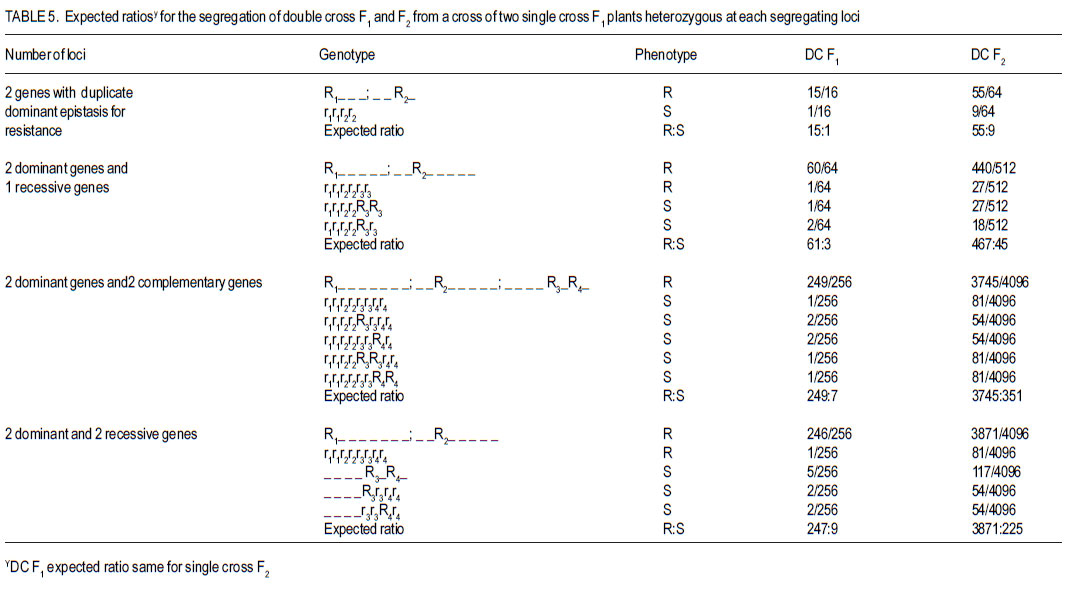
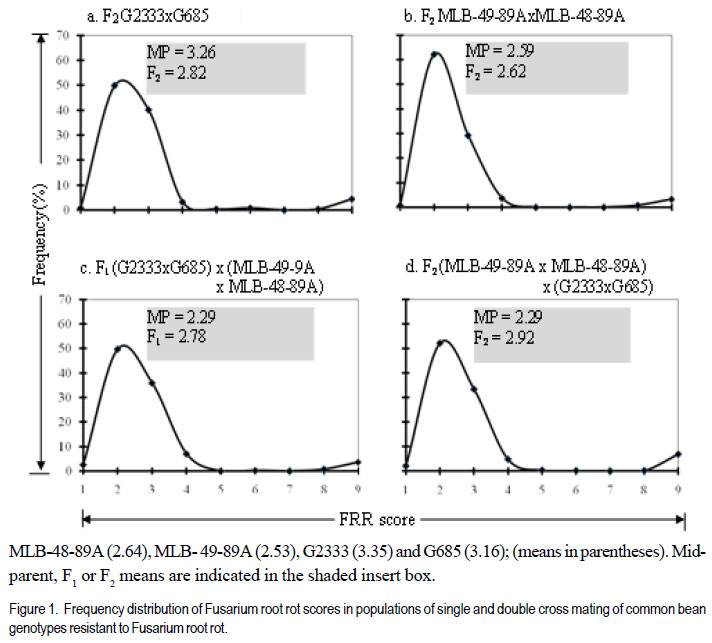
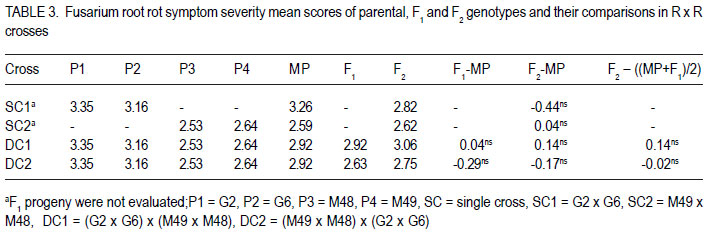
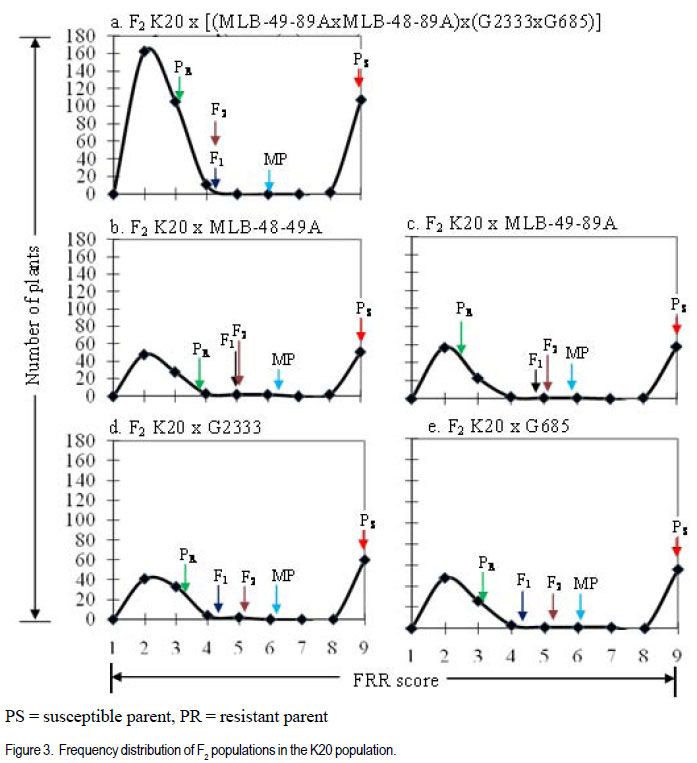
Code Number: cs12009 ABSTRACT Fusarium root rot (FRR), caused by Fusarium solani f.sp. phaseoli, is one of the most serious root rot diseases of common bean (Phaseolus vulgaris L.) throughout the world. Yield losses of up to 84% have been attributed to the disease. Development and deployment of resistant materials is the most feasible approach to managing the disease. The objective of this study was to estimate the number of pyramided Fusarium root rot resistance genes among the four resistant lines and determine their effectiveness in improving levels of resistance to Fusarium root rot in the susceptible bean cultivars. Crosses among four Fusarium root rot (Fusarium solani f.sp. phaseoli) resistant common bean (Phaseolus vulgaris) were developed. They involved six inbred lines, MLB-48-89A (M48), MLB-49-89A (M49), G2333 (G2) and G685 (G6), and two susceptible cultivars, K20 and Kanyebwa, The resistant lines were used to develop a double cross (DC) population. The DC F1 and each resistant parent were crossed to each of the two susceptible cultivars to form five-parent and single crosses, respectively. Developed populations were subjected to Fusarium solani f. sp. phasoeli isolate-3 under screenhouse conditions. There were segregation ratios of 15:1 (χ2 = 1.89, P = 0.17), 61:3 (χ2 = 0.18, P = 0.67) and 249:7 (χ2 = 1.74, P = 0.19) indicating that two, three and four genes independently condition resistance to F. solani in lines G2 x G6, M49 x M48 and (M49 x M48) x (G2 x G6). A good fit of only four genes in the double cross compared to two in the G2 x G6 , and three genes in the M49 x M48 cross suggests that at least one parent in the G2 x G6 cross have the same or closely linked genes as a parent in the M49 x M48 cross. The F1 means of the five-parent cross (FPC) involving either susceptible parent had lower disease scores, though not significantly (P > 0.05), than the single-crosses from that parent. The F2 of both FPC showed less disease than the single-cross (SC) means (P < 0.05) compared to the single-cross (SC) while the F2 of both FPC had a significant negative deviation (P < 0.05). The F2 frequency distributions also showed that the FPC in both Kanyebwa and K20 populations had higher proportions of resistant plants than any of the single crosses in the respective populations. The superior performance of the FPC over the SC demonstrates that combining resistance genes form different FRR resistance sources can provide a stable source of resistance than using single sources of resistance. Key Words: Fusarium solani, Kanyebwa, Phaseolus vulgaris RÉSUMÉ Pourriture racinaire causée par Fusarium solani f.sp. phaseoli est l’une des plus dangéreuses pourritures racinaires du haricot commun (Phaseolus vulgaris L.) partout dans le monde. La maladie cause des pertes de rendement jusqu’à 84%. L’objectif de cette étude était d’estimer le nombre de combinaisons de gènes de résistance à la pourriture racinaire due au Fusarium parmi 4 lignées résistantes et déterminer leur efficacité dans l’amélioration des niveaux de résistance à la pourriture racinaire dans les variétés sensibles. Les croisements ont été développés parmi les 4 variétés de haricot commun résistantes au Fusarium. Les croisements impliquaient six lignées, MLB48-89A, MLB-49-89A, G2333 et G685, et deux variétés sensibles, K20 et Kanyebwa. Les lignées résistantes étaient utilisées pour développer une population à double croisement. Les individus de la génération F1 du double croisement et chaque parent résistant étaient croisés à chacun des deux cultivars sensibles pour former des croisements à cinq parents et simples, respectivement. Les populations développées étaient soumises à l’isolat3 du Fusarium solani f.sp. phaseoli en serre. Les rapports de ségrégation étaient de 15:1 (χ2 = 1.89, P = 0.17), 61:3 (χ2 = 0.18, P = 0.67) et 249:7 (χ2 = 1.74, P = 0.19), montrant que deux, trois et quatre gènes conditionnent indépendamment la résistance au F. solani dans les lignées G2 x G6, M49 x M48 et (M49 x M48) x (G2 x G6). Une bon adjustement de quatre gènes seulement dans le double croisement comparé à deux dans le croisement G2 x G6, et trois gènes dans le croisement M49 x M48 indique qu’au moins un parent dans le croisement a les mêmes gènes ou les gènes étroitement liés pour un parent dans le croisement M49 x M48. Les moyennes des F1 issues des croisements à cinq parents impliquant le parent Kanyebwa et les populations de K20 avaient des déviations négatives non significatives (P > 0.05) comparé au croisement simple. D’autre part, les F2 des deux croisements à cinq parents avaient des déviations négatives significatives (P < 0.05) issues des moyennes de croisements simples, ce qui indique une sévérité des symptômes de la pourriture racinaire plus faible dans les croisements à cinq parents que dans les simples croisements. La fréquence des distributions des F2 montrait aussi que les croisements à cinq parents à la fois dans les populations de Kanyebwa et celles de K20 avaient des proportions des plants résistants plus élevées que toutes celles des croisements simples dans les populations respectives. Mots Clés: Fusarium solani, Kanyebwa, Phaseolus vulgaris INTRODUCTION Fusarium root rot (FRR), caused by Fusarium solani f.sp. phaseoli, is one of the most serious root rot diseases of common bean (Phaseolus vulgaris L.) occurring in most bean fields throughout the world. Yield losses of up to 84% have been attributed to the disease (Abawi and Pastor-Corrales, 1990; Park and Tu, 1994). It is one of the major diseases currently affecting bean production in Uganda (Mukankusi, 2008). The most effective control measure for FRR in common bean is through the deployment of resistant cultivars (Navarro et al., 2003). Most of the currently identified sources of FRR resistance are of Middle-American origin with only moderate levels of resistance and having undesirable characteristics such as late maturity, small seed size, black seeded and often of climbing growth habit (Mukankusi, 2008). These are, hence, not easily accepted by a large percentage of bean farmers in Africa (Mukankusi, 2008). In Uganda, the popular large-seeded Andean bean cultivars such as K20 (Nambale), and Kanyebwa are highly susceptible to FRR (Mukankusi, 2008). Small-seeded beans of Middle-American genotype, although not completely resistant to FRR have been used to improve resistance in the large-seeded bean genotypes though with limited success due to the complex inheritance of the trait (Román-Avilés and Kelly, 2005). Genetic resistance to FRR has been found to be quantitative in nature (Miller and Burke, 1985; Schneider and Kelly, 2000) and, hence, strongly influenced by the environment (Schneider et al., 2001). Estimates of gene number for FRR resistance in past studies suggested that resistance to FRR is governed by two to three recessive genes, one dominant and one recessive gene (Smith and Houston, 1960), three to seven largely dominant genes with major additive effects (Bravo et al., 1969); while Hassan et al. (1971) reported four dominant genes. Studies to improve FRR resistance in three large-seeded market class bean cultivars in Uganda identified five bean genotypes of Middle American origin, namely; MLB-49-89A, RWR719, G2333, G685 and MLB-48-89A as good sources of resistance to FRR (Mukankusi, 2008). The study showed that variability existed in the number of genes and gene actions governing resistance in these genotypes and that the genes are located on different loci. Accumulation of these resistance genes through gene pyramiding from the different sources into a single line or cultivar was suggested as a way to increase levels of resistance to FRR (Mukankusi, 2008). Through gene pyramiding, interaction between genes may occur such that resistance of a combination of genes is better than that conditioned by any of the genes individually (Dyck and Sambroski, 1982). It is, however, not known whether pyramided resistance genes from the different sources of FRR resistance into a single cultivar would increase the level of resistance to the disease in susceptible cultivars. Determining that the disease resistance levels reached due to pyramided resistance genes will be higher than those from single sources of resistance would guide breeders on the relevance of developing and utilising a cultivar with such a combination of resistance genes (Pedersen and Leath, 1988). The objective of this study was to estimate the number of pyramided FRR resistance genes form four different sources, and determine the effectiveness of these pyramided resistance genes in improving levels of FRR resistance in susceptible bean cultivars. MATERIALS AND METHODS Plant material. The study was conducted at the International Centre for Tropical Agriculture, Kawanda in Uganda between 2009 and 2010. Six common bean genotypes fully characterised for resistance to FRR were used in the study (Table 1). Population development. Single cross F1 populations derived from four resistant (R) parents: MLB-48-89A (M48), MLB-49-89A (M49), G2333 (G2) and G685 (G6) were used to develop double cross (DC) populations (M49 x M48) x (G2 x G6) and (G2 x G6) x (M49 x M48). The reciprocal DC was developed to ensure adequate seed production for evaluation and generation advancement. The first part of the DC F1 was crossed to each of two susceptible cultivars (Kanyebwa and K20) to form two five-parent cross populations: K20 x [(M49 x M48) x (G2 x G6)] and Kan x [(M49 x M48) x (G2 x G6)]. Single crosses between each of the four resistant parents and the two susceptible cultivars were also developed namely; K20 x M49, K20 x M48, K20 x G2, K20 x G6, Kan x M49, Kan x M48, Kan x G2 and Kan x G6. In all crosses, as advised by Singh (1994), the susceptible but popular cultivars were used as seed parents to ensure that they made a 50% genetic contribution to retain as many as possible of their already desirable attributes. The second part of the DC F1 seed was used for population advancement. All crosses were advanced to F2 generation by selfing and seed from each cross was harvested in bulk. Trial management and design. Planting for evaluation was done in a screenhouse in wooden trays (0.74 m x 0.42 m x 0.115 m) partially filled with pre-sterilised loamy sand soil inoculated with Fusarium solani f. sp. phaseoli isolate 3 (FSP-3; Mukankusi, 2008). Liquid NPK fertiliser (1:1:1) at a rate of 1 liter of liquid fertiliser per kg of soil was used to fertilise the soil 3-4 days before planting. Watering of the trays was done 1 to 2 times daily depending on intensity of sunshine and amount of rainfall. The numbers of plants established for the R x R trial were 240 per parent, 260 per SC F2, 200 per DC F1 and 560 per DC F2. The trial was laid out in two replications with 15 trays per replication, 11 rows per tray and 10 seeds per row. M49 was used as both a resistant check and a parent while K132 was the susceptible check. The F1 of the SCs were not evaluated. For S x R crosses involving K20 and Kanyebwa as susceptible parents, hereafter referred to as K20 and Kanyebwa populations, respectively. The number of plants established for evaluation were 52 to 62 of resistant parent, 156 to 169 of susceptible parent, 65 to 130 of DC F1, 52 to 78 of SC F1, 130 to 208 FPC F1, 156 to 169 of SC F2, and 420 to 429 of DC F2. In all the trials, individual trays were used as incomplete blocks and overlap of entries across trays was used to assess uniformity among trays. Assessment for FRR symptom severity was done 21 days after planting, by carefully uprooting and washing the below ground parts of the plant. The severity of FRR symptom was visually scored on a scale of 1 to 9 where 1 = no visible symptoms and 9 = severe disease or dead plant (Chaudhary et al., 2002). Data analysis. To estimate the number of pyramided genes among the four resistant lines, Mendelian analysis of segregating populations of plants was carried out. The F1 and F2 progenies in R x R crosses were categorised into resistant (score of 1-4) and susceptible (score of 5-9). Two, three and four gene models were developed by taking into consideration the differences in the segregation patterns of the SC F2, DC F1 and DC F2 generations (Table 5). Before conducting the χ2 goodness-of-fit test, a homogeneity of ratios test was performed to (i) assess the difference in segregation between the two replications , and (ii) test for cytoplasmic inheritance in the reciprocal DC F1 and F2 populations in the R x R trial (Pozniak and Hucl, 2004). The χ2 test of homogeneity was based on the Mather (1957) model. Where the homogeneity of ratios test indicated no difference in the segregation pattern of a cross between the two replications, data from the replications were added prior to χ2 goodnessof-fit test. Similarly, where there was no significant deviation in the segregation ratios between the reciprocal DC F1 and F2 populations, data from reciprocal crosses were added prior to χ2 analysis. The χ2 value for goodness-of-fit test was calculated using the model of Mather (1957). Means of parents and progenies were compared to provide insight on the types of gene action conditioning FRR resistance in both the R x R and S x R populations. Comparisons between means of FPC and SC S x R populations were used to determine the effect of pyramided resistance genes. Means were computed using the restricted (residual) maximum likelihood (ReML) analysis in GenStat (LAWES Agricultural Trust, 2010). Where the mean squares from ReML analysis indicated significant genotype effects, means were compared using a “Student’s t-test” for each pair wise comparison of interest, based on the standard error of the difference (SED) for that specific pair of entries. The “Student’s ttest” was used due to unequal number of individuals among genotypes tested and the use of individual trays as incomplete blocks (Gomez and Gomez, 1984). RESULTS AND DISCUSSION Estimates of gene number in R x R crosses. The distributions in both single and double cross populations are presented in Figure 1a-d. The distributions were discontinuous, bimodal and skewed towards resistance, suggesting that resistance is strongly influenced by non-additive gene interactions. Because the frequency distributions grouped the plants into two distinct phenotypic classes in all the crosses (Fig. 1), the plants were put into two classes of resistant (R) and susceptible (S) prior to the χ2 goodness-offit analysis. The observed and hypothesized phenotypic class frequencies for resistant and susceptible reactions to FSP-3 in R x R singlecross F2 and R x R double-cross F1 and F2 are shown in Table 2. The χ2 test of homogeneity of ratio between the two replications revealed no significant differences in the segregation ratios of the crosses in replication 1 and replication 2 (P > 0.05), so data were pooled over replications prior to the χ2 goodness-of-fit analysis. Each of the four populations showed non-significant χ2 value for more than one gene model (Table 2). However, an observed segregation can fit gene models for differing numbers of loci if the population sizes are not adequately large for distinguishing between the fitted ratios (Mather, 1957). In addition, an observed segregation may not fit the true genetic model because of the effect of minor genes, modifier genes, epistasis or environmental factors. Because of the several possible ratios, the explanation of the χ2 goodness-of-fit results was based on the gene models which gave the best fit (low χ2 value with a high P value) to the observed ratio for a specific cross even though a ratio having a slightly higher χ2 value and a lower but non-significant χ2 probability does not imply an inadequate fit. Segregation in the F2 population of the cross G2 x G6 fits two of the tested ratios: 15:1 (χ2 = 0.00, P = 0.91) and 61:3 (χ2 = 1.06, P = 0.30) with the best fit to the 15:1 as indicated by the low X2 value and high P value (Table 2). The best fit to a 15:1 ratio in this cross suggests that G2 x G3 segregated for at least two genes with duplicate dominant epistasis with one dominant gene present in each parent (Estakhr and Assad, 2002). Segregation in the F2 population of M49 x M48 fit a 15:1 (χ2 = 1.89, P = 0.17), 61:3 (χ2 = 0.18, P = 0.67) and 249:7 (χ2 = 1.74, P = 0.19). Segregation in the F2 population of the cross G2 x G6 fits two of the tested ratios: 15:1 (χ2 = 0.00, P = 0.91) and 61:3 (χ2 = 1.06, P = 0.30) with the best fit to the 15:1 as indicated by the low χ2 value and high P value (Table 2). The best fit to a 15:1 ratio in this cross suggests that G2 x G3 segregated for at least two genes with duplicate dominant epistasis with one dominant gene present in each parent (Estakhr and Assad, 2002). Segregation in the F2 population of M49 x M48 fit a 15:1 (χ2 = 1.89, P = 0.17), 61:3 (χ2 = 0.18, P = 0.67) and 249:7 (χ2 = 1.74, P = 0.19). The best fit to 61:3 ratio suggests that the F2 population of M49 x M48 more likely segregated for at least two dominant genes and one recessive gene for resistance (Chen and Line, 1992). The Chi-square test of homogeneity of reciprocal crosses in double cross populations revealed no significant deviations (P > 0.05) from the segregation ratios in the F1 and F2 (Table 2) indicating the absence of detectable cytoplasmic inheritance (Pozniak and Hucl, 2004). Therefore, data from the two reciprocal populations were combined prior to the Chi-square goodness-offit analysis of the double cross F1 and double cross F2 data (Table 2). The F1 of the double cross: (M49 x M48) x (G2 x G6) fitted a 15:1 (χ2 = 1.60, P = 0.21) and 61:3 (χ2 = 0.00, P = 1.00) with the best fit to 61:3 ratio suggesting that this population likely segregated for at least one dominant gene and two recessive genes for resistance (Chen and Line, 1992) than for two genes as suggested by 15:1 ratio. Segregation in the F2 of the double cross (M49 x M48) x (G2 x G6) fit a 467:45 (χ2 = 1.76, P = 0.18) and 3745:351 (χ2= 1.18, P=0.27) ratios (Table 2) indicating segregation for three and four resistance genes, respectively with the four gene ratio providing a slightly better fit. The adequate fit of only four genes in the double cross compared to the segregation of two genes in the G2 x G6 cross plus three genes in the M49 x M48 cross probably suggests that at least one parent in the G2 x G6 cross have the same or closely linked genes with one parent in the M49 x M48 cross. Had the genes that segregated in the individual single crosses been different or distantly linked, a total of five genes should have segregated in the double-cross. Nonetheless, the apparent segregation of more genes in the double cross than in the single crosses in this study provided further evidence that resistance genes to FRR are located on multiple loci among the different sources of resistance as previously observed by Mukankusi (2008). The results also further indicated that the effects of dominance, recessiveness and epistatic gene interactions condition resistance to FRR as earlier reported by McRostie (1921), Smith and Houston (1960), Bravo et al. (1969), Hassan et al. (1971) and Mukankusi (2008). Although the segregation ratios suggested that two, three and four genes independently segregated in G2 x G6, M49 x M48 and (M49 x M48) x (G2 x G6), respectively, based on the gene models which best fit the observed segregation, the actual number of genes involved in each of the crosses cannot be detected by the χ2 goodness-of-fit test, as already illustrated by observed segregation ratios showing a suitable fit to more than one gene model. The difficulty in determining the actual number of genes controlling resistance was expected due to the level of resolution of the method used (Lewers et al., 2003). Use of molecular markers tagged to the resistance genes would improve the understanding of the number and effects of genes controlling FRR resistance in common bean (Schneider et al., 2001; Románs-Avilés and Kelly, 2005). Interactions of pyramided resistance genes. The genotypes in both the R x R and S x R crosses were significantly different (P < 0.05) in the F1 and F2 generations (mean square not shown) and, therefore, means were compared to assess the types of gene interaction controlling FRR resistance in them. All the R x R crosses showed non-significant deviations (P > 0.05) of F1 from MP, F2 from MP and F2 from the average of MP and F1 (Table 3). These results indicate that resistance to FRR in these crosses is primarily additive in nature, which is consistent with reports of previous studies (Bravo et al., 1969; Mukankusi, 2008). In the S X R populations, two crosses: Kan x M48 and Kan x G2, showed non-significant deviation of the F1 mean from the MP and nonsignificant deviation (P > 0.05) of F2 mean from the average of MP and F1 (Table 4) suggesting that additive gene effects were probably more important than non-additive effects (Salman and Heyne, 1987; Fenster and Galloway, 2000). Three crosses: Kan x M49, Kan x MG6 and K20 x [(M49 x M48) x (G2 x G6)] showed significant deviations (P < 0.05) of the F1 mean from the MP as well as significant deviations of the F2 mean from the average of MP and F1 (P < 0.05) (Table 4) suggesting a major contribution by non-additive gene action particularly epistasis (Fenster and Galloway, 2000). The remaining five crosses: Kan x [(M49 x M48) x (G2 x G6)], K20 x M48, K20 x M49, K20 x G2 and K20 x G6 all had significant deviations (P < 0.05) of the F1 mean from the MP, and non-significant deviations (P > 0.05) of the F2 mean from the average of the MP and F1 (Table 4) suggesting non-additive gene action, particularly dominance for resistance to FRR (Hassan et al., 1971; Fehr, 1987; Fenster and Galloway, 2000). Effect of pyramided resistance genes in the S X R crosses. In both the Kanyebwa and K20 populations the five-parent cross (FPC) F1 mean had insignificant negative deviations (P > 0.05) from the single-cross (SC) F1 mean while the F2 of both FPC had a significant negative deviation (P < 0.05) from the SC means, indicating lower FRR symptom severity in the FPC than in the SC (Table 4). The F2 frequency distributions also showed that the FPC in both Kanyebwa and K20 populations had higher proportions of resistant plants than any of the single crosses in the respective populations (Figs. 2 and 3). Epistatic interaction seemed to have had major contribution to the lower FRR symptom severity in the FPC relative to that in the SC. This is because even though the FPC in the Kanyebwa population had a non-significant deviation (P > 0.05) of the F2 mean from the average of MP and F1, it was the only cross with a negative F2 deviation in the Kanyebwa population (Table 4). Similarly, even though all crosses in the K20 population had negative F2 deviations, it was only the FPC that showed a significant negative deviation (P < 0.01) of the F2 mean from the average of the MP and F1 (Table 4). A positive deviation of the F2 mean from the average of MP and F1 would indicate that epistasis had a detrimental effect for resistance to FRR, that is, it favoured susceptibility; while a negative deviation would indicate that epistasis had a beneficial effect, which favoured resistance (Fenster and Galloway, 2000). Therefore, epistatic effects seemed to have made more contributions than dominance effects to the better performance of the FPC relative to the SC as indicated by the predominance of beneficial epistatic effects in the FPC than in the SC (Table 4). It is, therefore, likely that the FPC had more beneficially interacting loci than did the SC. The result also further confirms, and is consistent with, the additive nature of resistance indicated in the R x R crosses. The better performance of the FPC over the SC demonstrates that combining resistance genes from different FRR resistance sources can provide a better source of resistance than using single sources of resistance. It also supports the observation made by Mukankusi (2008) that resistance genes for FRR are located on different loci among different sources of resistance and that combining these loci would lead to increased levels and/or stability of resistance beyond what can be achieved by using each of the resistance sources individually. ACKNOWLEDGEMENT Financial support from Alliance for a Green Revolution in Africa/Program for African Seed Systems (AGRA/PASS) is greatly appreciated. Deep appreciation is also extended to CIAT-Africa Centre and National Biotechnology Laboratory – Kawanda, Uganda for allowing us to use their facilities. The technical assistance provided by Mr. S. Musoke, and Ms. C. Acam throughout the duration of the experiments are also greatly appreciated. REFERENCES
Copyright © 2012 - African Crop Science Society The following images related to this document are available:Photo images[cs12009t3.jpg] [cs12009t5.jpg] [cs12009f3.jpg] [cs12009t4.jpg] [cs12009t1.jpg] [cs12009f2.jpg] [cs12009f1.jpg] [cs12009t2.jpg] |
| |||||||||
