 |
| About Bioline | All Journals | Testimonials | Membership | News |
|
||||||
|
||||||
African Crop Science Journal, Vol. 20, Supp. 1, 2012, pp. 77-97 Hot pepper reaction to field diseases V. Nsabiyera, M. Ochwo-Ssemakula and P. Sseruwagi1 College of Agricultural and Environmental Sciences, Makerere University, P. O. Box 7062, Kampala, Uganda
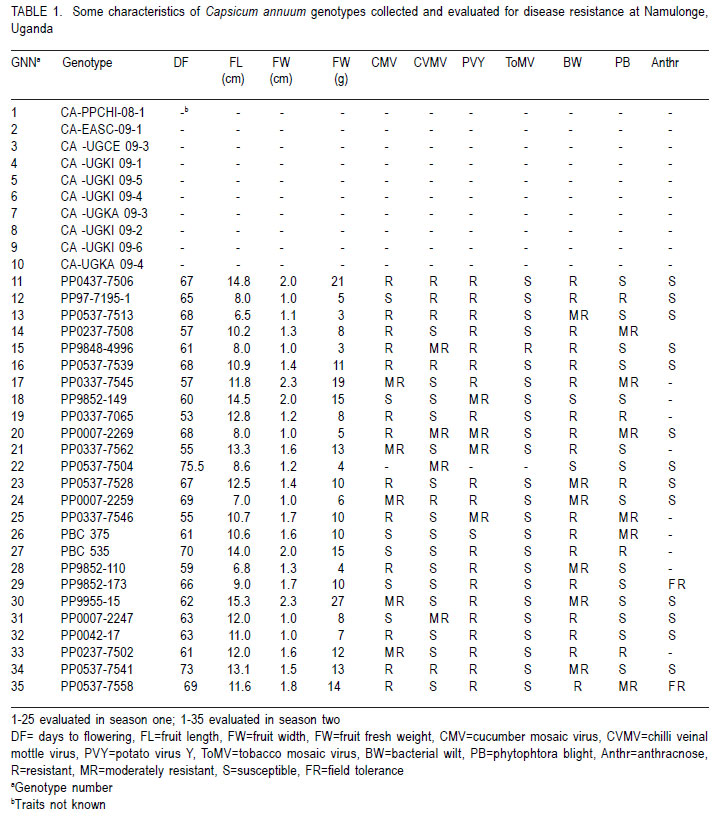
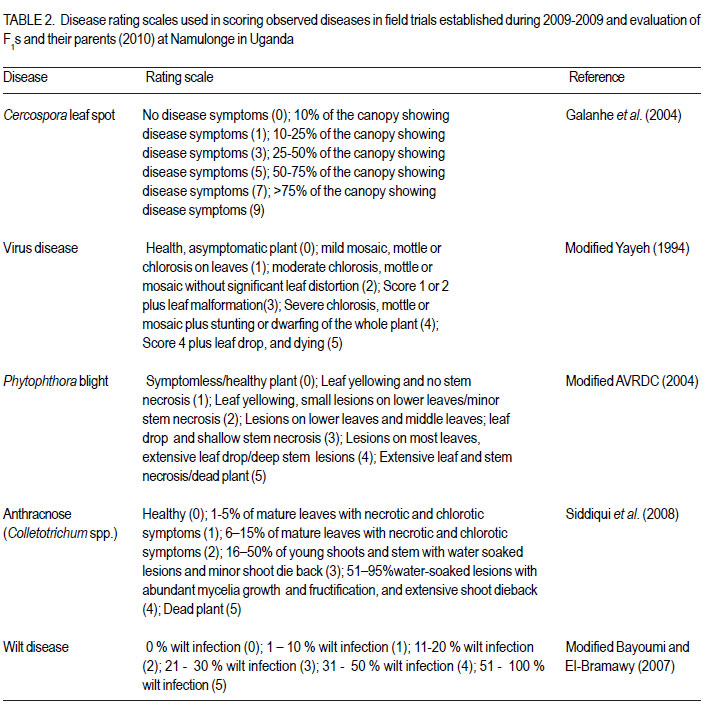
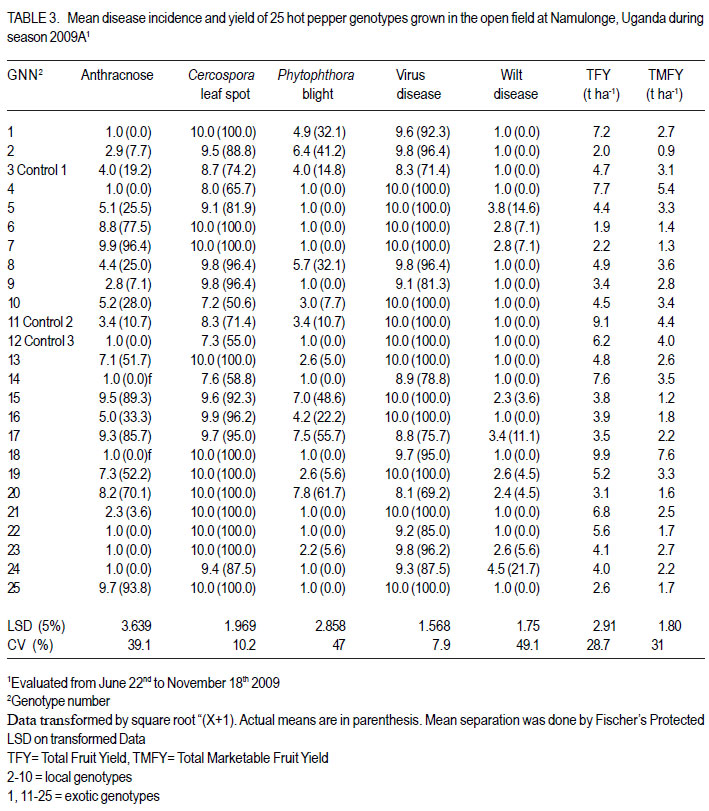
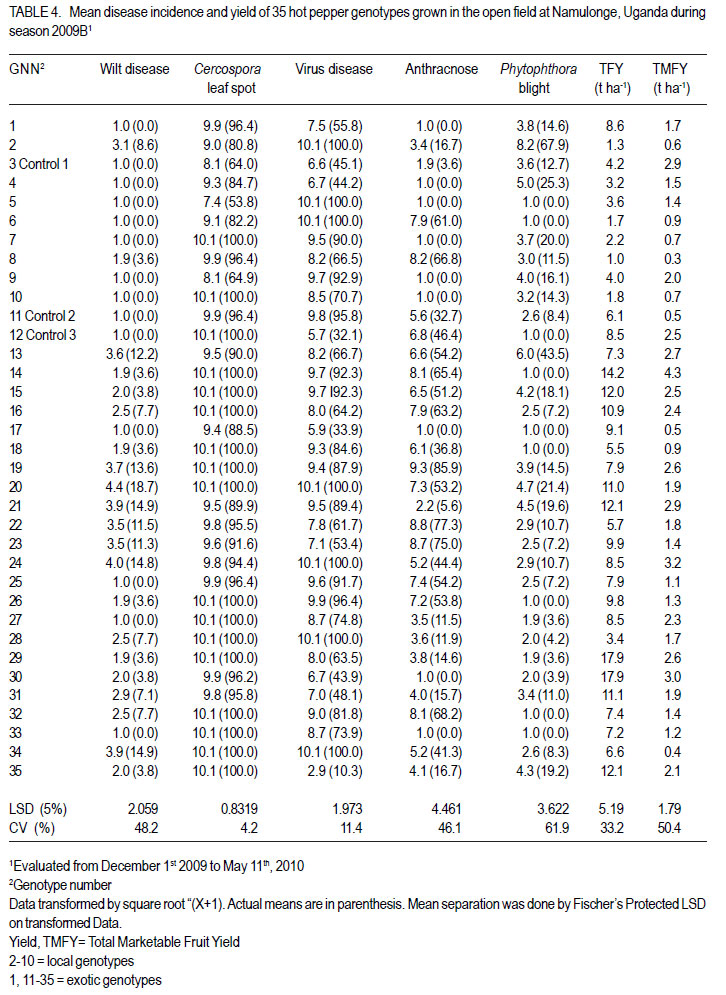
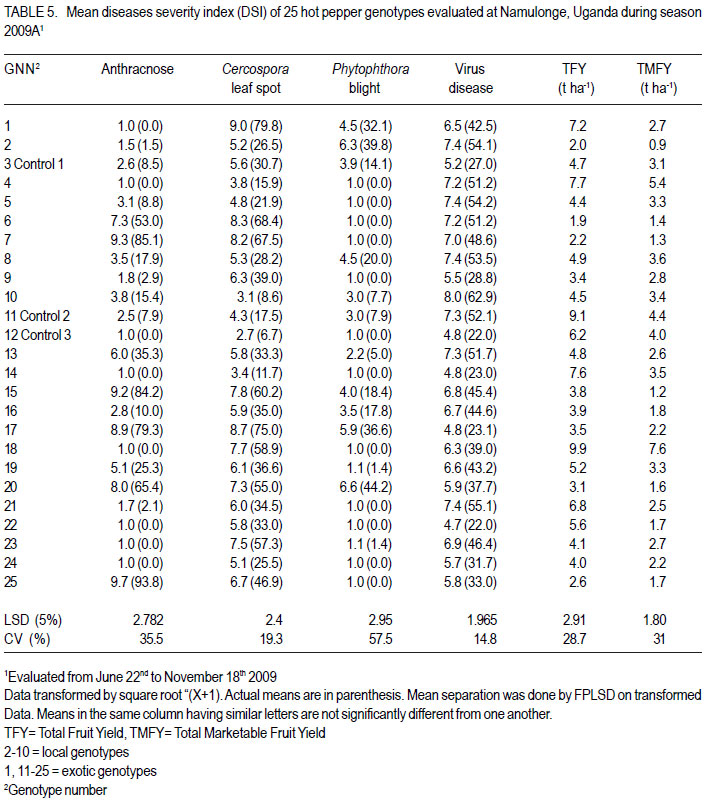
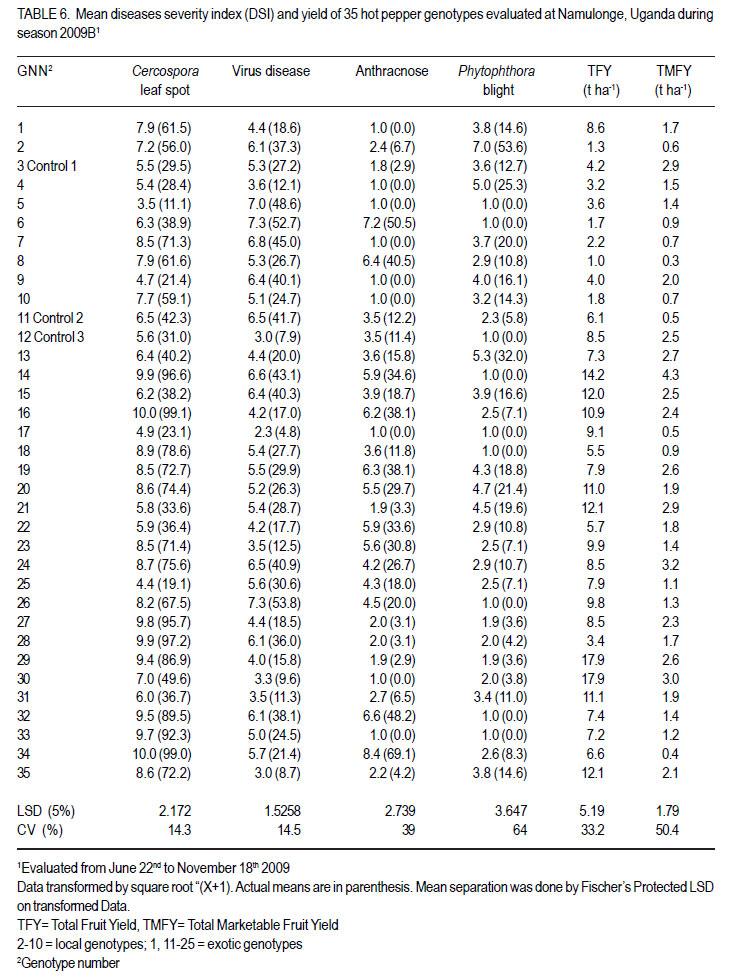
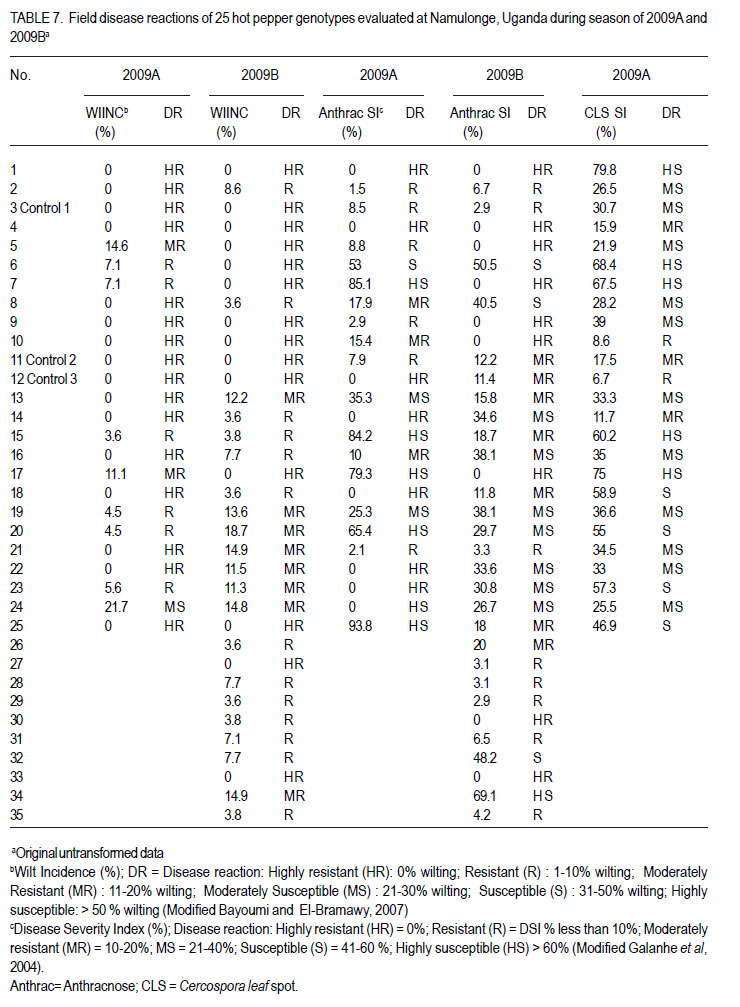
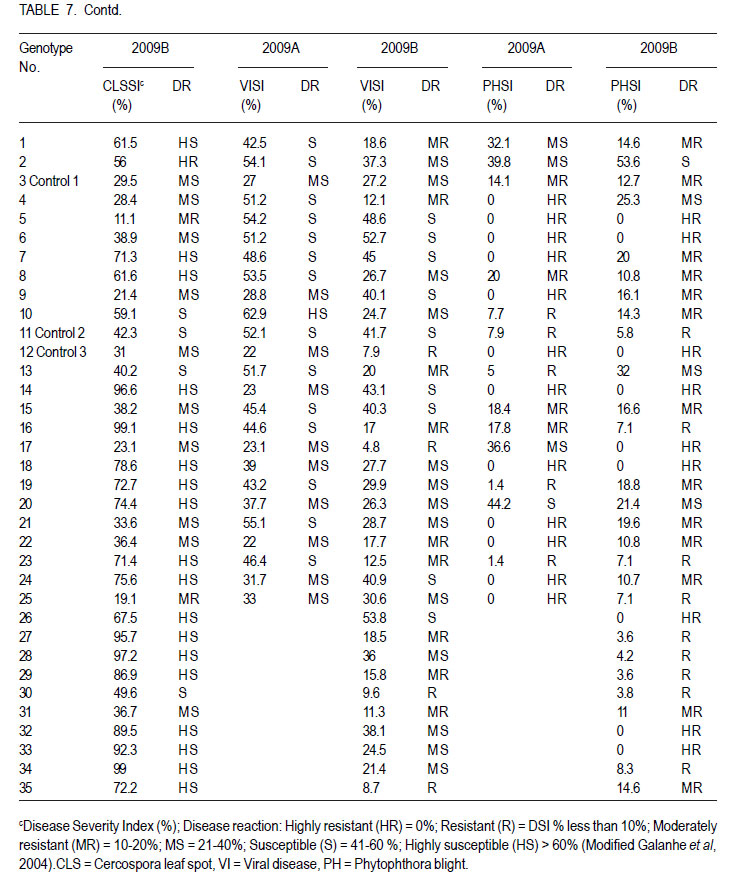
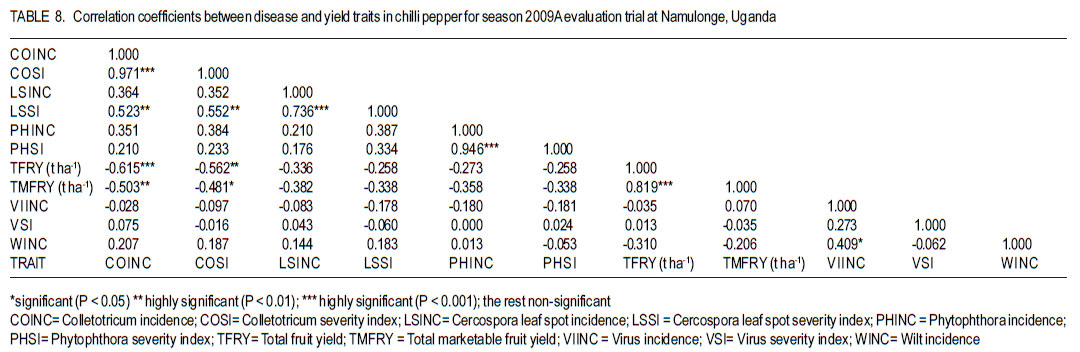
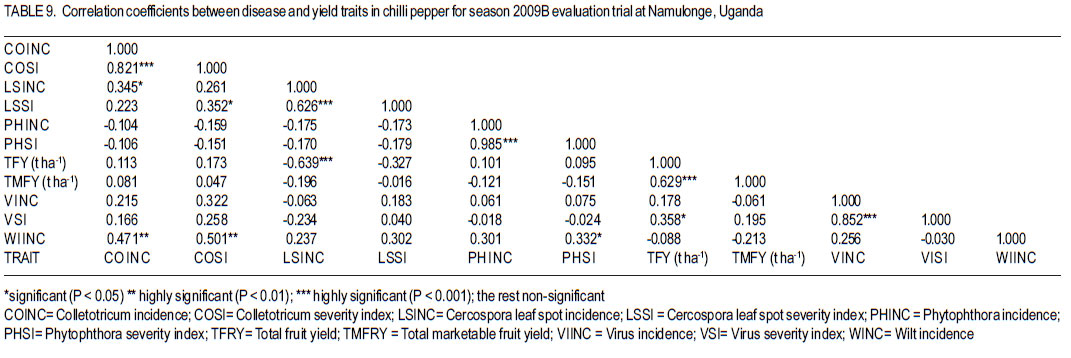
Code Number: cs12016 ABSTRACT Diseases are major constraints to hot pepper (Capsicum annum L.) production in sub-Saharan Africa. The search for cultivars resistant to the major diseases of hot pepper has been limited. This study was conducted in Uganda to evaluate exotic and local hot pepper genotypes for disease resistance. Viral diseases and Cercospora leaf spot were the most predominant and severe, followed in descending order by anthracnose, Phytophthora blight and wilt diseases. Highly significant genotypic differences (P<0.001) existed in most scored disease traits. There was no genotype resistant to field diseases of interest in this study; however, a few cultivars exhibited resistance to two or more disease infections. The Asian Vegetable Research and Development Centre (AVRDC) genotype 12 (PP97-7195-1) was exceptionally resistant to fungal and bacterial diseases, but moderately resistant to viral diseases. Highly significant genotype by season (P<0.001) interactions were observed for both disease incidences and severity indices, except for Phytophthora blight severity index. Field disease correlation stability analysis across seasons indicated significant virus and Phytophthora blight severity indices implying some stability in these scores across seasons with virus severity index being the most consistent scored disease trait. Anthracnose incidence and severity contributed more to yield loss. Key Words: Anthracnose, Capsicum annuum, fungal diseases RÉSUMÉ Les maladies constituent des contraintes majeures à la production du piment (Capsicum annum L.) , la recherche sur des cultivars résistants étant limitative en Afrique Sub-Saharienne. Cette étude était conduite en Ouganda pour évaluer les génotypes du piment exotique et local à la résistance aux maladies. Les maladies virales et la tâche foliaire Cercospora étaient les plus prédominants et sévères, suivis par ordre décroissant par l’anthracnose, le mildiou et les maladies de flétrissement. De différences génotypiques hautement significatives (P<0.001) étaient enregistrées dans tous les traits de maladies examinés. Il n’y avait pas de génotypes résistants à toutes les maladies étudiées aux champs; par ailleurs, peu de cultivars ont manifesté une résistance à deux ou plusieurs infections de maladies. Le génotype 12 (PP97-7195) du Centre Asiatique de Recherche et Développement sur les légumes était exceptionnellement resistant au champignon et aux maladies bactériennes, mais modérément résistant aux maladies virales. Des interactions hautement significatives entre génotypiques et saison (P<0.001) étaient observées pour incidence des maladies et indices de sévérité, excepté pour l’index de sévérité du mildiou. L’analyse par corrélation de stabilité de maladies en champs à travers les saisons ont indiqué des indices significatifs de sévérité virale et du mildiou, impliquant un certain degré de stabilité à travers les saisons, l’indice de sévérité virale plus consistant enregistré. L’indice de l’ anthracnose et sa sévérité ont le plus contribué à la perte de rendement. Mots Clés: Anthracnose, Capsicum annuum, champignon maladies INTRODUCTION Hot pepper (Capsicum annuum L.) is a crop of growing significance in the economies of sub-Saharan Africa (SSA). Unfortunately, the rate of production is far from coping with the demand within and outside the SSA region. For instance, over the past 7 years, hot pepper production in Uganda has stagnated at 3,800 metric tonnes, with yields remaining lower than the average global production of 28 metric tonnes. Moreover, the quality of the produce realised does not meet the stringent standards of the international markets, where most countries face fierce competition from major producing countries such as India and China (Thampi, 2003). The poor quality of the produce is largely attributed to biotic and abiotic stresses in the field and the poor quality cultivars grown by farmers (ADC/IDEA, 2001; UEPB, 2005; Douglas, 2008; Tusiime et al., 2010). Attacks by fungal, bacterial or viral diseases, nematodes, mites and many insect pest infestations infections can cause significant losses in pepper production (Black et al., 1991; Ochoa-Alejo and Ramirez-Malagon, 2001). These disease infections and pest infestations undoubtedly, severely reduce the production and profitability of this crop even further by reducing the period in which the crop can be harvested. The major limiting diseases of most chilli peppers in SSA and elsewhere are phytopathogenic fungi, bacteria, and viruses. For example, 60 to 100% losses of marketable fruit have been reported from virus infection (Green, 1991), up 100% loss from pepper anthracnose (Melanie and Sally, 2004); while bacterial spot caused by a seedborne bacterial pathogen (Xanthomonas campestris pv. vesicatoria) is also capable of causing severe defoliation of plants, resulting in reduced yield and loss of quality of harvested fruit when severe damage occurs on enlarging fruits (Sun et al., 2002). Control and/or prevention of these diseases and their vector populations are usually through use of chemical sprays on diseased plants and use of various cultural practices. In Uganda, farmers largely use pesticides for disease and pest control on hot pepper (Karungi et al., 2010). The pesticides used are quite costly and are often applied in large quantities that expose produce to potential retentions beyond the acceptable threshold (Aubertot et al., 2005). The indiscriminate application of pesticide has also over time resulted in a buildup of resistance among target pests and pathogens (Flint, 1999). Pests and diseases are best managed using host resistance, which is a cheap option for farmers (Byoung-Cheorl et al., 2005; Duveiller et al., 2007). Availability of disease-resistant cultivars would be the best control strategy. The aim of this study was to evaluate elite exotic and local genotypes to identify potential sources of resistance for use in resistance breeding programme for improved hot pepper yields and quality. MATERIALS AND METHODS Genotypes, field trials and their management. An on-station experiment was conducted at the National Crops Resources Institute (NaCRRI), Namulonge, in Uganda during two rainy seasons (2009A and 2009B). The Institute experiences annual minimum and maximum mean temperatures of 15.9 and 28.4 oC, respectivelyrespectively, while the mean annual rainfall is 1270 mm. The experimental genotypes, their source and some disease traits are presented in Table 1. A total of 25 genotypes were evaluated in 2009A, while in 2009B, 35 were tested. During 2009A, seedlings were raised under field conditions on soilbeds that had been surface-sterilised by burning a layer of dry grass for one hour to kill soil-borne pathogens. As a result of low germination percentages in 2009A, screenhouse propagation was applied in 2009B using plastic buckets with sterilised soil in the ratio 3:1:1 (soil: sand: decomposed dried cow dung) to generate growth media. In order to inactivate seed-borne tobamoviruses (TMV, ToMV, ad PMMV) pepper seeds were soaked in a 10% (w/v) solution of trisodium phosphate (TSP) for 30 minutes and transferred to a fresh solution of the same reagent for a further two hours before rinsing in running water for 45 minutes. Seeds were then soaked in water for 24 hours in order to facilitate germination (Rashid et al., 2007). A protective insecticide, IMAXI (Imidacloprid 200 g l-1 active ingredient (a.i.), at the rate 20 ml 15 L-1) and the broad spectrum fungicide Ridomil (Metalaxyl-M 40 g kg-1 + Mancozeb 640 g kg-1 a.i.; at the rate 60 g 15 L-1) were applied 3 times a week before transplanting to prevent vector transmission of viruses and manage fungal pathogens. In addition, the organic fertiliser vegimax (trace minerals, vitamins and amino acids produced from plant products, at the rate 35 ml 15 L-1) was applied twice a week for two weeks at the two-leaf stage. Recommended nursery management (Berke et al., 2005) practices such as regular watering and weeding were also followed to facilitate seedling establishment. Seedlings were transplanted at 6-8 weeks after planting in the field on well prepared beds. In both seasons, an alpha lattice design was used with two replications with season 2009A having a 5x5 (5 incomplete blocks each containing 5 experimental plots with a total of 25 experimental plots) alpha lattice design and 2009B. The alpha lattice design was a 7 x 5 (7 incomplete blocks each containing 5 experimental plots totalling 35 experimental plots). In both designs, each plot was a single row raised bed 1m wide and 5m long with a population of 14 plants. The spacing between plants within rows was 45 cm and between rows was 60 cm. The distance between plots was 1.5 m and between replications 2 m. To counteract border effects, guard rows of beans were planted around the trial. Plants were fed with a complete fertiliser NPK (20:10:10) at the rate of 400 kg ha-1 in two splits: two weeks (200 kg ha-1) after transplanting and three weeks (200 kg ha-1) after the first application. Urea was also applied at 100 kg N ha-1 in three splits with the first application at two weeks (30 kg ha-1) after transplanting, second application at three weeks (30 kg ha-1) after the first application and the third application three weeks (40 kg ha-1) after the second application. Transplants were protected for about two months as described above in order to allow proper plant establishment in the field. Weeding was done as often as necessary to avoid competition for nutrients with plants. Watering was done twice a day for two weeks after transplanting and thereafter thrice a week during dry conditions until seedlings were fully established. Data collection. Starting from 30 days after transplanting, the plants were monitored every two weeks for expression of disease symptoms to assess disease occurrence and disease resistance. Disease incidence (DI) was calculated as the proportion of infected plants per plot and expressed as a percentage (Galanihe et al., 2004). Disease severity was rated on the basis of rating scales developed for the diseases identified (Table 2). The disease severity index (DSI) for each disease was calculated according to the formula below (Galanihe et al., 2004): DSI (%) = Σ {(P x Q)}/ (M xN)] x 100 Where P = severity score, Q = number of infected plants having the same score; M = Total number of plants observed, N = Maximum rating scale number. Disease severity indices and disease incidence scores were used to assess disease resistance according to Pratt et al. (1994) and Galanihe et al. (2004). The observed field diseases were identified according to evident symptom expressions using the AVRDC pepper disease compendium (Black et al., 1991). Data on wilted plants were recorded every week throughout the duration of the experiment. Anthracnose, Cercospora leaf spot, Phytophthora blight and virus diseases were scored three times on each plant in the middle rows of each plot. These data were recorded at the onset of disease symptoms, at the intermediate growth stage of pepper, and at physiological maturity when the genotype first fruit changed to its respective maturity colour. In plots where the disease incidence was 0 or 100% in one replicate and not the other, the 0% incidence value was adjusted by (0+100/4n), and 100% by (100-100/4n) (n = number of plants observed in a plot) since few plants were observed and these values would possibly change if many plants were observed (Prof. P. Gibson, former Professor of Plant Breeding, Genetics and Biometry, University of Southern Illinois, USA; Pers. Com.). Data analyses. Data on disease incidence and severity (DSI) were transformed using the square root function (v (X+1) so as to normalise variability. The transformed data were subjected to analysis of variance using GenStat computer package (12th Edition, Version 12; VSN International Ltd, 2010) to examine variations among the genotypes. Data on the 25 genotypes common to both seasons were then pooled across seasons to determine the interaction effects between seasons and treatments (genotypes). Treatment means were separated using Fischers’ Protected Least Significant Differences (LSD) test at 5% probability level (Gomez and Gomez, 1984). Correlation analyses were performed to assess the relationships between yield and scored disease parameters in individual seasons. Resistance to wilt was determined on the basis of wilt incidence (%) as: Highly resistant (HR): 0% wilting; Resistant (R): 1-10% wilting; Moderately Resistant (MR): 11-20% wilting; Moderately Susceptible (MS): 21-30% wilting; Susceptible (S): 31-50% wilting; Highly susceptible: > 50 % wilting (Modified Bayoumi and El-Bramawy, 2007). Resistance to viruses, Cercospora leaf spot, Colletotrichum spp. and Phytophthora blight diseases were based on the Disease Severity Index (DSI) (%) as: Highly resistant (HR) = 0%; Resistant (R) = DSI% < 10%; Moderately resistant (MR) = 10-20%; MS = 21- 40%; Susceptible (S) = 41-60 %; Highly susceptible (HS) > 60% (Modified Galanihe et al, 2004). RESULTS Disease incidence. The major diseases found infecting hot pepper were anthracnose (Colletotricum spp.), Cercospora leaf spot (Cercospora capsici), Phytophthora blight (P. capsici), wilts and viral diseases. Anthracnose. Anthracnose incidence was significantly (P<0.001) different among genotypes (Tables 3 and 4). When pooled across seasons for 25 common genotypes, anthracnose incidence was not influenced by season and genotype (P>0.05). However, it was highly influenced by genotype X season (GxE) interaction (P<0.001) (Table 5). More genotypes in season 2009B had higher anthracnose incidence than those in 2009A. In season 2009A, local genotypes were more infected than exotic genotypes. The reverse was true in season 2009B where local genotypes had lower anthracnose incidence than the introduced genotypes. High incidences among local genotypes were recorded in genotype 7 followed by 6 and in season 2009B, it was genotype 8, followed by 6. Local genotype 4 was consistently not attacked by anthracnose in both seasons while local genotype 6 consistently had higher anthracnose incidence than other local genotypes. Nine exotic genotypes had incidences greater than 50% in 2009A while they were 8 genotypes in season 2009B. Introduced genotypes had the highest anthracnose incidences in that order in 2009A; while in 2009B introduced genotypes had the highest incidences. The introduced Chinese genotype 1 consistently registered no anthracnose disease; while the AVRDC genotype 21 consistently had lower incidences of the disease. Similarly, the AVRDC genotypes 15, 20 and 25 consistently registered higher incidences. Of the controls, the local genotype 3 had the lowest incidence compared to the AVRDC controls 11 and 12 that had intermediate incidences. Cercospora leaf spot. Cercospora leaf spot was the most abundant disease in season 2009B and the second most abundant in season 2009A (Tables 3 and 4). There were significant differences in leaf spot infestation among genotypes (P<0.05), and in 2009B infestation was significantly (P<0.001) different among genotypes. Genotype X season (GxE) was highly significant (P<0.001). Cercospora leaf spot incidence did not vary significantly with season and/or genotype (Table 5). All local and exotic genotypes exhibited high incidences of Cercospora leaf spot (Table 3 and 4). Higher incidences of Cercospora leafspot were recorded in 2009B (compared with those in 2009A. The introduced genotypes, on average, had relatively higher Cercospora leaf spot incidences than the local genotypes. In season 2009A, the lowest incidence among local genotypes was recorded on genotype 10, followed by 4, while the highest was recorded on two genotypes 6 and 7. Only the commercial local check, genotype 3, consistently scored relatively low incidences in both seasons 2009A and 2009B. The local genotype 7 consistently had the highest number of plants infected in both seasons). Nine introduced genotypes in 2009A were completely infected with Cercospora leaf spot compared to 16 in season 2009B. In season 2009A, the lowest incidence was recorded on control genotype 12 followed by 14 and in 2009B, the lowest infected were 17 followed by genotype 21. Phytophthora blight. Genotypes exhibited significant differences (P<0.001) with respect to Phytophthora blight incidence for season 2009A (Tables 3 and 4) unlike season 2009B (P>0.05). Overall, genotypes from season 2009A had higher Phytophthora blight incidence than those from season 2009B. Fewer plants of local genotypes were infected compared to the introduced genotypes in season 2009A. On the contrary, more plants of local genotypes were infected compared to the introduced genotypes in season 2009B. Of the local genotypes, 2 and 8 were more infected at 41.2 and 32.1% incidence, respectively; while the more infected among the introduced genotypes in descending order were 20, 17 and 15 (Tables 3 and 4). In season 2009B, the more abundantly infected local genotype was 2; while the exotic genotype in season 2009B was 13. Season X genotype had no significant effect on Phytophthora blight incidence. However, there was a strong (P<0.001) influence of genotype X season on Phytophthora incidence (Table 5). Viral disease. Viral diseases were abundant in the two seasons together with Cercospora leaf spot (Tables 3 and 4). Viral infections were the most abundant in season 2009A and second most abundant in 2009B. In both seasons, no genotype was found symptomless. Furthermore, there was no significant virus incidence in season 2009A among genotypes (P>0.05). However, results for season 2009B clearly indicated highly significant variability (P<0.001) among genotypes. There was a high seasonal difference (P<0.01) and genotype X season (GxE) (P<0.001) interaction for viral disease incidence, though this did not vary significantly with genotype across seasons (Table 5). Overall, genotypes in 2009A had higher viral incidence than those in 2009B. In general, season 2009A registered higher disease incidence for both local and introduced genotypes than season 2009B. In season 2009A, 55.6% of the local genotypes got 100% infected with virus diseases compared to 50% of the introduced genotypes, while in season 2009B, 33.3% of the local genotypes got 100% infected compared to 15.4% of the exotic genotypes. Of the local genotypes, genotypes 5 and 6 consistently exhibited high incidence levels of viral disease infection; while only the local commercial check (genotype 3) consistently registered low incidences across seasons. Among the introduced genotypes, the AVRDC genotype 35 (evaluated only in season 2009B) was the least infected with the virus disease (Table 4). However, genotypes 17 and 22 systematically had the lowest virus disease incidences over both seasons (Table 3 and 4). Wilt disease. Wilt disease was the least abundant of all the five diseases across the seasons (Tables 3 and 4). There were highly significant disease incidences among genotypes in both seasons) (Tables 3 and 4). There were also highly significant (P<0.001) genotype X season interaction effects on wilt disease incidence (Table 5). Season 2009A had significantly lower wilt disease incidence compared to season 2009B. The percentage of local genotypes infected was lower than that for exotic genotypes in 2009A, similarly a greater percentage of introduced genotypes were infected than local genotypes in season 2009B. Local genotypes 6 and 7 and introduced genotypes 20, 17, 15 and 25 had higher wilt incidences in season 2009A and the reverse was true in 2009B with significantly lower incidences (genotypes18 and 15) or no infection (genotypes 6, 7, 17 and 25) (Tables 3 and 4). Disease severity index Viral diseases. The severity index for viral diseases significantly (P=0.029) varied among genotypes in 2009A and 2009B, respectively (Tables 5 and 6). Pooled analysis of variance for the 25 genotypes common to both seasons indicated a highly significant (P<0.001) effect in both season and genotype X season (GxE) interaction. There was no pooled significant genotype effect with respect to virus severity index. Season 2009A registered higher disease severity index than season 2009B. A similar trend was observed when genotypes were partitioned with respect to their places of origin. All genotypes were more severely infected in 2009A; though, local types exhibited a relatively higher mean severity index than exotic types. A similar trend was observed in 2009B with local types exhibiting higher severity index than exotic types. Local genotypes 2 and 4 were below the overall mean in both seasons. Genotypes 2, 5, and 10 were the most severely infected by the viruses in 2009A while, genotypes 5 and 6 were the most severely infected in 2009B (Tables 5 and 6). Local genotypes 4 and 10 consistently registered low severity indices in both seasons. Exotic genotypes in 2009A were significantly more severely infected than in 2009B. Of the exotic genotypes in 2009A, four had their severity index scores above the overall mean with genotypes 17 and 1 having the highest scores. In 2009B, the infected genotypes were 14 and 26 while; genotypes 17 and 12 were the least infected with severity index of 4.8 and 7.9%, respectively. Mean severity indices for all the exotic genotypes in 2009B were below the overall mean (Table 6). Cercospora leaf spot. Cercospora leaf spot severity indices were highly significantly (P<0.001) different among genotypes (Tables 5 and 6). Season 2009A had low Cercospora leaf spot severity indices than 2009B. There was a highly significant season (P<0.01) and genotype X season (GxE) (P<0.001) Cersospora severity index interaction effect. However, it did not vary significantly with genotype. Local genotypes in 2009A suffered less Cercospora leaf spot severity index than in season 2009B. Local genotypes 6 and 7 were the most severely infected in 2009A; while genotypes 8 and 7 were the most severely infected in 2009B (Tables 5 and 6). Local genotypes 4 and 5 consistently registered low severity indices in both seasons. Likewise, exotic genotypes in 2009A were significantly less severely infected than in 2009B. Of the exotic genotypes in 2009A, seven genotypes had their severity index scores above the overall mean with genotypes 17 (75%) and 1 (79.8%) having the highest. In 2009B, the severely infected genotypes were 29, 32, 33, 27, 14, 28, 34, 16; with genotypes 34, 16 topping the list. Genotypes 25 and 17 were the least severely infected (severity index 19.1 and 23.1%, respectively) (Table 6). Some genotypes that severely scored high in season 2009A such as 15 and 17 scored low in 2009B. Similarly, some genotypes such as 14 and 16 that scored low in 2009A scored high in 2009B. Exotic genotypes 1 and 18 consistently registered high severity indices. Anthracnose. This was the second least severe disease observed in the study in both seasons of 2009A and 2009B. Highly significant differences (P<0.001) were observed in both seasons, with respect to anthracnose severity index (Tables 5 and 6). Plants in 2009A were generally more severely infected than those in 2009B; with overall means being 23.9 and 16.6%, respectively. However, in both seasons, exotic genotypes were consistently more infected than the local genotypes. In 2009A, local genotypes 6 and 7 had higher severity indices while in 2009B, they were genotypes 6 and 8 that had higher anthracnose severity indices. Exotic genotypes 20, 17, 15 and 25 had higher severity indices, while in 2009B; they were genotypes 32 and 34 that scored high severity index . There was a high genotype X season (P<0.001) interaction effect with respect to anthracnose severity indices. The index, though, did not vary significantly with season and genotype . Local genotypes 2, 3, 4, 5, 9 and 10; and exotic genotypes 1, 11, 12, 18 and 21 consistently scored low in both seasons. Local genotype 6 and exotic genotype 19 was consistently severely infected in both seasons. Phytophthora blight. Of all diseases whose severity indices were calculated, Phytophthora blight was the least severe in both seasons 2009A and 2009B (Tables 5 and 6). Anthracnose infestation among genotypes was significantly different (P=0.002) in season 2009A, but not in 2009B. Local genotypes were more severely infected in 2009B than those in 2009A. The exotic genotypes in 2009A had high but insignificant mean severity index compared with that of 2009B. However, season 2009B generally had high severely infected genotypes relative to those in season 2009A. In 2009A, three local genotypes had higher severity indices above the overall mean, with 8 and 2 being the most severely infected. In 2009B, 78.8% of the local genotypes, had severity indices above the overall mean (8.5%), with genotype 2 significantly being the most severely infected, followed by 4. Four exotic genotypes in 2009A had severity indices above the overall mean (8.5%), with genotype 20 being the most severely infected (44.2%), followed by genotype 17 (36.6%). There were, however, no significant differences in anthracnose infestation among genotypes in 2009B, although genotypes 13 and 20 were the most severely infected, with most exotic genotypes (55.2%) scoring below the mean (Table 6). Overall, there was no significant genotype x season interaction effect with Phytophthora blight severity indices. However, the indices varied significantly (P<0.05) with season and genotype. Local genotypes 5, 6 and exotic genotypes 12, 14, 18 and 11 consistently registered low severity indices in both seasons; while local genotypes 2, 3 and exotic genotypes 20 and 15 consistently got severely infected in both seasons. Disease reaction rating. Grouping of genotypes on the basis of their reaction to individual field diseases facilitated the identification of resistant and susceptible genotypes in season 2009A and 2009B (Table 7a, 7b). In 2009A, based on the wilt disease incidence rating, 16 accessions including both the AVRDC check accessions 11, 12 and the local commercial check accession 3 were rated highly resistant (0% wilting), 6 accessions were rated resistant (1-10% wilting), 2 moderately resistant (11-20% wilting) and 1 moderately susceptible (21-30% wilting). Fourteen genotypes were highly resistant, 13 resistant, and 8 moderately resistant in 2009B (Table 7a, 7b). None of the genotypes in both seasons 2009A and 2009B highly resisted virus disease based on the severity index (SI) resistance ratings (Table 7a, 7b). Ten genotypes were moderately susceptible (21-40% SI); 14 were susceptible (41-60% SI); while 1 local genotype (10) was highly susceptible (> 60% SI) in 2009A. In 2009B, 4 genotypes were resistant (<10% SI), 9 were moderately resistant, 13 were moderately susceptible (21-40% SI), 9 were susceptible (41-60% SI) and none was highly susceptible (> 60% SI) (Table 7a, 7b). Based on the Cercospora leaf spot disease severity index scores in 2009A, 2 genotypes including one AVRDC check genotype 12 were resistant (<10% SI), 3 moderately resistant (1020% SI), 11 moderately susceptible (21-40% SI), 4 susceptible (0% SI), and 5 highly susceptible (> 60% SI). In 2009B, none of the genotypes was resistant. One genotype was highly resistant (0% SI), 2 moderately resistant (10-20% SI), 10 were moderately susceptible (21-40% SI), 4 were susceptible (41-60 % SI), and 18 highly susceptible (> 60% SI) (Table 7a, 7b). The Phytophthora blight severity index rating in 2009A categorised genotypes into 10, including the AVRDC control 12 and 5 local genotypes as being highly resistant (0% SI), 5 genotypes, namely 10, 11, 13, 19 and 23 were resistant (<10% SI), 4 genotypes (Local checks 3, 15, 16 and 8) moderately resistant (10-20% SI) and 3 moderately susceptible (21-40% SI) (Table 7a, 7b). Similarly, in 2009B, 9 genotypes were highly resistant (0% SI), 9 genotype were resistant (<10% SI), 13 moderately resistant (10-20% SI), 3 were moderately susceptible (21-40% SI), 1 was susceptible (41-60 % SI) and none was highly susceptible (> 60% SI) (Table 7a, 7b). In 2009A, 28% of the genotypes including 5 local and 2 exotic genotypes were highly resistant (0% SI) for anthracnose (Table 7a, 7b). While, 24% were resistant (<10% SI), including the local commercial check 3; 12% moderately resistant (1020% SI) including the 2 AVRDC checks 11 and 12; 8% moderately susceptible; and 24 % were categorised as highly susceptible (>60% SI). In 2009B, 26% genotypes were categorised as highly resistant (0% SI); 23% as resistant (<10% SI); 20% moderately resistant (10-20% SI); 20% moderately susceptible (21-40% SI); 9% susceptible (41-60% SI); while only 1 genotype 34 (3%) was rated as highly susceptible (>60% SI) (Table 7a, 7b). Relationship between yield and disease parameters. In both season 2009A (Table 8) and 2009B (Table 9), the correlation between disease incidence and disease severity index, respectively, indicated high positive correlation between anthracnose incidence and severity index (r = 0.971***, 0.821***), Cercospora leaf spot incidence and severity index (r = 0.736***, 0.626***), Phytophthora blight incidence and severity index (r = 0.946***, 0.985***) except for virus disease where its incidence did not significantly correlate with its severity index in season 2009A (r = 0.273, 0.852*** ). In season 2009A, different diseases that correlated positively were; Anthracnose incidence and Cercospora leaf spot severity index (r=0.523*), Anthracnose severity index and Cercospora leaf spot severity index (r=0.552*) and wilt incidence with virus incidence (r=0.409**). Similarly, in 2009B diseases that positively correlated with others were; wilt incidence with anthracnose severity index (r=0.501**), wilt incidence with anthracnose incidence (r=0.471**). In season 2009A (Table 8), except for virus disease, all diseases negatively correlated with both total fruit yield and total marketable fruit yield but the correlation was only significant with both anthracnose incidence (r=-0.615**) and anthracnose severity index (r=-0.562**) for total fruit yield and both anthracnose incidence (r=0.503**) and anthracnose severity index (r=0.481**) for total marketable fruit yield, respectively. Non-significant negative and positive relationships were observed for virus incidence with total fruit yield and total marketable fruit yield, respectively. The reverse was true for virus severity index. However, in season 2009B the pattern of correlation of diseases with yield was different (Table 9). Virus severity index significantly negatively correlated (r=-0.358*) with total fruit yield. Cercospora leaf spot incidence negatively correlated significantly with total fruit yield (r=-0.630***). Disease trait stability analysis. Genotypes with high correlation across seasons were considered stable for that trait. The correlations between 2009A and 2009B values were highly significant for virus severity index (r= 0.5086; P=0.009) and significant for Phytophthora blight severity index (r=0.416; P=0.039). The rest of the parameters had insignificant correlations. Virus severity index was the most stable while virus incidence was the least stable (r = -0.034) followed by Cercospora leafspot severity index (r=-0.138). DISCUSSION During both growing seasons of 2009A and 2009B, various diseases infected hot peppers in the field including. These included viral, wilt, Phytophthora blight, Cercospora leaf spot, anthracnose and bacterial spot disease. Bacterial spot was not scored in both seasons because it had unfamiliar symptoms (numerous small water soaked lesions, extensive defoliation and shoot dieback with no fruits at all on infected plants) compared to the symptoms described in the AVRDC field disease compendium (Black et al., 1991) and was confirmed from 2009B evaluation. Highly significant differences among genotypes for anthracnose and wilt disease incidences were observed across seasons. Cercospora leaf spot incidence was highly significant in 2009B and only significant (P = 0.047) in 2009A. Genotypes were highly significantly different (P<0.001) for Phytophthora blight incidence in 2009B, though not in 2009A. Viral disease incidence was highly significantly different among genotypes in 2009A (P<0.001) but did not manifest significantly in 2009B. Similarly, much as there were significant differences among genotypes for viral, anthracnose and Cercospora leaf spot severity indices in both seasons, the level of significance was very high except for viral severity index that was significant (P=0.029) in 2009A. Phytophthora blight severity index was highly significantly different (P=0.002) in 2009A, but did not differ significantly among genotypes in 2009B. This irregular differential expression of significant differences in both seasons for Cercospora leaf spot, Phytophthora blight and viral disease incidences and Cercospora leaf spot and Phytophthora blight severity indices is attributed to the effect of GXE interaction. Disease incidences were higher in 2009A than 2009B for viral disease and Phytophthora blight. However, for anthracnose, Cercospora leaf spot and wilt disease incidences were higher in 2009B than 2009A. Viral disease (mean incidence 93.3%) was the most common in 2009A, followed by Cercospora leaf spot (88.4%); while in 2009B it was Cercospora leaf spot (mean incidence 91.2%), followed by viral disease (mean incidence 74.7%). These two disease incidences in 2009A and 2009B were, respectively followed in descending order by anthracnose, Phytophthora blight and wilt disease incidences. These results indicate differential performance of genotypes with respect to disease incidences with 2009A, favouring the occurrence of viral and Phytophthora blight diseases; while 2009B favouring the occurrence of anthracnose, Cercospora leaf spot and wilt diseases. Severity indices were higher in 2009A than 2009B for viral and anthracnose diseases; while Cercospora leaf spot and Phytophthora blight severity indices were higher in 2009B than 2009A. This implies that season 2009A favoured the amount of viral and anthracnose diseases, while the amount of Cercospora leaf spot and Phytophthora blight diseases were favoured in 2009B. The most severe disease in 2009A was that caused by viruses (mean severity index (41.8%), followed by Cercospora leaf spot (38.9%). In 2009B it was Cercospora leaf spot (mean severity index 57.6%), followed by viral diseases (mean severity index (32.9%). These two disease severity indices were respectively followed in descending order by anthracnose in 2009A, and Phytophthora blight in 2009B. The higher occurrence and amount of bacterial and fungal diseases (bacterial wilt, Cercospora leaf spot, anthracnose and Phytophthora blight) in 2009B than 2009A was due to too much rainfall (average rainfall for the period of experimentation was 92.9 mm in 2009A and 133 mm in 2009B ) and consequently high humidity that favour the development of fungal and bacterial diseases (Agrios, 2005). The exceptions of higher Phytophthora blight incidence and Anthracnose severity index in 2009A than 2009B might have been due to GxE interaction or sampling error. The higher viral incidence and severity in 2009A than 2009B is attributed to dry weather conditions experienced in 2009A that provided a conducive atmosphere for the growth and proliferation of insect pests such as aphids, thrips, whiteflies that vector viral diseases (Agrios, 2005).However, high rainfall in 2009B might have affected insect vector activity leading to the observed low viral disease incidence and severity. Generally, the inconsistent occurrence and severity of some diseases suggest that breeding for their resistance should target specific seasons. There was no significant influence of season and genotypes on all disease incidences, with the exception of viral incidence that highly differed across seasons. However, all disease incidences were highly influenced by genotype X season (GxE) interaction. Similarly, there was no significant difference among genotypes for all disease severity indices, except Phytophthora blight severity index when pooled across seasons. However, environments differed significantly from each other for all disease severity indices except anthracnose severity index. The effect of G x E interaction was also highly significant for all disease severity indices, except Phytophthora blight severity index. These results indicate that all the 25 genotypes performed similarly for all disease incidences and severity indices when pooled across seasons; while season had a differential effect on only viral incidence and anthracnose severity index. The effect of GxE interaction, however, indicates variation in genotypic performance with change in environment for disease incidences and severity indices, apart from Phytophthora blight severity index. In both rainy seasons, both local genotypes consistently registered lower incidences than exotic genotypes, of wilt, Cercospora leaf spot and Phytophthora blight. On the other hand, local genotypes consistently had relatively high viral incidence than exotic genotypes in both seasons). Anthracnose incidence was higher in 2009A among local genotypes; while in 2009B, it was higher among exotic genotypes. Local genotypes were consistently severely less infected by Phytophthora blight, anthracnose , and Cercospora leaf spot than exotic genotypes in both 2009A and 2009B. On the contrary, local types were consistently more severely infected in both seasons than exotic ones by viral diseases. These results indicate that local genotypes performed better than exotic genotypes in resistance to Cercospora leaf spot and Phytophthora blight disease incidences and severities; while exotic genotypes performed better in viral disease incidences and severity index; and anthracnose severity index in both seasons. The lack of consistence of genotype performance in both seasons for anthracnose incidence was due to the influence of GxE interactions for this trait. Except for virus disease, all diseases negatively correlated with both total fruit yield and total marketable fruit yield in 2009A, implying that they contributed to the loss of both total and marketable fruit yields. However, anthracnose caused by Colletotrichum spp contributed more to this loss since only its incidence and severity index highly significantly correlated negatively with total and marketable fruit yields. Anthracnose has been found to cause marketable yield reductions in the range 10 to 80% in Thailand (Poonpolgul and Kumphai, 2007). However, in 2009B, only virus severity index and Cercospora leaf spot incidence significantly correlated negatively with total fruit yield implying that viral severity and Cercospora leaf spot incidence contributed more to total fruit yield loss. This also suggests that resistance to these diseases may be enhanced by genotypes with higher total and marketable fruit yields. These results agree with those of previous researchers who reported negative correlation between disease traits and yield on various crops (Pratt et al., 1994; Fokunang et al., 2000; AVRDC, 2007). In this study, variability in the influence of disease incidence and severity on total and marketable fruit yields was observed in 2009A and 2009B as shown for example, by the low and high negative correlations for Cercospora leaf spot incidence with total (r=-0.336, -0.639***) and marketable (r=-0.382, -0.196) fruit yields, Cercospora leaf spot severity index with total marketable fruit yields (r=-0.338, -0.016), low positive and high positive correlation for virus severity index with total fruit yield (r= 0.013, 0.358*) and low and high negative correlation for wilt incidence with total fruit yield (r=-0.310, 0.088). This is attributed to the effect of GxE interactions, which influence epidemiology of field diseases (Fokunang et al., 2000). The lack of negative correlation of disease assessment methods in both 2009A and 2009B complicates interpretation since it would imply that increase in disease incidence and severity increased the total fruit and marketable fruit yields they, respectively correlated with positively. This was demonstrated for virus incidence with total marketable fruit yield, virus severity index with total fruit yield in 2009A and anthracnose incidence and severity index with total fruit and marketable fruit yield, Phytophthora blight incidence and severity with total fruit yield, virus incidence with total fruit yield, virus severity index with total and marketable fruit yield in 2009B. This, however, could probably indicate that the conditions that favoured the occurrence and expression of these diseases also favoured total and marketable fruit yields. This phenomenon has also been observed by Fokunang et al. (2000) on positive correlation (r=0.21) of cassava anthracnose disease severity with storage root yield. Results from correlating disease incidences with their respective disease severity indices indicated high significant and positive correlation (P<0.001) except for virus disease. This high significant correlation between the two assessment methods also indicated that more precision was allowed during assessment (González-Pérez et al., 2011). This further suggests that the incidence of anthracnose, Cercospora leaf spot and Phytophthora blight diseases can predict their severity. Because disease incidence data is easily obtained and severity scoring with visual inspection tends to be subjective due to the variations or errors of visual acuity (Scott and Rosenkranz, 1981; González-Pérez et al., 2011), future assessment of these diseases could be based on disease incidence. However, some genotypes had high disease incidences but low severities and vice versa. For example, in combined season analysis (data not shown) the local genotype 4 incidence for Cercospora leaf spot was 75.2% and severity index was 44.9% while incidence for the AVRDC genotype 22 was 97.7% with a severity index of 34.7%. This indicates that for such genotypes, none of the assessment methods is consistent and thus, both methods are equally good and should be used in evaluation for resistance to this disease. Such discrepancy was also observed by Pratt et al. (1994). The same can be said of viral diseases that lacked consistent incidence and severity index among some genotypes for pooled analysis across seasons such as in the AVRDC genotype 8 whose viral incidence was 81.5 % and severity index 40.1% and genotype 25 that had a virus incidence of 95.8% and a severity index of 31.8%. This finding is further supported by the lack of consistent significant positive correlation of incidence and severity in the two evaluation seasons probably due to the effect of GxE interaction. Correlation to identify stable disease assessment methods for individual disease traits among genotypes common to both 2009A and 2009B indicated insignificant correlation for majority disease traits except Phytophthora blight severity index (r = 0.416, P = 0.039) and virus severity index (r = 0.509, P = 0.0094). This indicates that for most disease traits, both assessment methods were not stable except for virus severity index that was most stable followed by Phytophthora blight severity index. This might have been due to the differences in environmental factors that influenced the disease occurrence (inoculum levels) in the different seasons. Therefore, for these two diseases, severity index is the most efficient assessment method and for the rest, both methods are equally important. The significant correlation observed between anthracnose incidence, severity index and Cercospora leaf spot severity index (r=0.523*, 0.552*, respectively), wilt incidence with virus incidence (r=0.409**) among genotypes in 2009A and between wilt incidence and severity index, (r=0.471**, r=0.501**, respectively) in 2009B, suggest possible synergistic relationship of the causal pathogens (Fokunang et al., 2000). This implies that in a breeding programme, selection for resistance to either disease could result in resistance to the other disease (Fokunang et al., 2000). Studies on controlled inoculation of the causal pathogens among pepper genotypes would confirm this synergy. Nevertheless, this synergy, if present, is dependent on environmental conditions. For example, anthracnose disease correlated with Cercospora leaf spot in 2009A and correlated with wilt disease in 2009B. A disease synergistic relationship was observed on cassava clones inoculated by cassava bacterial blight and cassava anthracnose disease pathogens in nurseries and screenhouse trials (Muyolo, 1984 cited in Fokunang et al., 2000). When disease reactions were assigned to genotypes on the basis of incidence (wilt disease) and severity indices (other diseases), reactions were differential. No genotype was found to be resistant to all evaluated field diseases, although some were resistant to one or more diseases. One such case is the AVRDC control genotype 12 that was resistant to all diseases and moderately resistant to viral disease. However, majority of the genotypes were susceptible to all diseases, apart from the wilts and Phytophthora blight that were not as significant, when ranked. It is not clearly known whether the evaluated genotypes were resistant to these two diseases or, if it was due to disease escape because of low level of inocula for these diseases. The high resistance reactions against these diseases could thus, be due to genetic differences among genotypes, environmental conditions and composition in the pathogen population responsible for the different diseases (Adipala et al., 2001). Disease resistance evaluation in uncontrolled inoculation field experiments can be constrained by environmental factor differences that cause disease escapes due to unpredictable occurrence, severity, and nonuniformity of epiphytotics (Fokunang et al., 2000; Agrios, 2005). Artificial inoculation would, therefore, be a more reliable avenue for confirming field resistance to wilt and Phytophthora blight diseases. CONCLUSION Majority of genotypes used in this study perform poorly in response to Cercospora leaf spot and virus diseases indicating susceptibility to these biotic constraits. Local genotypes 3 and 5 and exotic genotypes 14, 18, 22, 25, 11, 12, and 3 consistently score better in all disease traits across seasons as well as the exotic genotypes 27, 28, 29, 30, 31, 32, 33 and 35. Genotypes that score well for disease resistance tend to yield poorer than their contrasting counterparts. Only exotic genotypes 1, 12 and 25 that yield high in both seasons score well for at least two diseases; while exotic genotypes 33, 27, 31, 35, 29, 30 evaluated in season 2009B only give higher yields and score well in more than 2 diseases. Such genotypes are recommended to farmers and breeding for disease resistance. Genotypes 33, 32, 27, 26, 31, 35, 29 and 30 had high yields and good attributes for the traits evaluated. ACKNOWLEDGEMENT We thank The Alliance for Green Revolution in Africa (AGRA) Programme for Africa’s Seed Systems (PASS) project through Regional Universities Forum for Capacity Building in Agriculture (RUFORUM) for funding this study. We also thank the Director National Agricultural Research Laboratories Institute (NARL) for allowing us to raise pepper seedlings in their screen house. Special thanks also got to the National Crops Resources Research Institute (NaCRRI) for providing fields for the experiment. REFERENCES
Copyright © 2012 - African Crop Science Society The following images related to this document are available:Photo images[cs12016t3.jpg] [cs12016t9.jpg] [cs12016t8.jpg] [cs12016t7b.jpg] [cs12016t5.jpg] [cs12016t7a.jpg] [cs12016t1.jpg] [cs12016t2.jpg] [cs12016t4.jpg] [cs12016t6.jpg] |
| |||||||||
