 |
| About Bioline | All Journals | Testimonials | Membership | News |
|
||||||
|
||||||
African Crop Science Journal, Vol. 20, Supp. 1, 2012, pp. 123-139 Field performance and quality traits of hot pepper genotypes in Uganda V. Nsabiyera, M. Ochwo-Ssemakula and P. Sseruwagi1 College of Agricultural and Environmental Sciences, Makerere University, P. O. Box 7062, Kampala, Uganda
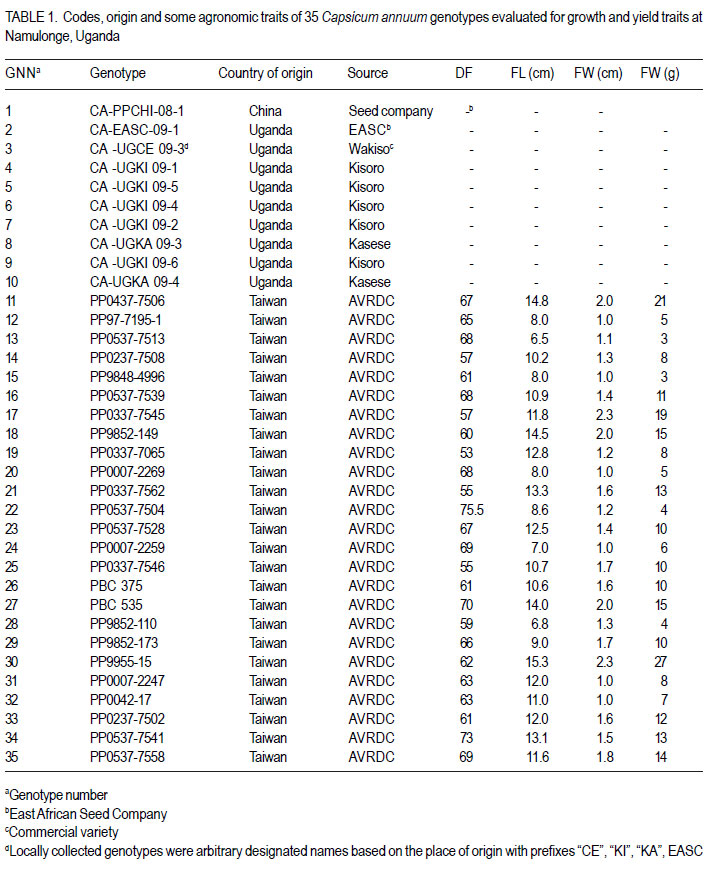
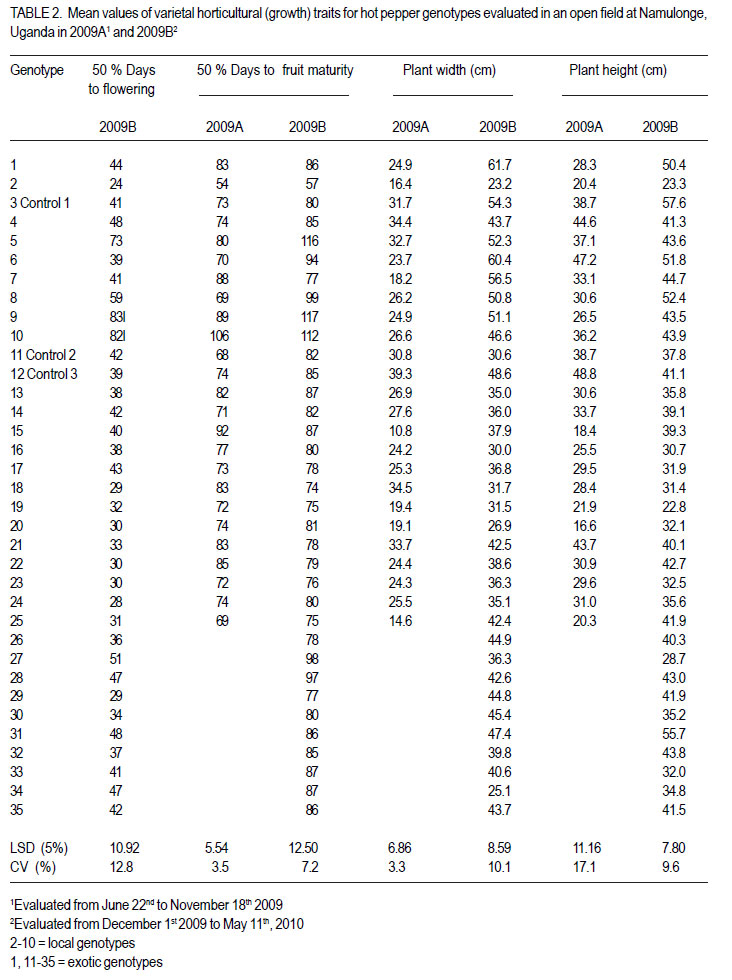
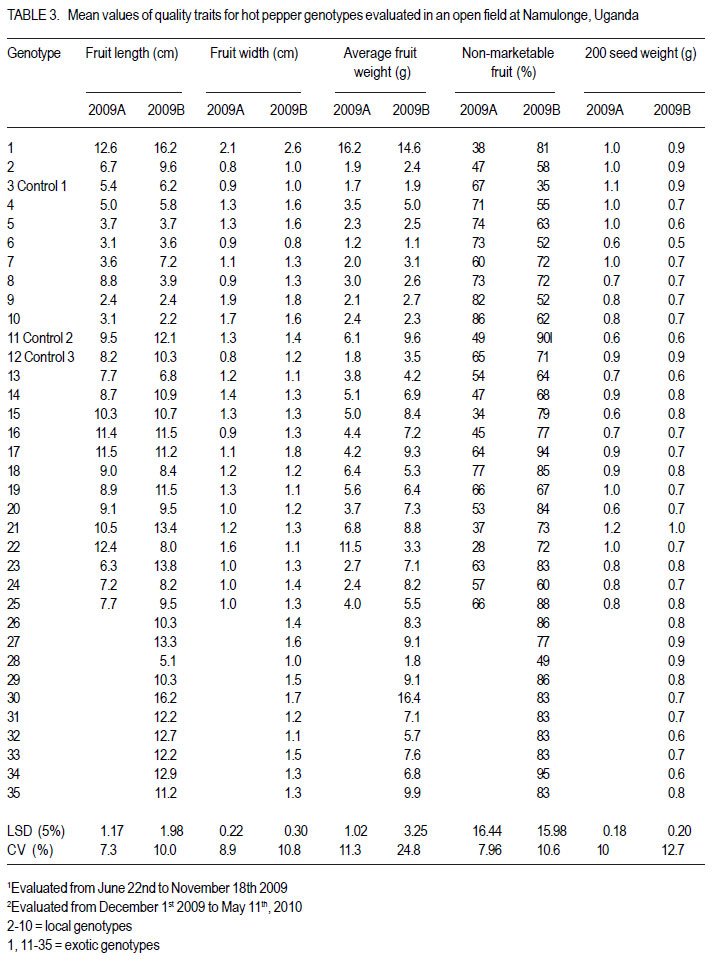
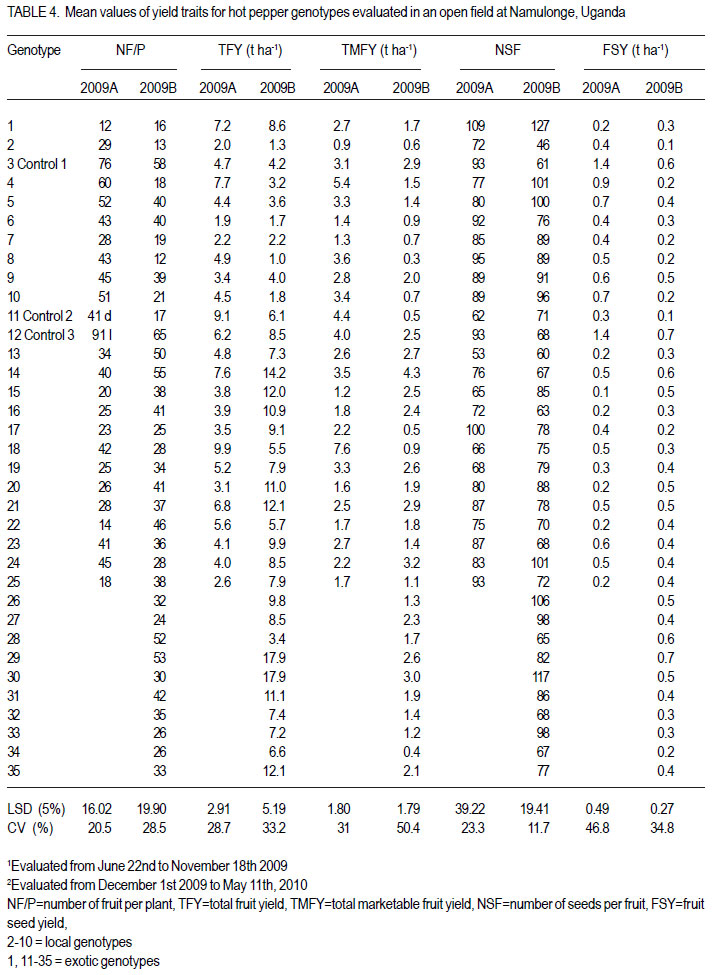
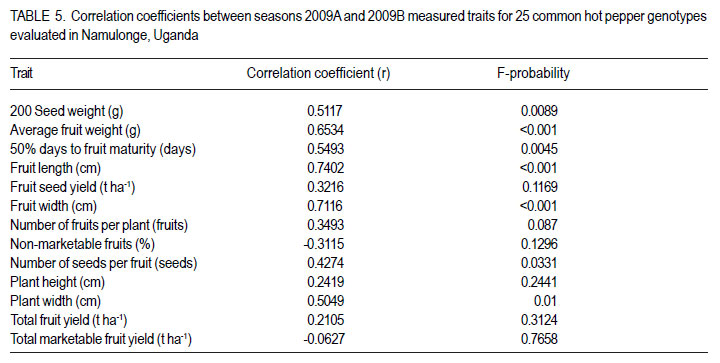
Code Number: cs12020 ABSTRACT Hot pepper (Capsicum annuum) is increasingly an important economic crop in Uganda that requires attention for increased production. Genotypes with superior growth, quality and yield traits are crucial for use in pepper cultivar improvement efforts and use by farmers. To identify such genotypes, agronomic characteristics including growth, quality and yield traits of 26 exotic and 9 local genotypes were evaluated on-station during the growing seasons of 2009 (2009A and B) in Central Uganda. Significant differences were observed in all plant growth, and most yield and quality (P<0.001) traits. Except for number of seeds per fruit, highly significant genotype X season (P<0.001) interactions were observed in other traits. Pepper genotypes during season 2009B exhibited superior performance than in season 2009A in majority of the traits except for number of seeds per fruit, seed yield, 200 seed weight and percentage non-marketable fruits. Local genotypes performed better in season 2009A than in 2009B. The commercial local check genotype CA -UGCE 09-3 performed better than all the local genotypes and most exotic genotypes in fruit yield and early maturity. The East African Seed Company local genotype CA-EASC-09-1 was the earliest maturing variety among all genotypes. The Asian Vegetable Research and Development Centre (AVRDC) check genotype 12 (PP97-7195-1) performed the best among all the exotic genotypes in all traits except fruit size. Eight of the agronomic traits showed significant correlations between seasons indicating stability for these traits. Fruit length and width were the most stable quantitative traits. These findings reveal that traits of interest in C. annuum that vary with the environment may be improved by using suitable cropping seasons and management practices. Key Words: Agronomic traits, Capsicum annuum, seeds RÉSUMÉ Le piment (Capsicum annuum) est une culture économique de plus en plus importante en Uganda qui mérite plus d’attention pour accroître sa production. Les génotypes à haute capacité de croissance, de qualité et traits de rendement sont nécessaires dans de programmes d’amélioration des cultivars du piment et l’utilisation par des fermiers. Pour identifier de tels génotypes, de caractéristiques agronomiques incluant la croissance, la qualité et les traits de rendement de 26 génotypes exotiques et 9 locaux étaient évalués en station au cours des saisons de culture 2009 A et 2009 B au Centre de l’Ouganda. Des différences significatives étaient observées dans tous les traits de croissance, surtout le rendement et les traits de qualité (P<0.001). Excepté le nombre de grains par fruit, les interactions hautement significatives génotype X saison (P<0.001) étaient observées dans d’autres traits. Les génotypes de piment ont manifesté une performance plus supérieure qu’en saison 2009 A dans la majorité des traits sauf pour le nombre de grains par fruit, le poids de 200 grains et le pourcentage de fruits non commerciables. Les génotypes locaux ont montré de meilleures performances en saison 2009A qu’en 2009B. Le génotype commercial CA-UGCE 09-3 qui était pris pour témoins local avait été plus performant que tous les génotypes locaux et laplupart des génotypes exotiques en terme de rendement en fruits et la précocité alors que le génotype local CA-EASC-09-1 de la société de vente de semence était la variété la plus précoce parmi tous les génotypes. Le génotype témoins 12(PP97-7195-1) du Centre Asiatique de Recherche et Développement sur les Légumes (AVRDC) a été le plus performant par rapport à tous les génotypes exotiques dans tous les traits sauf la taille de fruits. Huit des traits agronomiques ont montré de corrélations significatives entre saisons indiquant la stabilité pour de ces traits. La longueur et la largeur de fruits constituaient des traits quantitatifs les plus stables. Ces résultats révèlent que les traits d’intérêt dans C. annuum qui varient avwc l’environnement pourraient être amélorés en utilisant des saisons culturales appropriées et la gestion des pratiques. Mots Clés: Traits agronomiques, Capsicum annuum, grains INTRODUCTION Hot pepper (Capsicum spp.) is one of the most varied and widely used foods in the world (Terry and Boyhan, 2006). It ranks third in importance among important vegetables after peas and tomatoes (Ochoa-Alej and Ramirez-Malagon, 2001; Ali, 2006) and is the world’s second most important Solanaceous vegetable, after tomatoes (Yoon et al., 1989). In addition to its value as a spice for foods, it has many nutritional and medicinal uses and provides ornamental plants (Palevitch and Cracker, 1995; Pérez-Gálvez et al., 2003). Hot pepper reportedly treats many diseases and ailments (Perucka and Materska, 2001; Tsuchiya, 2001; Vicente et al., 2007; Manjunatha and Srinivasan, 2007; Topuz and Ozdemir, 2007). It is, hence, increasingly an economic crop worldwide, with cultivation on more than 3.7 million hectares annually. With the Government of Uganda initiating an export diversification programme that targeted horticultural crops as a means of boosting national revenue (Dijkstra, 2001), commercial production of hot pepper began in the 1990s (Tusiime et al., 2010). The yield potential of this crop in Uganda has been limited by abiotic and biotic stresses as well as lack of improved cultivars (Anonymous, 2010). These local genotypes are of poor quality probably due to their inherent genetic factors in diverse cross combinations (Hannan et al., 2007). There is, therefore, need to identify potential genotypes for hot pepper improvement in order to increase production to meet growing market demand (Balkaya and Karaaðaç, 2009). In an effort to develop a crop improvement programme, a massive pepper germplasm is collected and screened in order to identify desired genotypes with traits of importance to the farmers and the target markets such as big pungent fruit, high yielding and disease resistant genotypes (Singh et al., 2006; Makoka et al., 2010; Valenzuela, 2011). This study was, thus, conducted to evaluate local and exotic pepper genotypes to identify superior types with desirable growth, quality and yield traits under natural environmental conditions. MATERIALS AND METHODS Study area and genotypes used. Field experiments were conducted at the National Crops Resources Research Institute (NaCRRI) in Uganda at 0°32’N and 32°7’E and at 1150 metres above sea level (m a.s.l). The soils are ferralitic (red sandy clay loams) and have a pH range of 4.9-5.0. The average annual rainfall and temperature are 1,270 mm and 22.2 oC, respectively. Thirty five hot pepper genotypes were evaluated for agronomic traits, including 26 exotic and 9 local genotypes (Table 1). Twenty five exotic genotypes were imported from the Asian Vegetable Research and Development Centre (AVRDC) in Taiwan. One exotic genotype was provided by the National Horticultural Research Programme of NARO, Uganda and had been originally sourced from a seed company in China. The local pepper germplasm was mainly obtained from farmers’ fields in Wakiso district (central region); Kisoro and Kasese districts (western region), with only one from a commercial seed company in Kampala. Three checks were included in the trials, plus two varieties from AVRDC: 12 (PP97-7195-1), 11 (PP0437-7506); and one commercial variety: genotype 3 (CA -UGCE 093). The traits of local genotypes were not known at the time of collection, while some for the AVRDC genotypes are shown (Table 1). Seedling propagation and maintenance. In order to inactivate seed-borne tobamoviruses (TMV, ToMV, and PMMV) pepper seeds were soaked in a 10% (w/v) solution of trisodium phosphate (TSP), for 30 minutes and transferred to a fresh solution of the same reagent for a further two hours before rinsing in running water for 45 minutes. Seeds were then soaked in water for 24 using plastic buckets with sterilised soil in the hours in order to facilitate germination (Rashid et ratio 3:1:1 (soil: sand: decomposed dried cow al., 2007). During 2009A, seedlings were raised dung) to generate growth media. A protective under field conditions on soilbeds that had been insecticide, IMAXI (Imidacloprid 200 g l-1 active surface-sterilised by burning a layer of dry grass ingredient (a.i), at the rate 20 mls 15 L-1) and the for one hour to kill soil-borne pathogens. Due to broad spectrum fungicide Ridomil (Metalaxyl-M low germination percentages in 2009A, 40 g kg-1 + Mancozeb 640 g kg-1 a.i.; at a rate of 60 screenhouse propagation was applied in 2009B g 15 L-1) were applied 3 times a week before transplanting to prevent vector transmission of viruses and manage fungal pathogens. In addition, an organic fertiliser vegimax (trace minerals, vitamins and amino acids produced from plant products, at the rate 35 mls 15 L-1) was applied twice a week for two weeks at two-leaf stage. The nursery was watered thoroughly pre and post-seed germination as recommended (Berke et al., 2005; Berke and Gniffke, 2006) to facilitate health seedling establishment. After four days of hardening off, seedlings were transplanted in fields at 6-8 weeks after planting. Establishment and management of field trials. In 2009A, 25 genotypes were evaluated during the dry season from June 22nd 2009 and terminated during rainy season on November 26th, 2009. The second season experiment involved 35 genotypes that were sown on October 19th, 2009 and evaluated during the rainy season of 2009 B from December 1st, 2009 up to May 11th, 2010. In both seasons, an alpha lattice design was used with 2 replications. In 2009A, a 5x5 (5 incomplete blocks each containing 5 experimental plots with a total of 25 experimental plots) alpha lattice design was used; while in 2009B, the alpha lattice design was a 7 x 5 (7 incomplete blocks each containing 5 experimental plots totaling 35 experimental plots). In both designs, each plot was a single row raised bed 1 m wide and 5 m long with a population of 14 plants. The spacing between plants within rows was 45 cm and between rows was 60 cm. The distance between plots was 1.5 m and between replications 2 m. To counteract border effects, guard rows of beans were planted around the trial. The plants were fertilised with a complete fertiliser NPK (20:10:10) at the rate of 400 kg ha-1 in two splits with equal proportions: 200 kg ha-1 two weeks after transplanting and another 200 kg ha-1 three weeks after the first application. Urea was also applied at the rate of 100 kg N ha-1 in three splits with the first application (30 kg N ha-1) two weeks after transplanting, second application (30 kg N ha-1) three weeks after the first application and the third application (40 kg N ha-1) three weeks after the second application. Seedlings were protected for about 2 months as described above in seedling maintenance in order to allow proper plant establishment in the field. Thereafter, plants were allowed to grow in natural unprotected conditions. Weeding was done as often as necessary to avoid competition for nutrients with plants. Watering was done twice a day for 2 weeks after transplanting and thereafter thrice a week during dry conditions until seedlings were fully established. Data collection Growth traits. Plant growth traits assessed included days to 50% flowering, days to 50% fruit maturity, plant height and width at maturity. The days to 50% flowering and days to 50% fruit maturity were determined by recording the days from transplanting until 50% of plants in a plot have at least one open flower and 50% of plants in a plot bear mature fruits at the first and second bifurcation, respectively; while plant height and width at maturity were measured using a wooden ruler calibrated up to 100 cm, respectively. Quality traits. Quality traits evaluated were fruit size measured by: average mature fruit length, width and weight for 20 mature fruits per plot from the second harvest; non-marketable fruits computed as a percentage of total number of fruits harvested per genotype for the whole experiment and seed weight measured by weighing 200 seeds per genotype. Yield traits. Yield traits evaluated were: fruit number per plant; total fruit yield (t ha-1) computed from fruit weight and total fruits harvested; marketable fruit yield computed from fruit weight and number of marketable fruits; fruit seed yield averaged from 20 marketable fruits and seed yield computed from fruit seed yield and fruit weight. Mature fruits were harvested 6 times over a period of 8 weeks after maturity and marketability of fresh harvest (pest and disease free) determined. Data analyses. All data were analysed using GenStat computer package (12th Edition, Version 2; VSN International Ltd, 2010). For all traits, the ANOVA for the alpha-lattice design done using the Linear Mixed Model selection in the Restricted Maximum Likelihood (ReML) procedure resulted in ineffective lattice blocks shown by negative variance components and hence, analysis was done using randomised complete block design (Gomez and Gomez, 1984). Data on the 25 genotypes common to both seasons were then pooled across seasons to determine the interaction effects between seasons and treatments (genotypes), there the ANOVA list indicated significant differences, treatment means were separated using Fischers’ Protected Least Significant Differences (LSD) test at 5% probability level (Gomez and Gomez, 1984). RESULTS Days to 50% flowering. Days to 50% flowering was highly significant among genotypes (P<0.001) (Table 2). Local genotypes flowered later than exotic genotypes. Among the local cultivars, genotypes 5, 10 and 11 flowered later than the rest at 73, 82 and 83 days after transplanting (DAT), respectively; while genotype 2 flowered much earlier, followed by genotype 6 at 39 DAT. Among the exotic genotypes, there were no clear cut differences in days to 50% flowering. However, genotypes 24, 18, 29, 20, 22, 23, and 25 flowered earlier, while genotypes 28, 34, 31 and 27 were the latest flowering. Days to 50% fruit maturity. There were highly significant differences among genotypes for days to 50% fruit maturity (Table 2). Pooled analysis of variance for the 25 genotypes common to both seasons varied significantly with season (E) (P<0.001), genotype (G) (P<0.01) and genotype X season (GxE) interaction. Generally, genotypes in season 2009A matured earlier than genotypes in 2009B. However, local genotypes matured later in season 2009A than exotic genotypes. The earliest maturing local genotypes were 2, 8 and 6 while; the earliest maturing exotic genotypes were 11 and 25 at 68 and 69 DAT, respectively. Similarly, in 2009B, exotic genotypes matured significantly earlier than local genotypes. The earliest maturing local genotypes were 2 and 8; while, the earliest maturing exotic genotypes were 18, 19, 25, 23 and 29. The latest maturing local genotypes were 10, 5 and 9 at 112, 116 and 117 DAT, respectively while, the latest maturing exotic genotypes were 28 and 27. Of the local genotypes, 2 and 8 consistently matured earlier, whereas genotypes 9 and 10 consistently matured later across the two seasons. Among the introduced genotypes, the AVRDC genotype 25, 23, and 17 consistently matured earlier while, genotypes 13, 1 and 15 systematically matured later across seasons. Plant height. Plant height differed highly among genotypes (P<0.001) (Table 2). Pooled analysis of variance for the 25 genotypes common to both seasons was highly significant (P<0.001) with genotype X season (GxE) interaction, but did not vary with genotype. In general, genotypes were shorter in season 2009A than in 2009B. However, local genotypes still grew taller than exotic genotypes in 2009A. The shortest local genotypes were 2 and 7 tall while, the tallest genotypes were 3, 5 and 4. The shortest exotic genotypes were 15 and 25 whilst, the tallest were 21, 18 and 12. Similarly, in 2009B, local genotypes grew taller compared with exotic genotypes. The shortest local genotype was 8 followed by 4; whereas, the tallest genotypes were 10, 5 and 2. The shortest exotic genotypes were 19, 27 and 16 whereas, the tallest were 1 and 31. Among the local genotypes, 8 and 6 consistently grew shorter; while, genotypes 3, 10 and 5 consistently grew taller across the two seasons. Of the introduced genotypes, 19, 16 and 17 consistently grew shorter while, genotypes 11, 21 and 12 consistently grew taller across the two seasons. Plant width. Plant width differed highly among genotypes (P<0.001) (Table 2). Pooled analysis of variance for the 25 genotypes common to both seasons revealed significant differences (P<0.001) among genotype, season and with genotype X season (GxE) interaction. In general, genotypes in season 2009A had narrower plant canopy compared with, genotypes in 2009B. On the other hand, local genotypes in 2009A had wider plant canopies compared with exotic genotypes. Local genotypes 2 and 9 had the narrowest plant canopies; while genotypes with the widest canopies were 4 and 6. Exotic genotypes with narrowest canopies were 20 and 15 while; genotypes 21 and 12 had the widest canopies. Similarly, in 2009B, local genotypes exhibited wider plant canopies compared with exotic genotypes. The narrowest local genotype was 2 while, the widest genotypes were 3, 7 and 6. The narrowest exotic genotypes were 34 and 20; while, the significantly widest genotype was the Chinese genotype 1 (61.7 cm). Among the local genotypes, 2 consistently had narrower plant canopies while, genotypes 3 and 6 consistently exhibited wider plant canopies. Of the introduced genotypes, 19 and 16 consistently exhibited small plant width, while genotype 12 consistently grew wider canopies than all genotypes. Fruit length. There were significant differences in fruit length among genotype, season and genotype X season (GxE) interaction. Overall, mean of fruit lengths in season 2009A were shorter than those of genotypes grown in 2009B. Fruit lengths of local genotypes in 2009A were shorter compared with those of exotic genotypes. The local genotypes with the shortest fruits were 9, 6 and 10 while, genotypes with longest fruits were 2 (6.7 cm) and 8 (8.8 cm). Exotic genotypes with shortest fruits were 23 and 24; while those with the longest fruits were 21 and 1 (Table 3). Likewise, fruit lengths of local genotypes in 2009B were shorter than those of exotic genotypes (mean 11.1cm). The local genotypes with the shortest fruits were 10 and 9. Genotypes with longest fruits were 7 and 2 (Table 3). Exotic genotypes with shortest fruits were 28 and 13; while those with the longest fruits were 30 and 1. Within the local genotypes, 9, 6 and 10 consistently displayed shorter fruits; while genotypes 2 and 3 consistently showed longer fruits. Among the exotic genotypes, 24, 13 and 25 consistently exhibited shorter fruits whereas; genotypes 21 and 1 consistently had longer fruits (Table 3). Fruit width. Fruit width was significantly different among genotypes (P<0.001) (Table 3). Pooled analysis of variance for the 25 genotypes common to both seasons varied significantly (P<0.001) with genotype, season and genotype X season (GxE) interaction. Fruits in 2009A had narrower fruits compared with those in 2009B. Fruit widths of both local and exotic genotypes in 2009A were equally wide. The local genotypes with the narrowest fruits were 2, 3, 6 and 8 while; genotypes with broadest fruits were 10 and 9. Exotic genotypes with the narrowest fruits were 12 and 16; while genotypes with widest fruits were 1followed by 22 (Table 3). Conversely, fruits of local genotypes were narrower than those of exotic genotypes in 2009B. The local genotype with the narrowest fruits was 8 while, local genotypes with widest fruits were 4, 5, 10 and 9 with the first 3 having 1.6 cm and the last with 1.8 cm. Most exotic genotypes had intermediate fruit width in the range 1.0 - 1.8 cm with the exception of genotype 1, whose fruits were 2.6 cm wide (Table 3). Among the local genotypes, 2 and 3 consistently displayed thinner fruits, while genotypes 10 and 9 consistently showed wider fruits. Among the exotic genotypes, 13 and 20 consistently exhibited narrower fruits whereas; genotype 1 consistently exhibited wider fruits than all genotypes. Average fruit weight. There was a highly significant difference in average fruit weight among genotypes (Table 3). Combined analysis of variance for the 25 genotypes common to both seasons varied significantly (P<0.001) with genotype, season and genotype X season (GxE) interaction. Overall, fruits from season 2009B were heavier than those from 2009A. Average fruit weight of local genotypes in 2009A were lighter compared with those of exotic genotypes. The local genotypes with the lightest fruits were 6 and 3; while the heaviest fruits were 8 and 4. Exotic genotypes with lightest fruits were 12, 24 and 23 while, those with the heaviest fruits were 22 and 1. Similarly, fruits of local genotypes in 2009B were lighter than those of exotic genotypes (Table 3). The local genotypes with the lightest fruits were 6 and 3; while the heaviest fruits were from genotypes 7 and 4. Exotic genotype with lightest fruits was 28, while those with the heaviest fruits were 1 and 30. Among the local genotypes, 6 and 3 consistently displayed lighter fruits, while genotypes 8 and 4 consistently showed heavier fruits across the two seasons. Among the exotic genotypes, 12 and 13 consistently exhibited lighter fruits whereas; genotype 1 consistently had heavier fruits. Non-marketable fruits. There were highly significant differences in non-marketable fruits among genotypes (P<0.001) (Table 3). Combined analysis of variance for the 25 genotypes common to both seasons varied significantly (P<0.001) with season and genotype X season (GxE) interaction; but was not significant with genotype. More fruits were scored nonmarketable in 2009B compared with those in 2009A. Local genotypes in 2009A had more nonmarketable fruits than with exotic genotypes. Local genotype with lowest percentage of nonmarketable fruits was 2; while those with higher percentage of non-marketable fruits were 9 and 10. Exotic genotypes with low percentage of nonmarketable fruits were 22, 15, 21 and 1; while genotype 18 had significantly higher percentage of non-marketable fruits. In contrast, local genotypes in 2009B had fewer non-marketable fruits compared with exotic genotypes. The local genotype with lowest percentage of non-marketable fruits was 3, while genotypes with higher percentage of nonmarketable fruits were 7 and 8. Exotic genotype with the lowest percentage of non-marketable fruits was 28, while genotypes with significantly higher percentage of non-marketable fruits were 11, 17 and 34. Genotypes 2 and 3 within the local genotypes consistently had lower percentages of non-marketable fruits while genotypes 5 and 8 consistently exhibited higher percentage of nonmarketable fruits. Among the exotic genotypes, only 28 had a lower percentage of non-marketable fruits; while genotype 19, 25 and 18 consistently had a higher percentage of non-marketable fruits across the two seasons. 200 Seed weight. There were highly significant differences in seed weight among genotypes (P<0.001) (Table 3). Genotypes common to both seasons indicated that seed weight differed highly significantly with genotype (P<0.01), season (P<0.001) and genotype X season (GxE) interaction (P<0.001). On the whole, seeds from season 2009A were heavier than those from 2009B. Seed weight of local genotypes were heavier in 2009A than those of exotic genotypes. The local genotypes with the lightest seeds were 6, 8, 9 and 10; while the heaviest seeded genotypes 2, 4, 5, 7 and 3 had seeds ranging from 1.0 to 1.1 g. Twelve exotic genotypes had lighter seeds; while 4 genotypes produced heavier seeds with genotype 21 being the heaviest seed yielder. Conversely, seeds of local genotypes in 2009B were lighter compared with those of exotic genotypes. Local genotypes 2 and 3 yielded the heaviest seeds whereas, the local genotype with the lightest seeds was 6. Exotic genotype 21 was the heaviest seed yielder (1.0 g); while, the lightest seed yielder genotypes had 0.6 g. Local genotypes 7 and 3 and exotic genotypes 1 and 21 were consistent with producing heavy seeds. Yield traits Number of fruits per plant. Number of fruits per plant was significantly different among genotypes (P<0.001) (Table 4). Genotypes in 2009A had more fruits per plant than those in 2009B. Local genotypes in 2009A produced more fruits per plant than the exotic genotypes. Local genotypes with the fewest fruits per plant were 7 and 2; while genotypes with most fruits per plant were 4 and 6. Exotic genotypes with fewer fruits per plant were 1, 22 and 25 while, genotype 12 significantly displayed more fruits per plant than the rest. On the contrary, local genotypes in 2009B had fewer fruits per plant compared with exotic genotypes. Local genotypes with fewer fruits per plant were 8, 2, 4, and 7 while genotypes with more fruits per plant were 5, 6 and 3. Exotic genotypes with fewer fruits per plant were 1 and 11; while genotype 12 significantly displayed more fruits per plant than the rest; followed by genotype 14. Of the local genotypes, 2 and 7 consistently displayed fewer fruits per plant; while genotypes 6, 5 and 3 consistently showed more fruits per plant across the two seasons. Among the exotic genotypes, 1 and 17 consistently exhibited fewer fruits per plant, while the AVRDC control genotype 12 consistently exhibited significantly more fruits per plant than all genotypes. Total fruit yield. There were significant (P<0.001) differences among genotypes with regard to total fruit yield in both seasons 2009A and 2009B (Table 4). Higher fruit yields were recorded in 2009B compared with those in 2009A. Local genotypes in 2009A had lower fruit yield compared with exotic genotypes. Local genotypes with lower fruit yields were 6, 2 and 7; while genotypes with higher yields were 8 and 4. Exotic genotype with significantly lowest total fruit yield was 25; while genotypes 11 and 18 had higher fruit yields. Similarly, local genotypes in 2009B had lower fruit yield compared with exotic genotypes. Local genotypes with low fruit yield were 8, 2, 6, 10 and 7; while genotypes with higher fruit yield were 9 and 3. Exotic genotype with significantly low fruit yield was 28; while genotypes 29 and 30 had higher fruit yield. Among the local genotypes, 2 and 6 consistently had lower total fruit yield while genotypes 5 and 3 consistently exhibited higher total fruit yield across the two seasons. Of all the exotic genotypes, only 19 and 13 had consistent lower total fruit yields while genotype 1 and 14 consistently produced higher total fruit yields (t ha-1) across the two seasons. Total marketable fruit yield. There was a highly significant difference in total marketable fruit yield among genotypes (Table 4). Higher marketable fruit yields were recorded in 2009A compared with 2009B. Local genotypes in 2009A had lower marketable fruit yield compared with exotic genotypes. Local genotype with the lowest marketable fruit yield was 2; while genotypes with the highest marketable fruit yield was 4 . Exotic genotypes with low marketable fruit yield were 15, 20, 22, 25 and 16 while genotype18 had significantly the highest marketable fruit yield. Local genotypes had lower marketable fruit yield in 2009B compared with exotic genotypes. Local genotypes with low fruit marketable fruit yield were 8, 2, 7, 10 and 6; while genotypes with higher yields were 9 and 3. Exotic genotypes with significantly lower marketable fruit yield were 34, 11, 17 and 18; while genotype 14 had the highest marketable fruit yield. Among the local genotypes, 2, 7 and 6 consistently had lower total marketable fruit yield while genotype 9 consistently exhibited higher total marketable fruit yield across the two seasons. Within the exotic genotypes, it is 20, 22 and 25 that always had lower total marketable fruit yield while genotype 14 consistently produced a higher total marketable fruit yield across the two seasons. Seeds per fruit. Number of seeds per fruit was not significantly different among genotypes in season 2009A save for season 2009B which exhibited significant differences among genotypes (P<0.001) (Table 4). Genotypes in 2009A and 2009B generally produced almost the same number of seeds per fruit (Tables 4). Though no significant differences were observed among genotypes in 2009A, local genotypes on average had more seeds per fruit compared with exotic genotypes. The highest seed yielding fruits in 2009A were from exotic genotypes 17 and 1. Fruit seed yield from local genotypes ranged from 7295 seeds per fruit. Fruit seed yield. Total seed yield was significantly different among genotypes (Table 4). More seed yield was recorded in 2009A compared with those in 2009B. Local genotypes in 2009A had significantly higher seed yield compared with exotic genotypes. Local genotype 3 and exotic genotype 12 out yielded all the others. In season 2009B, exotic genotypes had more seed yield than the local genotypes. Among local genotypes, 5 and 4 registered the highest seed yield; while, genotypes 24, 26, 30 and 1 were the highest exotic seed yielders. The Chinese genotype 1 was a consistent exotic high seed yielder. Growth, quality and yield trait stability analysis. Genotype stability in this study was tested by rank correlation analysis performed on all traits studied across the two seasons. Traits with high positive correlation across seasons were considered stable (Table 5). The correlations between 2009A and 2009B values were highly significant for average fruit weight (r=0.65; P<0.001), fruit length (r=0.74; P<0.001), fruit width (r=0.71; P<0.001), 200 seed weight (r=0.51; P=0.0089), 50% days to fruit maturity (r=0.55; P<0.0045), plant width (r=0.50; P=0.01) and significant for number of seeds per fruit (r=0.43; P=0.03) . DISCUSSION The differential seasonal variations in performance of majority traits suggest the need to identify suitable cropping seasons for better performance of most traits except number of seeds per fruit that can perform well across seasons. This may have resulted from variations in weather variables in different seasons including, rainfall, evaporation, sunshine duration, temperature and relative humidity which affect the growth and yield of hot pepper (Omonijo and Afuye, 2009). Results also showed that exotic genotypes performed better in most traits than local genotypes. Exotic genotypes flowered and matured earlier than local genotypes. They also yielded longer and heavier fruits, higher total and marketable fruit yields than local genotypes in both seasons. However, local genotypes grew taller with wider canopies and had more number of seeds per fruit than exotic genotypes. The better performance of exotic over local genotypes in flowering and maturity periods, fruit sizes and yield could be explained by the fact that, since they are improved cultivars; they were most probably improved for these important traits for both market and farmer preferences. Nevertheless, local genotypes can be good sources of genes for tallness and wide canopies, which are associated with many fruits per plant due to high number of primary, secondary and tertiary branch numbers where fruits are formed (Seleshi, 2011). Tall plants also have long main stems which can help improve short genotypes whose fruits are exposed to the soil there by acquiring fruit rots from fungal and bacterial soil pathogens (Rodríguez et al., 2008). The higher number of seeds per fruit of local genotypes than exotic genotypes could be exploited for improved seed yield to especially benefit the seed business industry. On the contrary, both local and exotic genotypes did not show consistent performance in both seasons for some traits including, non-marketable fruits, 200 seed weight, fruit seed yield and number of fruits per plant, i.e., in one season local genotypes performed better and worse in the other and viceversa with exotic genotypes. Fruit widths of both local and exotic genotypes in 2009A were equally wide; while in 2009B, local genotypes were narrower compared with those of exotic genotypes. All these contradictory observations were probably due to the effect of GxE interaction. Earliness among growth traits is an important trait in hot pepper because early maturing genotypes can be grown in short rainy seasons and easily create land for other crops especially in an intensive and multiple cropping systems characteristic of Ugandan situation. This study revealed significant differences among genotypes for traits that define earliness (days to 50% flowering and fruit maturity). Number of days to 50% flowering ranged from 24 days (EASCo genotype 2) to 83 days (local genotype 9); while days to 50% fruit maturity in both seasons ranged from 54 days (EASCo local genotype 2 in season 2009A to 119 days (local genotype 9 in 2009B). Results on days to 50% flowering are consistent with earlier reports based on studies conducted in Taiwan with an average ranging between 63-81 days (AVRDC, 2004) but are nevertheless inconsistent for days to 50% fruit maturity which ranged from 111-132 days (AVRDC, 2004). This variation can be largely attributed to their inherent genetic constitution for these traits. However, the effects of environmental differences and cultural practices may have caused genotypes in 2009A to mature earlier (mean 77.0 DAT), than genotypes in 2009B (mean 84.7 DAT). Plant height and width are other important growth traits in hot pepper. The observed highly significant differences for these plant growth habits indicate potential for their improvement. Plant height varied from 16.6 cm (AVRDC genotype 20 in 2009A) to 57.6 cm (control commercial local genotype 3 in 2009B); while plant width varied from 10.8 cm (AVRDC genotype 15 in 2009A) to 61.7 cm (Chinese genotype 1 in 2009B). These results are inconsistent with findings of other researchers on C. annuum (AVRDC, 2004) who found plant height ranging from 87-146 cm, 60.42-101.25 cm and 57.3-125.8 cm, respectively. This may be due to differences in cultivars used in the study, environmental conditions and management practices. Much as the variation in this study may have been due to genotypic differences, cultural practices at transplanting may have contributed to the observed shorter plants with narrower canopy in 2009A than in 2009B. Transplanting seedlings at flowering in 2009A could have caused instability to the rooting system and or damaged the mature roots and hence creating a need for more energy and time for repair. This stress to the plants might have delayed shoot re-growth and hence plants reached maturity at shorter height and narrower canopy. This difference could also have been due to moisture stress from low rainfall received in 2009A that might have affected the plant vigor. Quality traits are important for both the farmer and the market. In addition to being an important attribute for the market (AVRDC, 1989; Mr. James Kanyije, 2010; Director of ICEMARK, a major Horticultural Export Company in Uganda, personal communication), fruit size measured by fruit length, width and weight contribute to Capsicum sp. fruit yields (Rodríguez et al., 2008; Bozokalfa and Kilic, 2010). Bigger fruits are also easy to harvest, transport and process (Akinci and Akinci, 2004). Marketable fruits are most desirable since increased marketable fruit means much more economic gain for a farmer involved in Capsicum sp. production. A number of factors were observed to cause non marketability of fruits including physiological (blossom end rot and fruit cracking) and biotic factors such as disease (bacterial soft rot, anthracnose, and bacterial spot) and insect damage (entry of larvae that lead to secondary infection by pathogens). Blossom end rot and fruit cracking were also observed to cause nonmarketable fruits in bell pepper field evaluation trials (Fouché and Boelk, 2006). Blossom end rot results from calcium imbalance due to intermittent uptake of water (Black et al., 1991; Terry and Boyhan, 2006); while vegetable fruit cracking is associated with water uptake, humidity, temperature, soluble solids (sugars), calcium nutrition and standing water on the fruits as well as the genetics of the plants (Peet and Willits, 1991; UMass Extension, 2009). Fruit length ranged from 2.2 cm (local genotype 10 in 2009B) to 16.2 cm (Chinese genotype 1 in 2009B). This range corroborates with results of other researchers who found for fruit length elsewhere ranging from 5.77-12.90 cm (AVRDC, 2004), 7.62-11.17 cm (AVRDC-RCA, 2003), 6.2-15 cm, 4.7-15.6 cm (Akinci and Akinci, 2004), 5.8-11.94 cm (Sermenli and Mavi, 2010) and 8.3-11.1 cm (Idowu-Agida et al., 2010). Fruit width ranged from 0.8 cm (EASCo local genotype 2 in 2009A) to 2.6 cm (Chinese genotype 1 in 2009B). These are in line with those found by other researchers in the range 0.98-2.03 cm (AVRDC, 2004), 0.75-1.42 cm (AVRDC-RCA, 2003) and 1.73-2.88 cm (Sermenli and Mavi, 2010). They, however, partly conflict with the findings of Akinci and Akinci (2004) who found fruit width of C. annum ranging from 0.9-4.1 and 1.5-3.8 cm, respectively and the range 3.9-6.3 cm reported by Idowu-Agida et al. (2010). Results of average fruit weight varied from 1.1 g (local genotype 6 in 2009B) to 16.4 g (Chinese genotype 1 in 2009A). These agree with other findings earlier reported from other places; 5.0.-15.1 g (Akanci and Akinci, 2004), 4.27-13.20 g (AVRDC, 2004), 3.00-12.33 (AVRDC-RCA, 2003). Non-marketable fruits ranged from 28% (AVRDC genotype 22 in 2009A) to 95% (AVRDC genotype 34 in 2009B); while 200-seed weight varied from 0.5 g (local genotype 6 in 2009B) to 1.2 g (AVRDC genotype 21 in 2009A). Results on seed weight are at variance with those of Akinci and Akinci (2004), who found 100-seed weight among genotypes varying from 5.3 to 21.9 g. The fewer non-marketable fruits and heavier seeds in 2009A compared to 2009B might have resulted from favourable environmental conditions that prevailed in 2009A. Much rain observed in 2009B compared to 2009A could have played role in higher percentage of nonmarketable fruits. High humidity provided favorable environment for growth of fungal and bacterial pathogens that resulted into fruit rots causing more fruits non-marketable (Agrios, 2005). On the contrary, the dry weather condition observed in 2009A could have resulted in smaller fruit sizes in 2009A compared to 2009B. This is supported by summer season studies conducted in Taiwan that resulted into summer chilli fruits being shorter, narrower and lighter than those produced in the spring season (AVRDC, 2004). This discrepancy may have also resulted from additional genotypes from AVRDC with improved fruit sizes evaluated in 2009B. Fruit and seed yield traits are very important for the farmer and seed industry. Highly significant genotypic differences were observed in all yield traits in both seasons except number of seeds per fruit in 2009A. Number of fruits per plant ranged from 12 fruits (local genotype 8 in 2009B, Chinese genotype 1 in 2009A) to 91 fruits (AVRDC control genotype 12 in 2009A), total fruit yield from 1.0 t ha-1 (local genotype 8 in 2009B) to 17.9 t ha-1 (AVRDC genotypes 29 and 30 2009B), total marketable fruit yield from 0.3 t ha-1 (local genotype 8 in 2009B) to 7.6 t ha-1 (AVRDC genotype 18 in 2009A), number of seeds per fruit from 46 seeds (EASCo local genotype 2 in 2009B) to 127 seeds (Chinese genotype 1 in 2009B) and fruit seed yield from 0.1 t ha-1 (AVRDC genotype 15 in 2009A, EASCo local genotype 2 and Chinese genotype 1 in 2009B) to 1.4 t ha-1 (AVRDC control genotype 12 in 2009A). The observed total fruit and marketable fruit yields are lower than what has been obtained from other production environments. Marketable fruit yield in Taiwan ranged from 5.36-33.86 t ha-1 while total fruit yield ranged from 5.64-35.25 t ha-1 (AVRDC, 2004). In Tanzania, total fruit yields ranged from 10.06-38.46 t ha-1 (AVRDC-RCA, 2003) and 8.5-27.2 t ha-1 in Jordan. Results on number of fruits per plant are consistent with the findings of Akinci and Akinci (2004) and Sermenli and Mavi (2010) who found a range of 30-79, 13.1-66.4 and 21.33-76.33 fruits, respectively; but are inconsistent with the range of fruits per plant (146-396) found by researchers in Arusha, Tanzania (AVRDC-RCA, 2003). Similarly, number of seeds per fruit were consistent with the previous finding of Akinci and Akinci (2004) who recorded a range of 25-112 seeds per fruit. The lower fruit numbers obtained in 2009B than 2009A may have been due to loss of fruits to dampness and decay because of much rainfall received in 2009B (Idowu-Agida et al., 2010). This is also attributed to abscission of flower buds, flowers and young fruits induced by higher temperatures and excessive moisture from much rains during flowering and fruiting stages in 2009B (AVRDC, 1989). In 2009B, plants received much rains (330.4 mm) and high temperatures (23.3 °C) during flowering and fruiting between January-March, 2010 compared to 193.1 mm rainfall and 22.4 °C received at flowering and fruiting in 2009A between June-August. Such conditions are the most important factors that limit chilli pepper production by inducing abscission of flower buds, flowers and young fruits (AVRDC, 1989). However, more of this variation may be contributed by the rainfall factor since temperatures in both seasons were in the recommended range of 15-35 °C (AVRDC, 1989). The higher total seed yield in 2009A than that for 2009B was probably due to the heavier seeds and more number of fruits produced in season 2009 A (0.9 g) than those from 2009B (0.75 g). Nowaczyk and Nowaczyk (1999) noted that the yield of hybrid seeds depends on the number of fruit as well as the weight of seeds included in them. Whereas season 2009A had more average fruits per plant than season 2009B, season 2009B exhibited higher total and marketable fruit yields compared to season 2009A. This could be as a result of bigger fruits: fruit length, fruit width, average fruit weight produced in season 2009B than in season 2009A. Pooled analysis of variance for genotypes common to both seasons indicated seasonal (environmental) variation for all evaluated traits, with the exception of number of fruit per plant and number of seeds per fruit. Variations due to genotypes X environmental interaction were also observed in all traits except number of seeds per fruit indicating that genotypic performance was not consistent due to seasonal changes. The differential response of genotypes for various growth quality and yield traits when grown under different seasons has also been observed (AVRDC, 2004; Idowu-Agida et al., 2010). Similarly, variations due to genotypes were significant for most traits, but not significant for plant height, total fruit yield, total marketable fruit yield and non-marketable fruits indicating that all genotypes performed the same for these traits in both seasons. Hence, for all traits other than plant height, total fruit yield, non-marketable fruits, total and marketable fruit yields, seasonal specific genotypes need to be selected. These results also indicate that for all traits among 25 genotypes pooled together across seasons, only number of fruits per plant and number of seeds per fruits can consistently perform well across seasons. Variation due to genotype X environmental interaction in most traits except number of seeds per fruit indicted that genotypes varied significantly with seasons in performance for most traits other than number of seeds per fruit. Identification of stable traits among genotypes was done by correlating traits of genotypes common to both seasons (Balkaya and Karraaðaç, 2009). However, stability analysis indicated that average fruit weight, fruit length, fruit width, seed weight, 50% days to fruit maturity, plant width and number of seeds per fruit were the most stable traits. The implication of this is that traits that vary with the environment may be improved by using suitable cropping seasons and management practices. CONCLUSION The introduced pepper genotypes out-performs local genotypes in flowering and maturity periods, bigger fruits, total and marketable fruit yields. Local genotypes are, however, better in number of seeds produced per fruit, plant height and width. Genotypes are most stable for average fruit weight, fruit length, fruit width, seed weight, 50% days to fruit maturity, plant width and number of seeds. Exotic genotypes 12, 13, 19, 25, 24, 1, 17, 23, 16, 20, 15, 21 and 14 produce high yields across seasons with the AVRDC check genotype 12 performing better than all exotic genotypes in all traits. The commercial local check genotype 3 perform better than all the local genotypes and most of the AVRDC genotypes in terms of fruit yield and maturity periods, and perhaps this is why it is popular as a commercial variety among farmers. The East African Seed Company local genotype 2, though the poorest yielder is the earliest-maturing variety among all genotypes. Its genes can be used for early yield improvement in pepper. ACKNOWLEDGEMENT This study was funded by the Alliance for a Green Revolution in Africa (AGRA) through Regional Universities Forum for Capacity Building in Agriculture (RUFORUM). The 25 exotic genotypes were provided by AVRDC-The World Vegetable Center, Taiwan for which we are greatly indebted. REFERENCES
Copyright © 2012 - African Crop Science Society The following images related to this document are available:Photo images[cs12020t2.jpg] [cs12020t5.jpg] [cs12020t3.jpg] [cs12020t1.jpg] [cs12020t4.jpg] |
| |||||||||
