 |
| About Bioline | All Journals | Testimonials | Membership | News |
|
||||||
|
||||||
African Crop Science Journal, Vol. 20, Supp. 1, 2012, pp. 141-153 Diffusion and adoption of new rice varieties for Africa (Nerica) in the Gambia L. Dibba, A. Diagne1, S.C. Fialor2 and F. Nimoh2 National Agricultural Research Institute (NARI) PMB 526 Serrekunda, The Gambia, West Africa
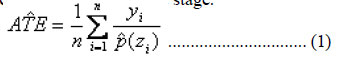
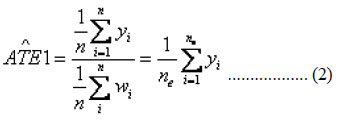
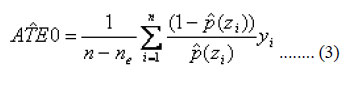
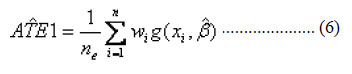
Code Number: cs12021 ABSTRACT Rice (Oryza sativa) is one of the most important cereal crops cultivated in sub-Saharan Africa (SSA). It is ranked as the fourth most important crop in terms of production after sorghum (Sorghum bicolor), maize (Zea mays) and millet (Eleusine coracana). The objective of this study was to establish adoption rates, and their determinants, of the New Rice Varieties for Africa (NERICA) in the Gambia. We used data from a stratified sample of 600 rice farmers and applied the Average Treatment Estimation (ATE) framework to establish rate of adoption and associated factors. The results revealed that NERICA adoption rate was barely 40% falling far below the expected 83%. The shortfall was due to the incomplete stakeholder exposure to NERICA in the period before 2006. The introduction of NERICA to villages was found to be a significant determinant of both exposure and adoption of NERICA varieties. Key Words: Average Treatment Estimate, New Rice Varieties for Africa RÉSUMÉ Le riz (Oryza sativa) est l’une des céréals les plus cultivées en Afrique Sub-Saharienne. Il est la quatrième culture la plus importante en terme de production après le sorgho (Sorghum bicolor), le maïs (Zea mays) et le millet (Eleusine coracana). L’objectif de cette étude était de établir les taux d’adoption et déterminants de nouvelles variétés pour l’Afrique (NERICA) en Gambie. Nous avons utilisé des données issues d’un échantillon stratifié de 600 riziculteurs, et le modèle d’Estimation de la Moyenne de Traitements (ATE) était appliqué pour établir le taux d’adoption et les facteurs associés. Les résultats ont révélé que le taux d’adotpion du NERICA était d’environ 40% ce qui est en contraste avec le taux espéré de 83%. Cette baisse était due à une imparfaite présentation du NERICA aux partenaires avant l’année 2006. L’introduction du NERICA aux villages était un déterminant significatif de la présentation et l’adoption des variétés NERICA. Mots Cles: Estimation de la Moyenne de traitements, Nouvelles Variétés de Riz pour l’Afrique INTRODUCTION Rice (Oryza sativa) is one of the most important cereal crops cultivated in sub-Saharan Africa (SSA). It is ranked as the fourth most important crop in terms of production after sorghum (Sorghum bicolor), maize (Zea mays) and millet (Eleusine coracana) (FAOSAT, 2006). Rice occupies 10% of the total land under cereal production and produces 15% of the total cereal production (FAOSTAT, 2006). Approximately 20 million farmers in SSA grow rice and about 100 million people depend on it for their livelihoods (Nwanze et al., 2006). Between 1961 and 2003, the annual consumption of rice increased annually by 4.4% and among the major cereals cultivated, rice is the most rapidly growing food source in SSA (Kormawa et al., 2004). Despite the apparent importance of rice in SSA, the production level is still far below the consumer demand. As a result, rice imports keep growing at an alarming rate. In 2006, SSA accounted for 32% of the global rice imports with a record level of 9 million tonnes (WARDA/FAO/SAA, 2008). In some sub-Saharan African countries like The Gambia, rice is the most important staple food crop and source of calories in terms of consumption. Its production is one of the main agricultural activities and an important source of income for a large number of women farmers in the country. The per capita consumption of rice in The Gambia has been estimated to be 110kg per person per annum, which is one of the highest in Africa (WARDA, 1996). Of the 106,000 tonnes of rice consumed per annum in the country only 20,000 tonnes is produced locally. The huge deficit is met through importation from Asia. In 2000 alone, US$ 10.9 million was spent on the importation of 93,900 metric tons of rice (The Gambia Central Statistic Department, 2001). Currently 75% of the total population of approximately 1.5 million depends on agriculture for their livelihood (World Bank, 2005). Of the faming population, only 40% are male. Women are the predominant farmers in The Gambia; in fact 67% of the female population is engaged in agricultural production (1993 census). Traditionally, women carry out rice-growing activities during the wet season using hand cultivation, which still remains the predominant system of production. The Gambia and most sub-Saharan African nations import a large proportion of food grain and other food commodities. For this reason, governments have to use scarce foreign exchange and households must generate enough wealth to be able to purchase their required food. Although the government of The Gambia has been committed to a policy of attaining rice selfsufficiency, while diversifying the incomes of the rural poor, as well as increasing agricultural production and conserving the natural resource base of the overall environment on a sustainable basis, little progress has been achieved. Rice farm production has been on the declined. Between 1994 and 2003, rice productivity declined from 1.48 tonnes per hectare to 1.14 tonnes per hectare (Bittage et al., 2002; Government of The Gambia: Farmer Managed Rice Irrigation Project, 2005). This decline in productivity level is a major bottleneck. Nevertheless, the introduction of high yielding varieties can be a solution to this problem. Recently, The Gambia government in collaboration with the Africa Rice Centre (AfricaRice, Ex -WARDA) introduced high yielding rice varieties bred for Africa called the New Rice for Africa (NERICA). The NERICA varieties are the result of crosses between the Asian rice (O. stiva) and the African rice (O. glaberrima). These varieties combine desirable traits of both parents, which make them superior rice varieties. The desirable traits of NERICA from the Glaberrima parent include: resistance to drought, weed competition, blast and virus diseases, soil iron toxicity and acidity; while those from the Sativa parent include: good yields, absence of lodging and grain shattering and high fertiliser returns (Jones et al., 1997a and 1997b; Dingkuhn et al., 1998; Audebert et al., 1998; Johnson et al., 1998; Dingkuhn et al., 1999). These characteristics make the NERICA varieties highly suitable for adoption in SSA, thereby giving an excellent opportunity for the farmers to increase rice production and productivity. Since the development of NERICA, numerous endeavours have been made to widely disseminate them across SSA. However, the initial focus has been placed on seven West African “pilot” countries: Benin, The Gambia, Ghana, Guinea, Mali, Nigeria and Sierra Leone (WARDA, 2002). The NERICA varieties were first introduced into The Gambia through participatory varietal selection (PVS) in 1998. The PVS activities were initially hosted in three villages (Tujereng, Gifanga and Ntoroba). Tujereng and Gifanga are located in the Western Region while Ntoroba is situated in the North Bank Region of the country. The NERICA varieties were first introduced in these villages and later diffused to the surrounding near-by villages through farmers own channels, National Agricultural Research Institute (NARI) and Department of Agricultural Services (DAS). At present, the NERICA varieties have spread across all agricultural regions of the country. However, the adoption rates of NERICA has not been assessed up to now for countries like The Gambia. The objective of this paper is to present estimates of actual and potential adoption rates and their determinants for the NERICA varieties, based on findings from country-wide survey. METHODOLOGY Sampling. Multi-stage stratified random sampling was used to select the villages and farmers for the study. In the first stage, a list of all (sampling frame) the rice growing villages where NERICA seed were disseminated (NERICA villages) was obtained from the cereal programme of the National Agricultural Research Institute (NARI). This was later stratified between other villages where NERICA seeds where not disseminated (“non-NERICA villages”). The survey included five NERICA villages and five non-NERICA villages in each agricultural region except Western Region where ten NERICA and ten non-NERICA villages were selected. The NERICA villages were the first identified in each agricultural region, followed by a random selection of non-NERICA villages within a radius of 5-10 kilometers. The selection of the NERICA villages within each region was also stratified between districts in order to evenly select NERICA villages country-wide. The chance of selecting a non-NERICA village was depended upon the selection of a NERICA village within that vicinity. The second stage of sampling involved a stratified random sampling of men and women rice farmers in each selected village. Ten rice farmers were selected from each village for a total sample size of 600 rice farmers. However, more women farmers were selected during the sampling. Only 39 men were selected in addition to the women farmers. This is due to the fact that rice is mainly cultivated by women farmers in The Gambia (FAO, 1999). Out of the 70 villages selected, few men were identified in only 20 villages; the rest were all women rice producers. Data collection. The data were collected using two questionnaire schedules: ‘village and farmer questionnaires’. The ‘village questionnaire’ was administered to obtain a list of all the village rice varieties from knowledgeable farmers in each village through focus group discussions. For each rice variety listed, the respondents were asked to identify the type of variety, ecology in which the variety was cultivated, the person who introduced the variety and if applicable the institution where the person come from, the introduction method used, variety height and cycle. This was followed by questions regarding the characteristics of each variety. These included the agronomic and morphological; postharvest; cooking and organoleptic characteristics of each variety. The ‘farmer questionnaire’ was administered after the selection of rice farmers in each village. After each enumerator obtained a copy of the full list of the village varieties, the farmers were then asked whether they knew each of the listed varieties. If the answer to the question was yes, then the farmer was asked whether he or she had cultivated the variety in the last five years (2002 to 2006). The knowledge of the variety was defined as a yes answer to the first question and the adoption as the cultivation of the variety. This was followed by questions regarding the socioeconomic and demographic characteristics of each farmer. Estimation average treatment (ATE) of NERICA population adoption rates and their determinants. The study followed the ATE estimation methodology by Diagne and Demont (2007), to consistently estimate NERICA population adoption rates and their determinants in The Gambia (see, for example, Rosenbaum and Rubin, 1983; Angrist et al., 1996; Heckman, 1996; Wooldridge, 2002; Imbens, 2004; Heckman and Vytlacil, 2007a, b ). As pointed out by Diagne and Demont (2007), this approach is necessary because commonly used adoption rates estimators suffer either from what is referred to as “non-exposure” bias or selection bias. As a result, they yield biased and inconsistent estimates of population adoption rates even when based on a randomly selected sample. The “non-exposure” bias results from the fact that farmers who have not been exposed to a new technology cannot adopt it even if they might have done so if they had known about it (Diagne, 2006). This results in the population adoption rate being underestimated. Probably, the solution to the “non-exposure” bias problem is to take the adoption rate among those exposed to the technology as the true estimates of the population adoption rates. But, the sample adoption rate within the sub-population of farmers exposed to the technology is not a consistent estimate of the true population adoption rate either, even if the sample is random. Because of selection bias, it may either underestimate or overestimate the true population adoption rates (Diagne, 2006). The true population adoption rate corresponds to what is defined in the modern treatment evaluation literature as the average treatment effect, commonly denoted as ATE. The ATE parameter measures the effect or impact of a “treatment” on a person randomly selected in the population (Wooldridge, 2002, chapter 18). In the adoption context “treatment” corresponds to exposure to a technology and the ATE parameter is a measure of the potential demand of the technology by the target population under complete exposure. The adoption outcome measured by the ATE parameter is the population mean potential adoption rate. The difference between the population mean potential adoption outcome and the population actual (observed) adoption outcome is the non-exposure bias, also known as adoption gap, which exist because of incomplete diffusion of the technology in the population. Another parameter of interest is the average treatment effect on the treated, commonly denoted as ATE1 or ATT (Wooldridge, 2002, chapter 18). ATE1 is the mean adoption outcome within the sub-population of exposed farmers. The difference between the population mean adoption outcome (ATE) and the mean adoption outcome among the exposed (ATE1) is the population selection bias, PSB (Diagne, 2006; Diagne and Demont, 2007 ). The ATE can be identified by using methods that rely on the validity of the conditional independence assumption, which state that the treatment status w is independent of the potential outcomes y1 and y0 conditional on the observed set of covariates z that determine exposure ( w). The ATE estimators based on the conditional independence assumption are either a pure parametric regression-based method where the covariates are possibly interacted with treatment status variable (to account forheterogeneous impact), or they are based on a two-stage estimation procedure where the conditional probability of treatment P(w = lz) = P(z) called the propensity score is estimated in the first stage and ATE, ATE1 and ATE0 are estimated in the second stage by parametric regression-based methods or by non-parametric methods. The study uses two different estimators to estimate ATE1) semi-parametric weighting estimator 2) parametric method (For details, see Diagne and Demont, 2007). Semi-parametric weighting estimator of ATE. The equations outlined below was used to obtain non-parametric and semi-parametric ATE, ATE1 and ATE0 estimates of the NERICA population adoption rates using the observed NERICA adoption status (i.e., y is the 0-1 binary indication of the adoption of at least one NERICA variety), the NERICA exposure status, and a vector of selected household demographic and socioeconomic variables, and (Diagne and Demont, 2007). The estimation is based on two-stage procedure where the conditional probability of treatment , called the propensity (PS) is estimated in the first stage and ATE, ATE1 and ATE0 are estimated in the second stage.
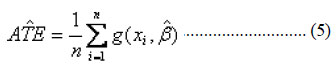
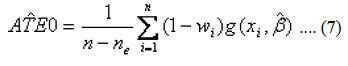
Parametric estimation of ATE. The parametric estimation procedure is executed by first specifying a parametric model. The method uses only the sub-population of exposed farmers to identify ATE. The identification is based on the following equations, which hold under the conditional independence assumption (see Diagne and Demont, 2007): E(y | x, w = 1) = g(x, β) ..... (4) where g in equation is a known (possibly nonlinear) function of the vector of covariates x and the unknown parameter vector β which is to be estimated using standard Least Squares (LS) or Maximum Likelihood Estimation (MLE) procedures using the observations (yi, xi) from the sub-sample of exposed farmers only with y as the dependent variable and x the vector of explanatory variables. With an estimated parameter β, the predicted values g(xi, β) are computed for all the observations i in the sample (including the observations in the non-exposed sub-sample) and ATE, ATE1 and ATE0 are estimated by taking the average of the predicted g(xi, β) i=1,..,n across the full sample (for ATE) and respective sub-samples (for ATE1 and ATE0):
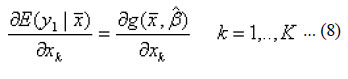
The effects of the determinants of adoption as measured by the K marginal effects of the Kdimensional vector of covariates x at a given point are estimated as:
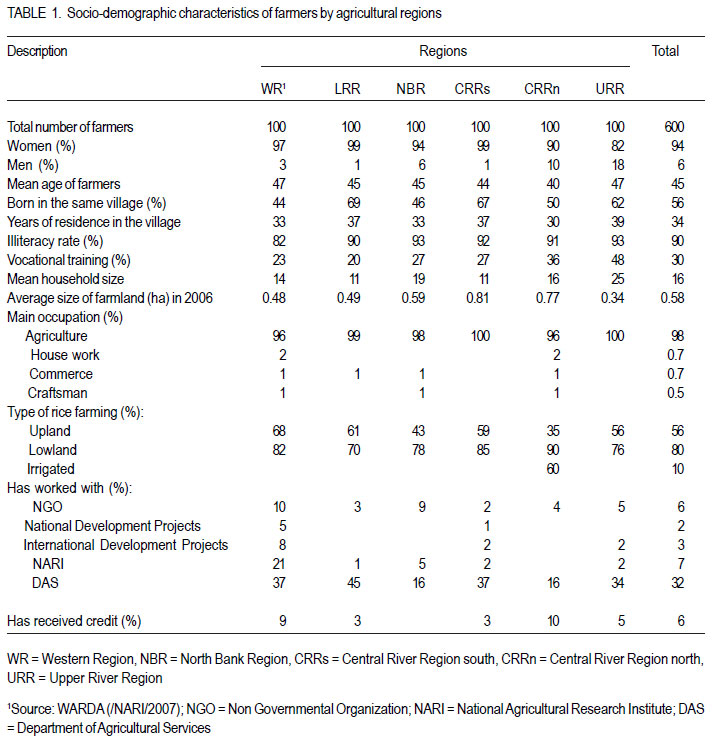
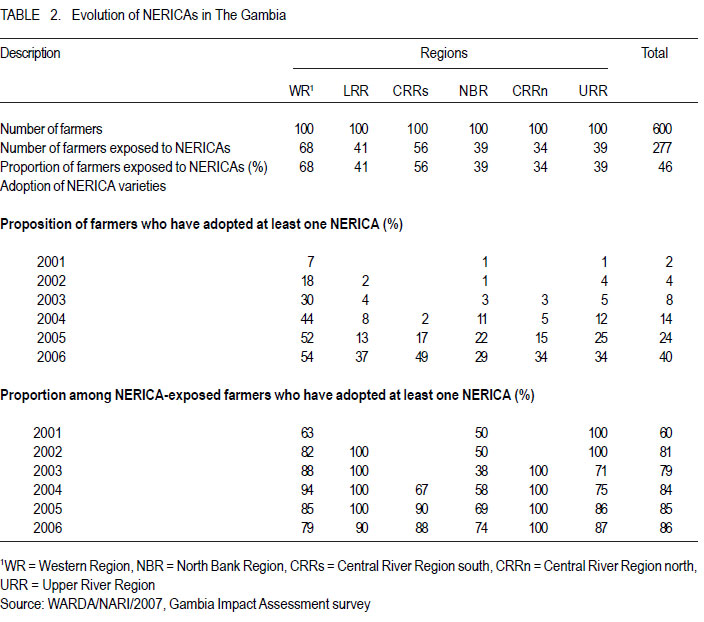
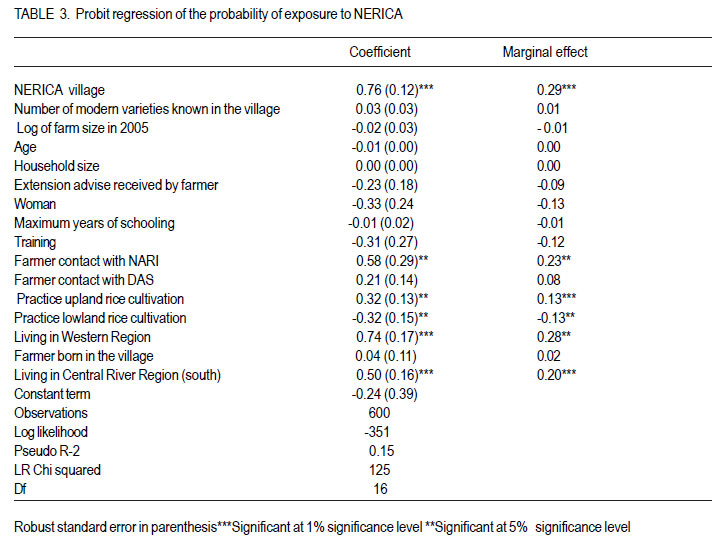
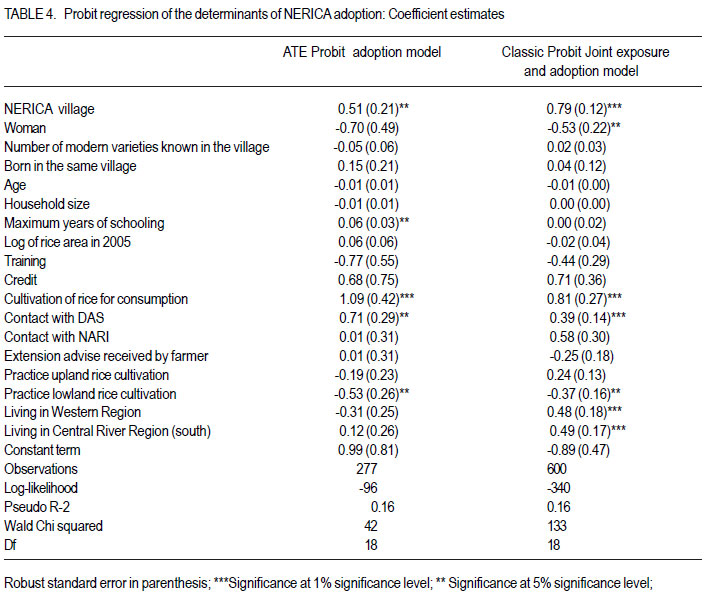
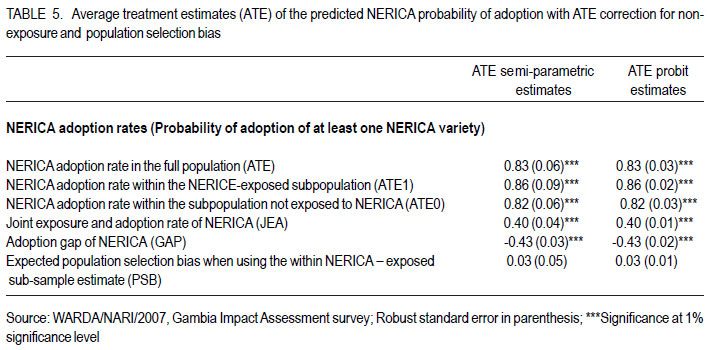
where xk is the kth component of x. The study used both the semi-parametric weighting estimators (equation 1,2, and 3) and the parametric regression based estimators (equation 4,5, and 6) by following the same procedures by Diagne and Demont (2007) to estimate ATE, ATE1, ATE0, the population adoption gap, and the population selection bias. All the estimations were done in Stata using the Stata add-on adoption command developed by Diagne (2007). RESULTS AND DISCUSSION Socio-demographic characteristics of survey farmers. Table 1 presents some of the sociodemographic characteristics of farmers by agricultural regions. About 95% of the surveyed farmers were women, which is consistent with other studies (FAO, 1999; Department of Agricultural Services, 2001) that have routinely identified women as the primary cultivators of rice in The Gambia. The mean age of the sample farmers was 45, which shows that rice farming is mainly practiced by the middle-aged group. A little over half of the survey farmers (56%) were born in the village where they live. The illiteracy rate among the sample farmers was 90%, which was found to be relatively low only in Western Region. The low illiteracy rate in Western Region could be attributed to the close proximity of most of its villages to the urban areas where the probability of getting access to education is highest. The average household size was 16 and on average about 98% of the farmers cited agriculture as their main activity. This is not surprising because almost two-third of the country’s population of about 1.5 million people is employed in the agricultural sector (World Bank, 2005). Only few farmers cited housework, commerce and craftsmanship as their main occupation. Moreover, upland, lowland and irrigated rice farming were practiced by 58%, 80%, and 10% of the farmers, respectively. The highest percentage of upland farmers was found in Western Region (see Table 1), which could be attributed to the fact that upland rice farming is mainly practiced in this part of the country (Bittage et al., 2002). Furthermore, the percentage of sample farmers that have worked with NGOs was found to be 6%, while, the national and international development projects was 2% and 3%, respectively. The percentage of farmers that have worked with NARI and DAS was 7% and 32%, respectively. Only 6% of the farmers have had access to credit. Diffusion and adoption of NERICA varieties in The Gambia. The sample diffusion and adoption rates of NERICA from 2001 to 2006 are shown in Table 2. Out of 600 farmers, only 277 were exposed to NERICA. This translates to 46% diffusion rate of NERICA within the sample villages. The highest exposure rate was observed among farmers in Western Region (WR) and the lowest in Central River Region north (CRRn). The exposure rates in the other regions were relatively high except for North Bank Region (NBR) and Upper River Region (URR). The high exposure rates of farmers to NERICA in WR and CRR could be explained by the fact that the main agricultural research institute, which coordinates NERICA dissemination activities in the Gambia, is stationed in the regions. Hence, we should expect more farmers in these regions to be aware of the existence of NERICA. Moreover, the fact that upland rice farming is mainly practiced in WR could further explain why most of the sample farmers in this region were exposed to NERICA. In contrast, the low diffusion rates in the other regions could be attributed to the prevalence of lowland rice cultivation. The result based on the sample adoption rates was 2% in 2001, which increased gradually to 40% in 2006. The highest sample adoption rate, in 2006, was observed in WR (54%) and the lowest in NBR (29%). With the exception of CRRs, the sample adoption rate was less than 40% for all the remaining regions (see Table 2). When the sample adoption rates are compared with that of the adoption rates among the exposed farmers, it can be clearly seen that the adoption rates among the exposed farmers are much higher. In 2006, the adoption rates among the exposed are higher than 70% for all the agricultural regions. However, because of non-exposure and selection biases that are associated with incomplete diffusion of a technology within the population, the aforementioned estimates can only be considered as a crude estimates of the true population adoption rates of NERICA in The Gambia. The sample adoption rates are affected by non-exposure bias problem, which result from the inclusion in the computation of adoption rate of non-adopting farmers who might have adopted NERICA if they knew about them. This results in the underestimation of the true population adoption rates. To address this problem, one would think it would be better to take the adoption rates among the sub-population of exposed farmers as the true estimate of the population adoption rates. But, the sample adoption rate within the sub-population of exposed farmers is also not a consistent estimate of the true population adoption rates. It may likely overestimate the true population adoption rate. The reason for this is a positive population selection bias by which the sub-population most likely to adopt a given technology is first exposed. It is most likely that the farmers that have been targeted for exposure to a technology are precisely those who are more likely to adopt it. Hence, the adoption rate in the targeted sub-population is most likely to overestimate the true population adoption rate. In the next section we use the counterfactual setting framework to obtain a consistent average treatment estimate (ATE) of the NERICA population adoption rates and its determinants. Determinants of farmer’s exposure to the NERICA. Table 3 shows the result of the probit regression of the probability of exposure to the NERICA rice varieties. The results show that the important factors determining farmers’ exposure to the NERICA varieties with positive coefficient estimates were significant at 5% level at least are: living in a village where NERICA seeds have been disseminated to farmers (“NERICA village”), farmer contact with NARI, practice of upland rice cultivation, living in Western and Central River Region (south). The only significant determinant with negative coefficient estimate is practice of lowland rice farming. Moreover, the marginal effect shows that being in Western Region and NERICA village are the most significant determinants of exposure to NERICA. “NERICA village” increases the probability of exposure by 29% while being in Western Region increases the probability of exposure by 28%. The high significance of “NERICA village” in determining farmer exposure to NERICA is indeed not surprising. At the initial phase of the NERICA dissemination activities in The Gambia, only few villages within each agricultural region were privileged to have access to NERICA seeds. The villages that had access to NERICA seeds used the communal lands for initial cultivation of the varieties. Consequently, we should expect more rice farmers from such villages to be aware of the NERICA. Also as expected, farmers from Western and Central River Region (south) or those who have contact with NARI should be more likely to know about the NERICA. The NERICA dissemination project, in The Gambia, is coordinated by NARI and the fact that NARI has its main station in Western Region and substation in Central River Region (south) explains why farmers who have contact with NARI and those located in Western and Central River Region (south) are more likely to be exposed to NERICA. Additionally, the initial introduction of NERICA through PVS to farmers in Western Region could further explain for the high probability of farmer exposure to NERICA in the region. Furthermore, the significant positive and negative effects of practice of upland and lowland rice cultivation, respectively on farmer exposure to NERICA are understandable. The firstgeneration of NERICA introduced to farmers in The Gambia are upland varieties. Hence, we should expect farmers who practice upland rice cultivation to be aware of their existence. Determinants of NERICA adoption rates. Table 4 presents the coefficient estimates of the probit regression of the determinants of NERICA adoption. The result of the ATE probit model, which is restricted to the sub-population of exposed farmers, is compared with the full sample estimates of the classic probit joint exposure and adoption model. A number of variables determining farmer adoption of the NERICA varieties are shown to be significant in both models. These include: living in a village where NERICA seeds have been disseminated to farmers: “NERICA village” (positive impact and statistically significant at 5% level at least), farmer contact with DAS (positive impact and significant at 5% level), cultivation of rice for consumption (positive impact and significant at 1% level) and practice of lowland rice cultivation (negative impact and significant at 5% level). Moreover, a few other variables are shown to be significant in only one of the models. The only significant variable in the ATE probit adoption model was maximum years of schooling (positive impact and significant at 5% level). The ones significant in only the classic probit joint exposure and adoption model are: being a woman (negative impact and significant at 5% level), living in Western and Central Region south (positive impact and significant at 1% level). The determinants of adoption, with the exception of being a woman, in both models have more or less the expected signs. The significant negative impact on adoption of being a woman in the classic probit joint exposure and adoption model was not expected. Rice is almost entirely cultivated by the women farmers in The Gambia. Consequently, one should expect being a woman to be positively correlated with adoption. The significant negative impact of being a woman on adoption in the classic probit joint exposure and adoption model could be attributed to the fact that classic probit joint exposure and adoption model use some sample farmers who are not exposed to NERICA to estimate the coefficients of the determinants of adoption. This can lead to bias because farmers who are not exposed to NERICA cannot adopt them even if they might have done so provided they were exposed. As a result, the coefficient estimates of the classic probit joint exposure and adoption model are likely to be inconsistent for the determinants of adoption. Hence, the coefficient estimates of the ATE probit adoption model, which controls for exposure, are the true estimates of the determinants of NERICA adoption. The positive and significant impact of living in a village where NERICA seeds have been disseminated to farmers (NERICA village) on adoption is again not surprising. It should be noted that mere exposure (awareness) to NERICA is not a sufficient condition for its adoption. Farmers must have access to NERICA seeds before any adoption can be effected. Since there is high probability of getting access to NERICA seeds in villages where NERICA seeds have been disseminated to farmers (“NERICA villages”), we should expect more farmers from such villages to adopt NERICA. Moreover, since the NERICA seeds are disseminated to farmers through the Department of Agricultural Services (DAS), we should expect farmers that have contact with the institute to adopt NERICA. Furthermore, rice is mainly cultivated in The Gambia for household consumption. Since consumption dictates rice production in almost all the agricultural regions of the country, it should not be surprising to find a significant positive impact of rice cultivation for consumption on NERICA adoption. In addition, the NERICA rice varieties mature earlier than most of the traditional varieties. Therefore, farmers cultivating rice purposely for consumption should be expected to adopt them in order to provide food for the household during times of scarcity. Moreover, the first-generation of NERICA introduced to farmers in The Gambia are upland varieties. Hence, we should least expect farmers who are more experienced in lowland rice cultivation to adopt them. Also, since NERICA are improved varieties, we should expect its adoption to be positively correlated with years of schooling. Estimated NERICA adoption rates. Table 5 presents the results of the predicted probability of NERICA adoption rates with the ATE correction for non-exposure and selection bias. ATE semi-parametric and ATE Probit models are used to acquire consistent estimates of NERICA adoption rates. The full population adoption rate (ATE), which depends on the demand of the technology by the target population, was estimated to be 83% by both the ATE semiparametric and ATE Probit models. This means that the NERICA adoption rates in The Gambia could have been 83% in 2006 instead of the actually observed 40% sample adoption rate, if the whole population of rice farmers was exposed to the NERICA in 2006 or before. The 40% sample adoption rate implies a very negative nonexposure bias of -43% (adoption gap) when the sample estimate under incomplete diffusion is wrongly used to represent the true population adoption rate. Moreover, it is interesting to note that the 86% adoption rate among the presently NERICA exposed sub-population (ATE1) is very closed to the full population potential adoption rate (ATE). This indicates an insignificant population selection bias, which is confirmed by the data analysis. The insignificant population selection bias is a further indication that all the sample farmers had almost equal opportunity of adopting NERICA. Furthermore, the potential adoption rate among the sub-population of farmers that are not exposed to NERICA (ATE0) was estimated to be 82% by both models. This shows that about 82% of those farmers would have adopted NERICA if exposure was complete in 2006 or before. This estimate shows a very high unmet demand for NERICA in The Gambia. CONCLUSION The study revealed that the sample adoption rate does not consistently estimate the true population adoption rate under incomplete diffusion of a new technology even if the sample is randomly selected. This was the case because farmers who were not exposed to NERICA could not adopt them even if they might have done so provided they were exposed. This resulted in the population adoption rate being underestimated. The possible solution to this problem is to take the adoption rate within the sub-population of exposed farmers. However, due to selection bias the adoption rate within the sub-population of exposed farmers may also not serve as a good estimate of the true population adoption rate. It can either underestimate or overestimate the true population adoption rate. Hence, controlling for non-exposure and selection biases is a perquisite to acquiring consistent estimates of the adoption rates of a new technology that is not universally known in the population. After controlling appropriately for nonexposure and selection biases, the paper shows that the NERICA population adoption rate (ATE) in The Gambia could have been 83% instead of the 40% sample adoption rate provided exposure was complete in 2006. This shows a negative nonexposure bias -43% (adoption gap) if the sample estimate is wrongly used to represent the true population adoption rate in 2006. Moreover, the adoption rate within the sub-population of nonexposed farmers (ATE0) is estimated to be 82%. This estimate shows a very high unmet demand for NERICAs in The Gambia, which has a policy implication in terms of judging the intrinsic merits of the desirability of the technology by the target population and also in terms of making decision to invest or not in its wide dissemination. Additionally, the study has shown a number of factors that influence the exposure and adoption rates of NERICA in The Gambia. The most important of the factors was exposure to NERICA through the “NERICA village”. This factor determined the probability of exposure to NERICA by 29% and influenced the adoption rates at 1% significance level. Hence, for successful dissemination of NERICA in The Gambia, more “NERICA villages” should be created. This will not only expose farmers to NERICA but it will ensure that they get access to the seed, which is a prerequisite for the adoption of any high-yielding agricultural technology. REFERENCES
Copyright © 2012 - African Crop Science Society The following images related to this document are available:Photo images[cs12021t2.jpg] [cs12021t5.jpg] [cs12021t4.jpg] [cs12021t1.jpg] [cs12021t3.jpg] |
| |||||||||
