 |
| About Bioline | All Journals | Testimonials | Membership | News |
|
||||||
|
||||||
Estimation of the fertilizer response of maize and bean intercropping using sole crop response equations C.S. WORTMANN, H.F. SCHNIER^1 and A.W. MURIUKI^1 CIAT, Kawanda ARI, P.O. Box 6247, Kampala, Uganda ^1FURP, P.O. Box 47051, Nairobi, Kenya (Received 10 July 1995; accepted 22 October 1995)
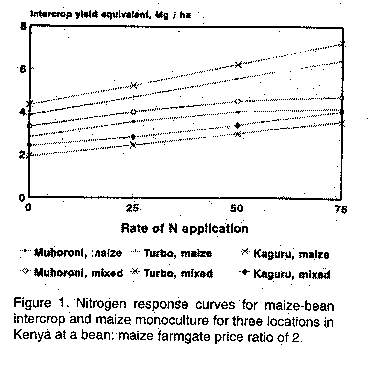
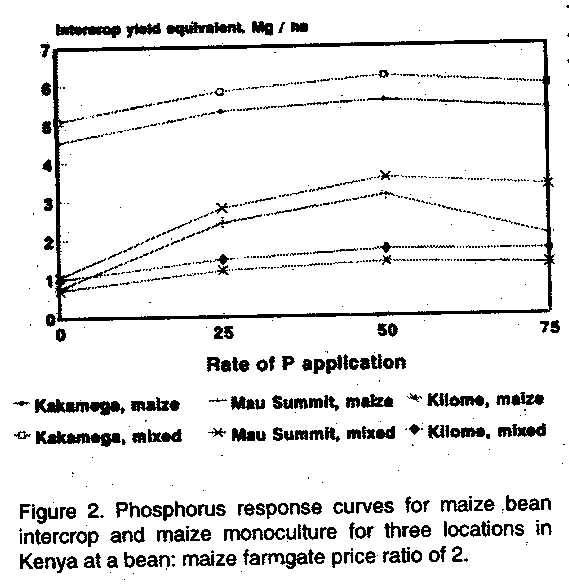
ABSTRACT Maize (Zea mays L.) and bean (Phaseolus vulgaris L.) are commonly grown in association in eastern and southern Africa. Results from 64-fertilizer response trials conducted in Kenya were used to study the relationship between maize monoculture response to fertilizer nitrogen and phosphorus and the intercrop response. The intercrop was more productive that the monoculture with no fertilizer applied, but overall responses of systems to applied nutrients did not differ. Maize, both in monoculture and intercropped, responded more frequently to applied N than did the intercropped bean. Frequency of response to applied P was similar for both crops and both production systems. The basis was established to estimate maize-bean intercrop fertilizer response using response equations for maize monoculture. Key Words: Intercrop, nitrogen, Phaseolus vulgaris, phosphorus, Zea mays RESUME En Afrique de l'est et australe, le mais (Zea mays L.) et le haricot (Phaseolus vulgaris L.) sont habituellement cultives en association. Les resultats de 64 essais de reponse aux fertilisants conduits au Kenya etaient utilises pour etudier le rapport entre les reponses de l'azote et du phosphore au mais en monoculture et en culture mixte. La culture mixte etait plus productive que la monoculture qui n'a pas renu de fertilisants. Toutes les reponses des systemes qui ont renu les fertilisants n'etaient pas differentes. Le mais, a la lois en monoculture et en association, repondait plus a l'application d'azote que le haricot en association. La frequence de reponses a l'application du phosphore etait similaire pour toutes les 2 cultures et dans tous les 2 systemes de production. La base etait ainsi etablie pour estimer la reponse de fertilisants a la culture associee de mais - haricot en utilisant les equations de reponse pour le mais en monoculture. Mots Cles: Cultures mixtes, azote, Phaseolus vulgaris, phosphore, Zea mays INTRODUCTION Capability in the estimation of multiple-crop fertility response is needed (Barker and Francis, 1986). One major constraint to establishing response curves for multiple cropping systems is that systems management varies over time and space as farmers' objectives differ; this results in variation of the relative competitive ability of the component crop species. In Kenya, maize is generally the most important component of the maize-bean intercropping system, and the system is managed to attain nearly ,full maize yield with a limited off-take of bean production. In parts of Uganda, the opposite is true. In areas of bimodal rainfall distribution, maize is often given priority in the long rain season while bean is given priority in the short rain season. As the relative proportions of the component crop species vary, fertility needs are expected to change. Also, crop species differ in their ability to take up available nutrients and in the use efficiency of nutrients; these characteristics are much affected by environment (Lynch and White, 1992) and probably by genotype by environment interaction effects. Such effects are likely to be more problematic in studying the fertilizer response of multiple crop versus monocrop systems. Attempts to provide the basis for estimating intercrop fertilizer needs have been reviewed by Mkandawire et al. (1990). Waghmare and Singh (1984) and Barker(1984) developed multiple regression response equations from the results of fertilizer response trials for multiple crops. A disadvantage of this approach is that it requires several seasons of trials conducted in numerous environments in which the multiple cropping system is important. Oelsligle et al. (1976) proposed that total nutrient removal by an intercropping system be the basis for estimating the fertilizer needs of that system. Wahua (1983) developed this idea further and proposed a "nutrient supplementation index" (NSI). NSI estimates total fertility input needs for the multiple cropping system based on the nutrient uptake of each crop component relative to their monoculture uptake. With NSI, intercrop fertilizer needs could be estimated from established sole crop response curves for the component species. Alternatively, fertilizer needs for the multiple crop system could be estimated for a given planting pattern using the response equations of one or more of the component species. The Fertilizer Use Recommendation Project (FURP) was implemented in Kenya with trials conducted for up to five years at multiple locations. FURP estimated response equations for monocrop maize and for the maize-bean intercrop. The results of this research have been used in this study to determine the feasibility of estimating the fertilizer requirements of the intercrop using maize monoctflture response equations, and, conversely, the feasibility of estimating monocrop needs when aresponse equation exists for the intercrop system. MATERIALS AND METHODS FURP conducted fertilizer response trials at numerous locations in Kenya over the period 1987 - 1992, for both continuous maize monoculture and continuous planting of the maize-bean intercropping system (FURP, 1987). The maize monocrop was planted at a spacing of 75 x 60 cm with two plants per hi 11 (approximately 44,444 plants ha^-1). Intercropped maize was planted as in monoculture, and a single row of intercropped beans was planted between each pair of maize rows with 20 cm between the plants (66,667 plants ha^-1, or 33% of normal sole crop density). Varieties differed with agroecological zones. Maize varieties used were H625, H614, H622, H512, H511 and Katumani Composite B. Bean varieties were GLP 2 and GLP 1004. N and P fertilizers were applied in bands near the maize rows at rates of O, 25, 50 and 75 kg ha^-1 in a 4 x 4 factorial arrangement. Trial design was a randomised complete block with fixed plots receiving the same treatment over the duration of the research. Plot size was 6 x 6 m, with two replications per site per season. Response equations determined previously by FURP for 64 site-seasons using stepwise regression analysis, each site being used for at least four years of testing, were used to estimate the mean yields for each of the 16 fertilizer treatments. Using these data, equations were determined to predict an intercrop response curve for both N and P205, at the four rates of application, using rate/environment means for maize monoculture yield as the independent variable and rate/environment means for intercrop yield equivalent (IYE) as the dependent variable. IYE equalled the maize yield plus a multiple of the bean yield, and was independently estimated for alternative ratios of farmgate values of bean to maize, including 1.5, 2.0, 2.5 and 3.0. For example, if the bean to maize price ratio were 2.0, with a mean intercrop maize yield of 2500 kg ha^-1 and a mean intercrop bean yield of 700 kg ha^-1, then the IYE would be 3900 kg ha^-1. The agronomic and statistical significance of the R^2 values of the equations provide the basis for testing this hypothesis. RESULTS AND DISCUSSION Productivity of the maize-bean intercrop was greater than the maize monoculture at all levels of fertilization, but yield responses to applied nutrients were similar for both systems (Table 1), indicating that overall efficiency of fertilizer use was not improved with intercropping. N-linear, followed by P-linear effects on both monoculture and intercrop-maize yield were most common in the response equations determined for the 64 site-seasons (Table 2). In the maize response equations, frequency of significance of the linear, quadratic and interaction variables was similar for the low, medium and high yield potential environments. The P-linear variable was most often significant for bean, especially in the low potential environments. N x P interaction effects, which were only significant in approximately 22% of the response equations, are likely to reduce the efficiency of predicting the N and P fertilizer requirements of the intercrop. Equations for estimating a response curve for maize-bean intercropping are presented in Tables 3 and 4 for N and P205, for four ratios of bean:maize farmgate value. Variation in maize monoculture yield accounted for approximately 80% of the variation in IYE at the various levels of N and P, and R^2 values were highest with the lower ratios of bean to maize value. The covariance is largely due to the close relationship of maize monoculture yield with maize intercrop yield as might be expected since maize is the dominant crop in this system (Table 5). Monoculture maize yield also was significantly and positively related to bean intercrop yield indicating that intercrop bean was able to take advantage of better growing conditions to compensate for increased competitiveness by intercrop maize associated with such conditions. The results confirm the feasibility of predicting N and P fertilizer response of a maize-bean intercrop from response equations for maize monoculture. The shapes of the estimated inter crop response curves are very similar to their associated maize .monoculture curve (Figs. 1 and 2). It is also obvious that maize monoculture fertilizer response can be predicted using existing intercrop response equations. For example, if intercrop equivalent yield (Y)= 443 + 0.94 x M (maize monoculture yield), then M = (Y- 443) / 0.94. TABLE 1. Maize yield and intercrop yield equivalent (kg ha^-1) with no N or P applied, and the yield increments with nutrient application
Monoculture maize      Intercrop maize-bean
N, 0 kg    2870        3360**
P, 0 kg    3124        3561**

Overall yield increments with fertilizer application

N, 0 - 25 kg    394    342 ns
N, 25 - 50 kg   314    321 ns
N, 50 - 75 kg   238    309 **
P, 0 - 25 kg    224    239 ns
P, 25 - 50 kg   135    129 ns
P, 50 - 75 kg    65    48 ns
ns,** indicate non-significant and significant differences (Paired comparison test, P = 0.01 ), respectively, between maize monoculture and maize - bean intercrop. TABLE 2. Frequency of independent variables being statistically significant in the fertilizer response equations (n= 64)
                       N    N2    P    P2    NP
------------------------------------------------
Maize, monoculture    40   14    23    15    19
Maize, intercrop      41    8    19    10    12
Bean, intercrop       11    5    22    11    12
Figure 2. Phosphorus response curves for maize bean intercrop and maize monoculture for three locations in Kenya at a bean: maize farm gate price ratio of 2.
Farmgate value of bean equal to value of 1.5 kg of maize
-----------------------------------------------------------
 0 Kg ha^-1 of P2O5, = Y = 130 + 1.04 * M, R^2 = 0.843
25 kg ha^-1 of P2O5, = Y = 115 + 1.04 * M, R^2 = 0.856
50 kg ha^-1 of P2O5, = Y = 145 + 1.03 * M, R^2 = 0.841
75 kg ha^-1 of P2O5, = Y = 225 + 1.02 * M, R^2 = 0.776

Farmgate value of bean equal to value of 2.0 kg of maize

 0 kg ha^-1 of p2O5, = y = 227 + 1.07 * M, R^2 = 0.812
25 kg ha^-1 of P2O5, = Y = 200 + 1.08 * M, R^2 = 0.856
50 kg ha^-1 of P2O5, = Y = 228 + 1.07 * M, R^2 = 0.828
75 kg ha^-1 of P2O5, = Y = 293 + 1.06 * M, R^2 = 0.745

Farmgate value of bean equal to value of 2.5 kg of maize

 0 kg ha^-1 of P2O5, = Y = 268 + 1.12 * M, R^2 = 0.828
25 kg ha^-1 of P2O5, = Y = 284 + 1.11 * M, R^2 = 0.834
50 kg ha^1- of P2O5, = Y = 312 + 1.11 * M, R^2 = 0.812
75 kg ha^-1 of P2O5, = Y = 360 + 1.11 * M, R^2 = 0,711

Farmgate value of bean equal to value of 3.0 kg of maize

 0 kg ha^-1 of P2O5, = Y = 338 + 1.16 * M, R^2 = 0.817
25 kg ha^-1 of P2O5, = Y = 368 + 1.15 * M, R^2 = 0.821
50 kg ha^-1 of P2O5, = Y = 396 + 1.15 * M, R^2 = 0.796
75 kg ha^-1 of P2O5, = Y = 427 + 1.16 * M, R^2 = 0.676
It should be noted that these equations can be changed to predict maize monoculture P2O5 needs when only intercrop response equations are available. The equation Y = 130 + 1.04 * M is converted to M = (Y- 130) / 1.04. TABLE 3. Equations for estimating the N fertilizer requirements for the maize-bean intercrop at four rates of N with maize yield (M) (kg ha^-1) as the independent variable and intercrop yield equivalent (Y) as the dependent variable
Farmgate value of bean equal to value of 1.5 kg of maize

 O kg ha^-1 of N, Y = 443 + 0.94* M, R^2 = 0.776
25 kg ha^-1 of N, Y = 135 + 0.91* M, R^2 = 0.834
50 kg ha^-1 of N, Y = -19 + 0.92 *M, R^2 = 0.825
75 kg ha^-1 of N, Y =   9 + 1.07 *M, R^2 = 0.842

Farmgate value of bean equal to value of 2.0 kg of maize

 0 kg ha^-1 of N, Y = 525 + 0.99 * M, R^2 = 0.762
25 kg ha^-1 of N, Y = 201 + 1.07 * M, R^2 = 0.819
50 kg ha^-1 of N. Y =  44 + 1.11 * M, R^2 = 0.835
75 kg ha^-1 of N. Y =  81 + 1.11 * M, R^2 = 0.806

Farmgate value of bean equal to value of 2.5 kg of maize

 0 kg ha^-1 of N, Y = 609 + 1.03 * M, R^2 = 0.743
25 kg ha^-1 of N, Y = 233 + 1.14 * M, R^2 = 0.769
50 kg ha^-1 of N, Y = 108 + 1.15 * M, R^2 = 0.817
75 kg ha^-1 of N, Y = 154 + 1.15 * M, R^2 = 0.783

Farmgate value of bean equal to value of 3.0 kg of maize

 0 kg ha^-1 of N, Y = 692 + 1.07 * M, R^2 = 0.724
25 kg ha--1 of N, Y = 333 + 1.16 * M, R^2 = 0.781
50 kg ha^-1 of N, Y = 171 + 1.20 * M, R^2 = 0.796
75 kg ha^-1 of N, Y = 226 + 1.19 * M, R^2 = 0.760
It should be noted that these equations can be changed to predict maize monoculture N needs when only intercrop response equations are available. The equation Y = 443 + 0.94 * M is converted to M = (Y- 443) / 0.94. TABLE 5. Coefficients of correlation for monoculture maize yield with intercrop maize yields and intercrop bean yields across 64 environments and 16 N and P fertilizer combinations (significant at P = 0.001 if r > 0.40).
Rates of    N applied      P2O5 applied
nutrient   -------------   -------------
application Maize  Bean    Maize    Bean
(kg ha^-1)
----------------------------------------
0           0.88    0.47    0.92    0.57
25          0.92    0.49    0.93    0.52
50          0.93    0.48    0.92    0.48
75          0.92    0.42    0.90    0.39
Future experimentation to establish N and P response equations for other environments should either focus on the maize monoculture or the maize-bean intercrop since equations for one can be used to estimate the response equations for Fertilizer requirements for maize-bean intercropping the other. If the intercrop planting pattern differs from that used in the FURP study, especially in favouring the intercrop bean crop, the equations for predicting points on a response curve will have to be modified, possibly by applying the NSI concept. ACKNOWLEDGEMENTS Financial assistance for the field research was provided by the European Union and the German Agency for Technical Cooperation (GTZ). Assistance in various forms provided by the Government of Kenya facilitated implementation. Special gratitude is due to the many field staff of the Ministry of Agriculture who participated in this research. The role of CIAT in this work was funded by the Office of Agriculture of the Bureau of Cooperation and Development in the United States Agency for International Development. REFERENCES Barker, T.C. 1984. Shifting Cultivation Production Constraints in the Upland Philippines. Ph.D. Dissertation, University of Missouri - Columbia, Missouri. Barker, T.C. and Francis, C.A. 1986. Agronomy of multiple cropping systems. In: Multiple Cropping Systems. Francis, C.A. (Ed.), pp. 161 - 182. Macmillan Publishing Company, New York and London. FURP. 1987. Final Report, Annex III. Fertilizer Use Recommendation Project. Ministry of Agriculture, Nairobi. Vol. 1-31. FURP. 1994. Fertilizer use recommendations. Fertilizer Use Recommendation Project (FURP), Vol. 1-24, Kenya Agricultural Research Institute, Nairobi, Kenya. Lynch, J. and White, I.W. 1992. Shoot nitrogen dynamics in tropical common bean. Crop Science 32:392-397. Mkandawire, A.B.C., Ngwira, L.D.M. and Edje, O.T. 1990. Fertilizer research in intercrops. In: Research Methods for Cereal Legume Intercropping. Proceedings of a Workshop on Research Methods for Cereal Legume Intercropping in Eastern and Southern Africa. Waddington, S .R., Palmer, A.F.E. and Ldje, O.T. (Eds.), pp. 45-55. Mexico, D.F.: CIMMYT. Oelsligle, D.D., McCollum, R.E. and Kang, B.T. 11976. Soil fertility management in tropical multiple cropping. In: Multiple Cropping. Papendick, R.I., Sanchez, P.A. and Triplett, G.B. (Eds.) American Society of Agronomy Special Publication 27:275-292. Waghmare, A.B. and Singh, S.P. 1984. Sorghum-legume intercropping and the effects of nitrogen fixation. I. Yield and nitrogen uptake by crops. Experimental Agriculture 20:251-1259. Wahua, T.A.T. 1983. Nutrient uptake by intercropped maize and cowpeas and a concept of nutrient supplementation index (NSI). Experimental Agriculture 19:263-275. Copyright 1996 The African Crop Science Society
The following images related to this document are available:Line drawing images[cs96039b.gif] [cs96039a.gif] |
| |||||||||
