 |
| About Bioline | All Journals | Testimonials | Membership | News |
|
||||||
|
||||||
GRASS WEED COMPETITION AND CALCULATED ECONOMIC THRESHOLD DENSITIES IN BREAD WHEAT IN ETHIOPIA
TAYE TESSEMA and D.G. TANNER^1
Plant Protection Research Centre (I.A.R.), P.O. Box 254, Ambo, Ethiopia (Received 15 July, 1997; accepted 3 November, 1997)
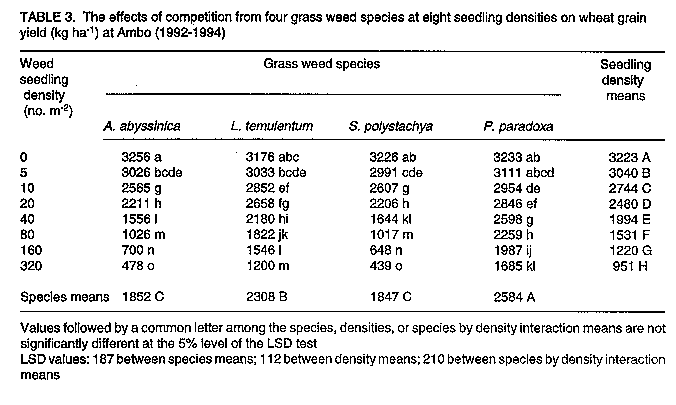
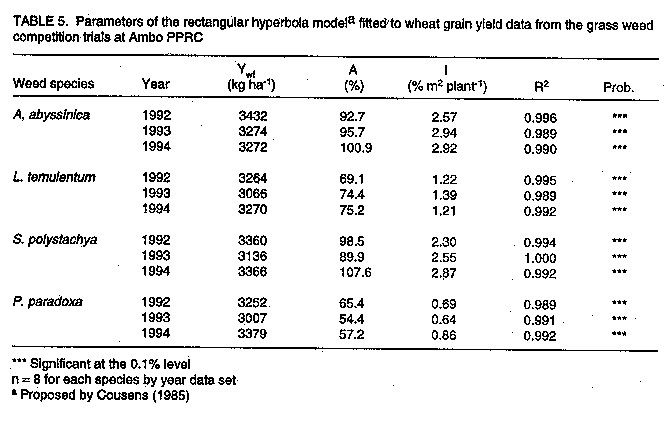
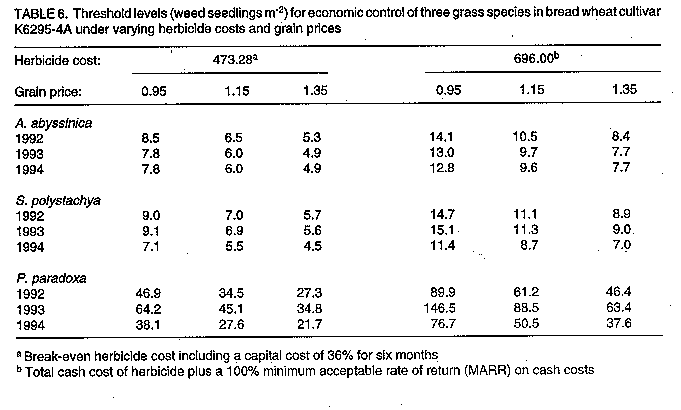
Code Number:CS97043 ABSTRACT Competition effects of four of the predominant grass weed species in Ethiopia (Avena abyssinica Hoechst, Lolium temulentum L., Snowdenia polystachya Fresen (Pilg), and Phalaris paradoxa L.) on the grain yield, yield components and morphological characters of bread wheat (Triticum aestivum L.) were studied in Western Shewa Zone of Ethiopia. The four grass species varied significantly in their effects on wheat tillering, leaf area index (LAI), number of fertile spikes m^-2, grains per spike, spike length, thousand grain weight, straw, biomass and grain yield, harvest index and plant height. Avena abyssinica and S. polystachya were the most competitive, reducing wheat yield components and morphological characters to a greater extent than L. temulentum and P. paradoxa. Grass species by seedling density interaction effects were significant for most of the crop and weed characters measured, indicating a differential rate response for individual species. The reduction in wheat grain yield at the maximum weed density of 320 seedlings m^-2 ranged from 48 to 86% across the four grass species studied. The wheat yield components most affected by weed competition were number of fertile spikes m^-2 and number of seeds spike-1. Weed morphological characters (i.e., number of tillers, LAI, number of panicles, and plant height) varied markedly among species and in direct proportion with weed seedling density. Plant height and LAI appeared to be the factors most closely associated with weed competitive ability with bread wheat. Competitive yield losses were fitted to a rectangular hyperbola model to facilitate the prediction of wheat grain yield loss, and to derive economic thresholds for herbicidal intervention in relation to weed seedling density. Key Words: Competition, grass weeds, herbicides, wheat, yield components, yield loss RESUME Les effets de competition de quatre des especes de mauvaises herbes predominantes en Ethiopie (Avena abyssinica Hoechst, Lolium temulentum L., Snowdenia polystachya Fresen (Pilg), et Phalaris paradoxa L.) sur le rendement en grain, les composantes du rendement et les caracteres morphologiques du ble tendre (Triticum aestivum L.) ont ete etudies dans la zone Shewa Ouest d'Ethiopie. Les quatre especes de mauvaises herbes varient significativement dans leurs effets sur le tallage du ble, l'index de la surface foliaire (LAI), le nombre d'epis fertiles au m^2 et de grains par epis, la longueur de l'epi, le poids de 1000 grains, la paille, la biomasse, le rendement en grains, l'index de recolte et la taille de la plante. A. abyssinica et S. polystachya etaient les plus competitives, reduisant les composantes du rendement du ble et les caracteres morphologiques dans une plus large mesure que L. temulentum et P. paradoxa. Les effets de l'interaction, espece de mauvaise herbe par densite de semis, etaient significatifs pour la plupart des cultures et des caracteres de la mauvaise herbe mesures, indiquant une reponse differentielle pour les especes individuelles. La reduction du rendement en grain du ble a la densite maximale de mauvaise herbe de 320 plantules au m^2 variaient de 48 a 86% chez les quatre especes de graminees etudiees. Les composantes du rendement du ble les plus affectees par la competition des mauvaises herbes etaient le nombre d'epis fertiles au m^2 et le nombre de graines par epis. Les caracteres morphologiques des mauvaises herbes (i.e., nombre de talles, LAI, nombre de panicules et taille de la plante) variaient nettement entre les especes et en proportion directe avec la densite de plantules de mauvaises herbes. La taille de la plante et LAI semblaient etre les facteurs les plus etroitement associes a l'habilite de competition de la mauvaise herbe avec le ble. Les pertes de rendement en competition ont ete ajustees a un modele rectangulaire hyperbolique pour faciliter les previsions des pertes de rendement en grains de ble et pour determiner les seuils economiques d'application d'herbicides en relation avec la densite de plantules de mauvaises herbes. Mots Cles: Adventices, ble, competition, composantes du rendement, herbicide, perte du rendement INTRODUCTION Grass weeds are problematic in the wheat growing regions of Ethiopia for several reasons (Tanner and Giref, 1991). Seeds of many grass species, such as wild oat (Avena spp.), are difficult to separate from wheat seed. Removal of grass weeds by hand weeding in a broadcast wheat crop is practically impossible during early growth stages (i.e., when yield losses occur) due to the similar morphology between grass weeds and wheat. Thus, farmers in Ethiopia tend to delay hand weeding until the weeds are visually distinct from crop plants, exposing the crop to weed competition for an extended period. Chemical weed control, on the other hand, necessitates the use of relatively expensive herbicides which farmers may not be able to afford; often, grass herbicides are not readily available in Ethiopia. As regards annual grass weeds in Ethiopia, surveys have shown that Snowdenia polystachya, Phalaris paradoxa, Lolium temulentum, Avena abyssinica, A. fatua, Bromus pectinatus and Setaria pumila comprise the major problematic species in wheat growing regions (Birhanu, 1985; Rezene, 1985; SPL, 1980; Tanner and Giref, 1991). The first four species are considered in this review. In the UK, A. fatua competition decreased the number of fertile tillers per plant and grains per ear of barley, and reduced individual grain size (Wilson and Peters, 1982). Viola arvensis depressed the grain yield of spring wheat mainly by reducing stand density, number of grains per ear, and thousand grain weight (Holzmann and Niemann, 1986). Abdul Majid and Sandhu (1984) reported that wheat under competition from Fumaria parviflora exhibited significantly decreased numbers of productive tillers, plant height, grains per spike and thousand grain weight. Control measures are necessary to prevent weed infestations from reaching levels at which economic loss is incurred. Thus, the decision to apply a specific weed control measure should be based on an accurate estimation of the potential crop loss as a result of weed competition; this must be weighed against the cost of weed control (Auld et al., 1987). To determine the threshold weed density at which a given weed control operation is economically feasible, basic knowledge is required of the degree to which a given weed infestation is likely to reduce yield if left uncontrolled. Models of weed-crop competition are an essential component of any economic analysis. Wheat yield loss experiments, involving weed density as a variable, have been extensively reported in the literature (Dew, 1972; Taye et al., 1996a, 1996b; Wilson et al., 1990), and the various models used have been reviewed by Zimdahl (1980) and Cousens (1985). The experiment described in this review was conducted to determine the competitive effects of varying densities of four of the major annual grass weed species in Ethiopia on bread wheat yield and yield components, and to determine economic threshold weed densities. MATERIALS AND METHODS Field experiments were conducted at the Plant Protection Research Center (PPRC) of the Institute of Agricultural Research of Ethiopia during the three cropping seasons of 1992-1994. The PPRC is located at an altitude of 2225 m a.s.l. and is 125 km west of Addis Ababa (8 degrees 57' N lat. and 37 degrees 52' E long.). The PPRC soil is an unclassified Vertisol. Mean annual maximum and minimum temperatures are 26.0 and 11.5 C, respectively. Mean annual rainfall is 1160 mm (measured over ten years). Experimental design and methodology have been described in detail in Taye et al. (1996a; 1996b). The experimental design used was a split-plot arrangement of an RCBD with three replications. Main plots consisted of the four grass weed species, Avena abyssinica [Aa], Lolium temulentum [Lt], Snowdenia polystachya [Sp] and Phalaris paradoxa [Pp]. Eight subplots consisted of weed seedling densities (0, 5, 10, 20, 40, 80, 160 and 320 seedlings m^-2). Germination tests were conducted for each grass weed seed sample to determine the amount of seed required to obtain the specified seedling densities in the field. Additionally, the emergence rates of the four weed species were determined relative to the bread wheat cultivar used. Maintenance of treatments consisted of continuous hand weeding of non-target weed species and the surplus seedlings of target weeds before they reached a height of 5 cm or the two leaf stage. Subplots comprised 7 rows of wheat spaced at 20 cm and extending 1.6 m in length. Urea and diammonium phosphate fertilizers were broadcast at total nutrient rates of 60 kg N and 26 kg P ha^-1 and were manually incorporated into the soil prior to seeding. The bread wheat cv. K6295-4A was used as the test crop at a seed rate of 120 kg ha^-1, equivalent to 380 seeds m^-2. Wheat was sown into rows marked by hand. A net plot, consisting of three central rows of 1.0 m length (0.6 x 1.0 m = 0.6 m^2), was marked with pegs in each subplot; this area was used for measuring yield and yield components. Analysis of variance was conducted for each measured parameter within and across seasons. Interaction means and main effect means were compared by the LSD test at the P=0.05 level. Wheat yield (Y) data (kg ha^-1) was fitted to a rectangular hyperbola model as proposed by Cousens (1985) as follows:
    ywf = yield (kg ha^-1) in the absence of weeds,
      A = percentage yield loss as weed density approaches infinity,
      I = percentage yield loss per unit of weed density as the density
          approaches zero, and
      d = weed density in number m^-2.
The hyperbolic equation, expressing grain yield loss (YL) in kg ha^-1 is:
Economic analysis. Subsequent to generating grain yield loss response functions, the economic feasibility of herbicidal grass weed control was studied in order to determine threshold levels of three of the grass weeds under varying price assumptions. A high efficacy herbicide, fenoxaprop-P-ethyl (product trade name Puma S^R marketed by the Hoechst company) applied at 70 g a.i. ha^-1 (=1 l product ha^-1), was selected for the determination of threshold weed levels on the basis of its superior efficacy in prior on-farm screening carried out in Ethiopia (Amanuel et al., 1992); pre-emergence application of fenoxaprop-P-ethyl has provided an average of 94, 81 and 99% control of the target grass weeds Aa, Pp and Sp, respectively (Rezene et al., 1990; Amanuel et al., 1992). Current prices associated with herbicide purchase and application and grain marketing were obtained from government extension agents and from market surveys (Taye and Tanner, 1997). The cash cost of herbicidal weed control was estimated at 348 Ethiopian Birr ha^-1 (=330 EB l^-1 of Puma S^R plus 18 EB ha^-1 for custom spray application by backpack sprayer). Two cost levels were assumed in this analysis: the break-even cost (473.28 EB ha^-1) which includes a six month capital cost of 36% and a more conservative cost level (696 EB ha^-1) which includes a 100% minimum acceptable rate of return (MARR) on the farmer's investment in herbicidal weed control (CIMMYT, 1988). The mean wheat grain price of 1.15 EB kg^-1 was varied by +0.2 EB kg^-1 to evaluate the sensitivity of threshold levels. Mean grain prices were reduced by harvesting costs of 0.12 EB kg^-1 to derive net field prices (i.e., the approximate exchange rate during early 1997 was 6.6 EB = 1 US$). Economic threshold weed densities (associated with herbicidal control by fenoxaprop-P-ethyl) for the individual weed-crop combinations were determined based on the methodology of Auld et al. (1987). For each weed-crop competitive interaction using the Cousens (1985) model, the value of crop grain yield recovered (VR) per ha by herbicidal weed control was calculated as follows:
d = A/[((peywf/100*c)*A - 1)*I].
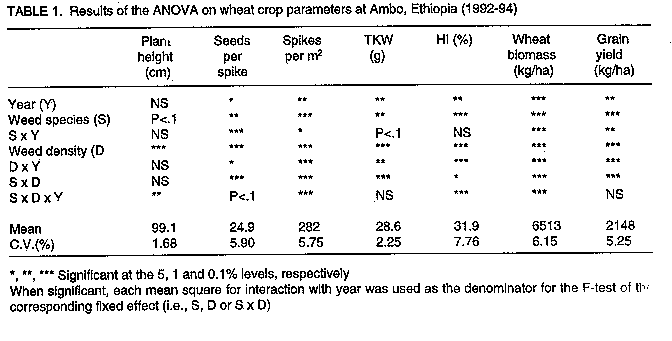
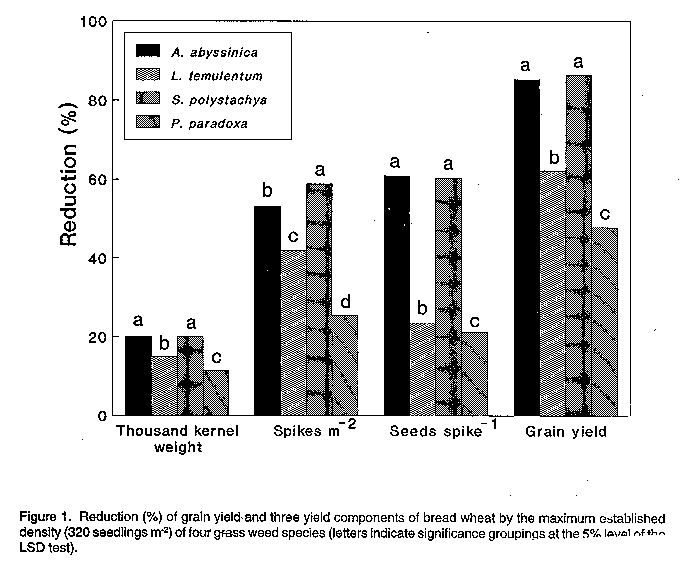
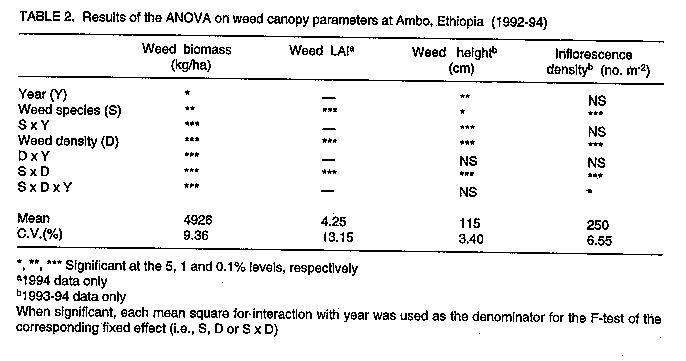
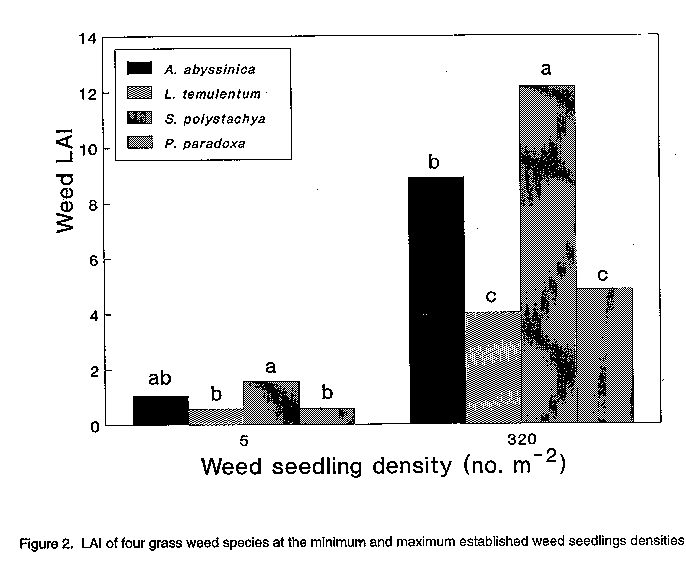
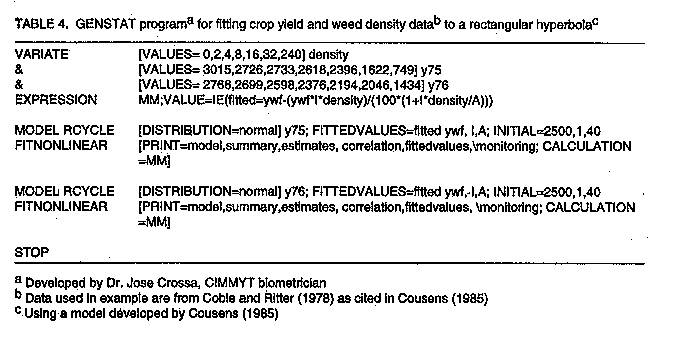
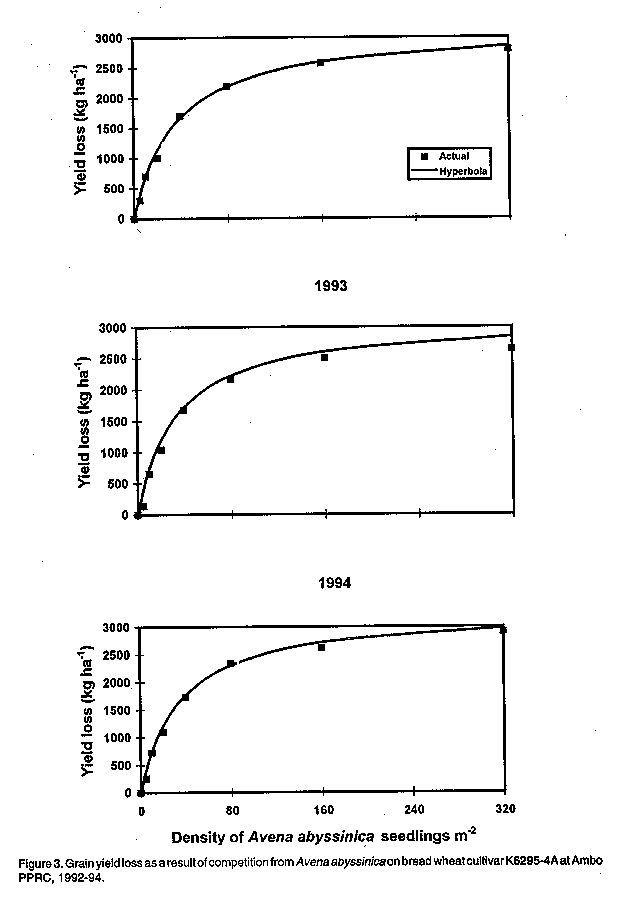
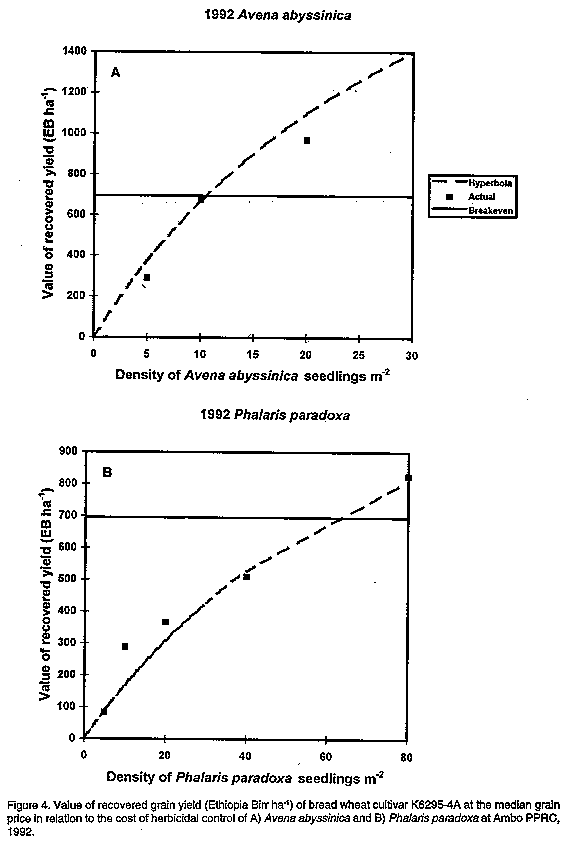
The results of the combined ANOVA for wheat crop parameters are presented in Table 1. In general, year effects and interactions between years, species and/or density effects were significant; such effects arose from slight relative differences in the magnitude of responses over seasons and not from shifts in treatment rankings (i.e., there were no crossovers). Thus, treatment main and interaction effects (i.e., fixed factors) exhibited high levels of significance based on the appropriate error terms (i.e., the respective interactions with year: a random factor). The four grass species differed significantly (Table 1) in their effects upon all measured crop parameters with the exception of plant height (P < .1); similarly, the species by density interaction effects were significant for all crop parameters except height. Aa and Sp depressed all wheat crop parameters to a greater extent than Lt and Pp; further, the rate of decline with increasing weed seedling density was greatest for Aa and Sp for each crop parameter. Effects on wheat yield components. The number of fertile wheat spikes m^-2 and the mean number of tillers per wheat plant decreased markedly as weed seedling density increased (data not shown). At a given weed density, the density of wheat spikes varied across weed species, suggesting a difference in the competitive abilities of the weed species. As illustrated in Fig. 1, the maximum reduction in wheat spike density (i.e., at 320 weed seedlings m^-2) followed the sequence of Sp (-59%) > Aa (-53%) > Lt (-42%) > Pp (-25%). Similar to the current results, Wilson and Peters (1982) indicated that A. fatua competition significantly reduced wheat tillering and fertile spike production. The effects of competition on the number of seeds per spike (SPS) and thousand kernel weight (TKW) also varied among the four weed species. The reductions in these two yield components due to Aa and Sp were similar and greater than the effect of Lt which, in turn, exceeded the effect of Pp (Fig. 1). Regarding SPS, the reductions at maximum weed density were 61, 60, 24 and 21% for Aa, Sp, Lt and Pp, respectively; the corresponding reductions in TKW were 20, 20, 15 and 11%. The effects of grass species and densities on wheat yield components were similar to the overall effects on grain yield, although each yield component was affected to a lesser extent than the resultant grain yield (Taye, 1995). The results suggest that the reduction in grain yield was primarily due to a decrease in productive spikes m^-2 and grains spike^-1, whereas TKW was much less affected (Fig. 1). In the literature, various reports on weed competition in wheat attributed yield reduction to decreases in spike numbers (Bell and Nalewaja, 1968; Cudney et al., 1989; Liebl and Worsham, 1984), spike length (Burrows and Olson, 1955), TKW (Bell and Nalewaja, 1968; Abdul Majid and Sandhu, 1984; Wilson and Peters, 1982), and the number of grains per spike (Wilson and Peters, 1982; Abdul Majid and Sandhu, 1984; Holzmann and Niemann, 1986). Wheat biomass, straw yield and harvest index were also significantly reduced by the competitive effects of the four grass species and by increasing weed density (Table 1). Researchers elsewhere reported decreased biomass and straw yield, harvest index and plant height of wheat as weed density increased (Wilson and Peters, 1982; Cudney et al., 1989; Wilson and Wright, 1990). In the current study, Sp (-78%) and Aa (-78%) reduced biomass yield > Lt (-56%) > Pp (-40%) at the maximum weed seedling density. For HI, the corresponding reductions were 38, 37, 13 and 12%, again demonstrating the greater competitive ability of Aa and Sp. Plant height. Plant height differed significantly among the four weed species (Table 2) and was probably a major factor in determining competitiveness. The height of wheat cv. K6295-4A was 102 cm under weed-free conditions in this study. By comparison, the maximum heights of the four grasses, exhibited under the lowest weed density of 5 seedlings m^-2, were 123 cm for Aa, 107 for Lt, 143 for Sp, and 105 for Pp; thus, the 2 most competitive grass weeds, Aa and Sp, were the tallest. At the maximum weed density of 320 seedlings m^-2, the four species exhibited reduced heights due to increased inter-plant competition: heights were 106 cm (-14%) for Aa, 100 (-7%) for Lt, 124 (-13%) for Sp and 92 (-12%) for Pp. Surprisingly, plant height was the sole wheat crop parameter not exhibiting a significant weed species by density interaction (Table 1); crop heights at 320 weed seedlings m^-2 were 93 cm (-8%) for Aa, 94 (-8%) for Lt, 93 (-9%) for Sp, and 97 (-5%) for Pp. Thus, crop height did not reflect weed competition to the same extent as the wheat yield components previously discussed. Leaf area index. Differences in LAI [(cm^2 leaf)/(cm^2 ground surface)] were observed among the four grass species and in response to the density of weeds sown per unit area (Table 2). The variation among the four weed species in reducing wheat LAI probably reflects differences in seedling growth rates, the inherent vigour of the weeds, and relative competitive abilities at early growth stages. The greatest weed LAI was consistently produced by Sp and the lowest by Lt (Fig. 2); no significant difference was observed between Lt and Pp at any seedling density. By contrast, the number of spikes m^-2 produced by Sp was significantly lower than Pp. In principle, a greater number of tillers m^-2 is expected to increase leaf area index. However, Sp, due to its broader and longer leaves, had a much greater individual leaf area which contributed to the difference in LAI. Similarly, Aa had wider and longer leaves in comparison to Lt and Pp. LAI is an important measure of potential photosynthetic area and, thus, of capacity for growth. The greater LAI of Sp and Aa, coupled with their taller stature, must have contributed to their greater competitive ability compared to Lt and Pp. Moreover, the leaf canopies of Sp and Aa appeared to be more effectively distributed for light interception than those of Lt and Pp. In their study of the competitive interactions of wheat and wild oat (A. fatua), Cudney et al. (1989) reported a linear decrease in wheat LAI and a corresponding increase in wild oat LAI associated with an increase in wild oat density. Grain yield of wheat. Competition effects on wheat grain yield varied with grass species and density and due to interaction among these two factors (Table 1). The lowest mean wheat yields were obtained under competition from Sp and Aa (Table 3). The lesser yield reduction by Pp could be due to its slow seedling growth rate (i.e., stem elongation of wheat occurred during the tillering stage of Pp). This probably favoured the associated wheat, giving it a competitive advantage over Pp. In addition, the lower LAI and shorter stature of Pp compared to the other three grasses contributed to its weak competitive ability. The greater seedling growth rates, LAI, plant vigour and statures of Sp and Aa, on the other hand, contributed to the significantly lower wheat yields obtained under competitive conditions. Lt exhibited rapid seedling growth like Sp and Aa, but exhibited lower LAI and plant height, reducing its competitive ability with wheat. Zimdahl (1980) noted that the success of the most vigorous weed competitors was attributable to early and uniform germination ability, and the development of a large leaf assimilation surface during early seedling stages. Wilson and Wright (1990) also reported differences in competitive ability among weed species, while Wilson (1986) reported that wheat yield responses were affected more by weed species than by weed density. In this study, the effects of weed densities on wheat grain yield were consistent and highly significant across the three years. Grain yield decreased from 3223 kg ha^-1 for the weed-free check to 951 kg ha^-1 at the highest weed density (Table 3). The highly significant weed species by density interaction indicated a difference in competitive ability among the four grasses at different density levels. As shown in Table 3, 10 seedlings m^-2 of Sp resulted in a yield reduction equivalent to 10 Aa, 20 Lt or 40 Pp seedlings m^-2. At the highest weed density, Sp, Aa, Lt and Pp reduced wheat grain yield by 86, 85, 62 and 48%, respectively (Table 3). Tanner et al. (1995) reported that the grain yield of wheat in Ethiopia was linearly proportional to the seedling density of A. fatua; yield reductions at 90 weed seedlings m^-2 ranged from 26 to 63% across four bread wheat cultivars. In the USA, 84 A. fatua seedlings m^-2 reduced wheat yields by 22% (Bell and Nalewaja, 1968). The grain yields reported in this paper included total wheat yield; maximum effort was made to reduce losses of small grains which would have been lost during mechanical harvesting or seed cleaning. TKW showed a significant decrease as the density of each grass weed species increased. Thus, actual yield losses from weed competition under field conditions would likely have exceeded those reported here. In some cases, small seed size reduces the market value of grain; thus, an additional financial loss due to weed competition could be incurred by farmers. Prediction of yield loss. Regression equations for the four grass weed species competing with wheat cv. K6295-4A were derived using the rectangular hyperbola model proposed by Cousens (1985). A sample program (with a dummy data set) written in GENSTAT to derive the parameters of the rectangular hyperbola is shown in Table 4. The rectangular hyperbola model resulted in a superior fit of the yield loss data and more accurate estimated economic threshold weed densities as compared to the square root model of Dew (1972) (Taye and Tanner, 1997). This model provides two parameters of importance in agronomic interpretation: "A", the maximum percent yield lost by wheat under competition from a specific weed species in a given year; "I", the percentage yield loss per unit of density as weed density approaches zero. From the current study (Table 5), the greater competitive ability of Aa and Sp with wheat is manifested in both a higher maximum yield loss (A) and a greater rate of yield loss per unit of weed density (I) than Lt; in turn, Lt is more competitive with wheat than is Pp. R2 values for the regression evaluations of the "goodness-of-fit" of the data to the rectangular hyperbola model ranged from 0.989 to 1.000 (Table 5), indicating an excellent fit for all data sets. Figure 3 presents a graphical comparison of the "goodness-of-fit" of the rectangular hyperbola model for Aa in all three seasons. For the purpose of comparison, actual yield losses have been superimposed on the curve generated by the hyperbolic model for each species-season combination; in each case, the actual points fall almost exactly on the lines generated by the hyperbolic model. Cousens (1985) reported that estimation of the parameter "A" is extremely sensitive to the distribution of weed densities; for example, if weed densities are in a geometric series, the yield at the highest density may have an undue influence on the estimate of "A". The high values of "A" estimated for Aa and Sp in 1994 (Table 5) may have reflected the geometric series used for weed density in the current study. Thus, future research conducted to generate data to be fitted to the hyperbolic model should use a density series combining a geometric and an arithmetic series, where density increases geometrically at first, but then increases arithmetically. Calculation of economic thresholds for weed control. The grain yield loss function developed in the previous section was subjected to sensitivity analyses to determine robust economic threshold levels for grass weed control recommendations, using the high efficacy herbicide fenoxaprop-P-ethyl (Table 6). Lt was omitted from this analyses since we lacked an adequate estimate of efficacy of herbicidal control. The value of the recovered grain yield (at the intermediate price level) predicted by the hyperbolic model as related to Aa and Pp seedling density in 1992 is displayed in Figure 4. Economic threshold weed densities occur at the point of intersection of the curve with the horizontal (weed control cost) line. Comparing the estimated and actual net returns to weed control for the Aa 1992 data set (Fig. 4a) at 20 Aa seedlings m^-2, the actual measured data exhibited a VR of 968 EB ha^-1 and an MRR of 278%. At the same density, the hyperbolic model over-estimated VR by 13.5%. At 10 s eedlings m^-2, the hyperbolic model under-estimated VR by only 0.6%. Figure 4a illustrates the relative closeness to the hyperbolic curve of the 1992 actual VR values for Aa control. Figure 4b illustrates that, for the less competitive weed species Pp, the economic threshold density was relatively high. Under practical field conditions in Ethiopia, one rarely encounters a wheat crop infested by a single grass weed species; thus, there is a need to estimate grass control threshold levels in fields with multiple species. It is biologically sound to assume that at low to moderate total grass weed densities the competition of the weed plants for growth resources is similar to the situation in the sole infestations (Wilson and Wright, 1990); only at higher weed densities will there be significant competition among the weed species. Thus, to estimate the effect of Puma S^R application to a mixed infestation of grass weeds in a crop stand of the cultivar K6295-4A on the value recovered in grain yield, one would sum the independent values of recovered grain associated with the control of each species. At high weed densities, this assumption will not hold true, but an estimate of yield loss (and recovery with weed control) can be based upon the specific density of the most competitive single weed species. REFERENCES Amanuel Gorfu, Tanner, D.G. and Asefa Taa. 1992. On-farm evaluation of pre- and post-emergence grass herbicides on bread wheat in Arsi Region of Ethiopia. In: The Seventh Regional Wheat Workshop for Eastern, Central and Southern Africa. Tanner, D.G. and Mwangi, W. (Eds.), pp. 330-337. CIMMYT, Nakuru, Kenya. Abdul Majid and Sandhu, G.R. 1984. Effects of Fumaria parviflora on yield and yield components of wheat. Pakistan Journal of Agricultural Research 5: 141-143. Auld, B.A., Menz, K.M. and Tisdell, C.A. 1987. Weed Control Economics. Academic Press Inc., London, UK. 287 pp. Bell, A.R. and Nalewaja, J.D. 1968. Competition of wild oat in wheat and barley. Weed Science 16:505-508. Birhanu Kinfe. 1985. Progress of weed management in wheat production in Ethiopia. In: Regional Wheat Workshop for Eastern, Central and Southern Africa and Indian Ocean. Njoro, Kenya. Sept. 2-5, 1985. pp. 95-102. CIMMYT, Nairobi, Kenya. Burrows, V.S. and Olson, P.J. 1955. Reaction of small grains to various densities of wild mustard and the results obtained after their removal with 2,4-D or by hand. I. Experiments with wheat. Canadian Journal of Agricultural Science 35:68-75. CIMMYT. 1988. From Agronomic Data to Farmer Recommendations: An Economics Training Manual. Completely revised edition. CIMMYT, Mexico, D.F. 79 pp. Cousens, R. 1985. A simple model relating yield loss to weed density. Annals of Applied Biology 107:239-252. Cudney, D.W., Jordan, L.S., Holt, J.S. and Reints, J.S. 1989. Competitive interactions of wheat (Triticum aestivum) and wild oats (Avena fatua) grown at different densities. Weed Science 37:538-543. Dew, D.A. 1972. An index of competition for estimating crop loss due to weeds. Canadian Journal of Plant Science 52:921-927. Holzmann, A. and Niemann, P. 1986. Effect of competition by Viola arvensis on the yield determining factors of spring wheat. In: Proceedings of the EWRS Symposium on Economic Weed Control. pp. 91-98. EWRS, Wageningen, Netherlands. Liebl, R.A. and Worsham, A.D. 1984. Annual ryegrass (Lolium multiflorum) interference in wheat. In: Proceedings of the Southern Weed Science Society, 37th Annual Meeting 1984. pp. 310. Southern Weed Science Society, Champaign, Illinois. Rezene Fessehaie. 1985. Review of weed science research activities in wheat and barley. In: A Review of Crop Protection Research in Ethiopia. Tsedeke Abate (Ed.), pp. 121-148. IAR, Addis Ababa, Ethiopia. Rezene Fessehaie, Tanner, D.G., Giref Sahile and Parker, C. 1990. The efficacy of various grass herbicides in bread wheat in the Ethiopian highlands. In: The Sixth Regional Wheat Workshop for Eastern, Central and Southern Africa. Tanner, D.G., van Ginkel, M. and Mwangi, W. (Eds.), pp. 140-145. CIMMYT, Mexico, D.F., Mexico. Scientific Phytopathological Laboratory (SPL). 1980. Progress Report for 1980. SPL, Ambo, Ethiopia. 177 pp. Tanner, D.G. and Giref Sahile. 1991. Weed control research conducted on wheat in Ethiopia. In: Wheat Research in Ethiopia: A Historical Perspective. Hailu Gebre-Mariam, Tanner, D.G. and Mengistu Hulluka (Eds.), pp.235-276. IAR/CIMMYT, Addis Ababa, Ethiopia. Tanner, D.G., Giref Sahile and Workiye Tilahun. 1995. Competitive ability of Ethiopian spring bread wheat cultivars with Avena fatua L. African Crop Science Journal 3:83-91. Taye Tessema. 1995. Competition Effects of Selected Grass Weeds on Yield and Yield Components of Wheat (Triticum aestivum L.). M.Sc. Thesis. Alemaya University of Agriculture, Alemaya, Ethiopia. 114 pp. Taye Tessema, Tanner, D.G. and Mengistu Hulluka. 1996a. Grass weed competition with bread wheat in Ethiopia: I. Effects on selected crop and weed vegetative parameters and yield components. African Crop Science Journal 4:399-409. Taye Tessema, Tanner, D.G. and Mohammed Hassena. 1996b. Grass weed competition with bread wheat in Ethiopia: II. Prediction of grain yield loss and implications for economic weed control. African Crop Science Journal 4:411-421. Taye Tessema and Tanner, D.G. 1997. A comparison of two models for relating wheat yield loss to weed density: Differences in calculated economic weed control thresholds. In: Sebil, Proceedings of the Eighth Conference of the Crop Science Society of Ethiopia. 26-27 February, 1997, Addis Ababa, Ethiopia. In press. Wilson, B.J. 1986. Yield response of winter cereals to the control of broadleaved weeds. In: Proceedings of the EWRS Symposium on Economic Weed Control. pp. 75-82. EWRS, Wageningen, Netherlands. Wilson, B.J., Cousens, R. and Wright, K.J. 1990. The response of spring barley and winter wheat to Avena fatua population density. Annals of Applied Biology 116:601-609. Wilson, B.J. and Peters, N.C.B. 1982. Studies of competition between Avena fatua and spring barley. I. Influence of Avena fatua on yield of barley. Weed Research 22:143-148. Wilson, B.J. and Wright, K.J. 1990. Predicting the growth and competitive effects of annual weeds in wheat. Weed Research 30:201-211. Zimdahl, R.L. 1980. Weed-Crop Competition: A Review. International Plant Protection Center, Oregon State University, Corvallis, Oregon. 196 pp.
Copyright 1997, African Crop Science Society The following images related to this document are available:Line drawing images[cs97043i.gif] [cs97043c.gif] [cs97043d.gif] [cs97043f.gif] [cs97043g.gif] [cs97043h.gif] [cs97043j.gif] [cs97043e.gif] [cs97043a.gif] [cs97043b.gif] |
| |||||||||
