 |
| About Bioline | All Journals | Testimonials | Membership | News |
|
||||||
|
||||||
African Crop Science Journal, Vol. 6. No. 4, pp. 385-396,
1998 Assessment Of Cassava Genotypes For Resistance To Cassava Mosaic Disease, Cassava Bacterial Blight And Cassava Green Mite At A Lowland And Mid-Altitude Site In Nigeria S.O. AKPAROBI, A.O. TOGUN1 and I.J. EKANAYAKE2 Delta State University, Asaba Campus, Asaba Delta State,
Nigeria (Received 11 July, 1997; accepted 23 April, 1998)
Code Number:CS98041
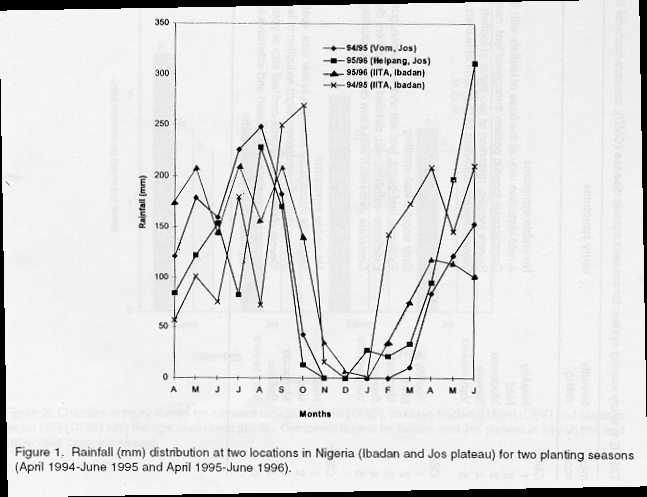
ABSTRACT Twelve cassava genotypes were evaluated in the field in two cropping seasons at two locations in Nigeria for their reaction to cassava mosaic disease (CMD), cassava bacterial blight (CBB) and cassava green mite (CGM), using visual injury scores as the index for resistance. Lowest indices for CMD were recorded at mid-altitude and were significantly different from lowland savanna indices. The highest injury scores for CMD, CBB and CGM were recorded 9 months after planting (MAP) which coincided with the dry period at both locations. TMS 30001 and TME1 showed resistance to CMD while TMS 30001, TMS 30572 and TMS 91934 were the most resistant to CBB. TME1, TMS 91934, TMS 30572 and TMS 50395 were moderately resistant to CGM. Leaf area and root yield of genotypes grown at the lowland site were higher than at mid-altitude. Genotypes with least leaf area and root yield had the highest injury scores for CMD and CBB in both locations. There was a significant positive correlation between CBB and CGM while a negative correlation was observed between root yield and CMD. Results suggest that selection for resistance to CBB may help breeders to develop cultivars resistant to CGM, and that CMD causes serious loss in cassava yields. Key Words: CBB, CGM, CMD, injury, mid-altitude, pest, resistance, root yieldRÉSUMÉ Douze génotypes de manioc ont été évalués au champ pendant deux saisons culturales et sur deux sites au Nigéria pour évaluer leur réaction au virus de la mosaque du manioc (CMD), à la bactériose (CBB) et à l'acarien vert du manioc (CGM) selon une échelle de notation visuelle basée sur le degré de dégât comme indice de résistance. Les indices les plus faibles pour le CMD, la CBB et le CGM ont été enregistrées neuf mois après la plantation (MAP), ce qui coïncidait avec la période la plus sèche pour les deux sites. TMS 30001 et TME 1 ont présenté une résistance au CMD, alors que TMS 30001, TMS 30572 et TMS 91934 étaient les plus résistants à la CBB. TME1, TMS 91934, TMS 30572 et TMS 50395 ont montré une résistance modérée au CGM. La superficie foliaire et le rendement en racines des génotypes plantés dans les terres basses étaient supérieurs à ceux des génotypes implantés dans les sites d'altitude moyenne. Les génotypes aux faibles superficies foliaires et rendements en racines, présentaient les notes les plus élevées en termes de dégâts pour le CMD et la CBB dans les deux types de sites. Il y avait une corrélation positive significative entre la CBB et le CGM, tandis que cette corrélation était négative entre le rendement en racines et le CMD en 1994 et 1995 respectivement. Ces résultats suggèrent que la sélection pour la résistance à la CBB pourrait permettre de réaliser des progrès génétiques en matière de résistance au CGM et que le CMD cause de sérieuses pertes de rendement chez le manioc. Mots Clés: CBB, CGM, CMD, altitude moyenne, résistance, rendement en racines, ravageur, dégât INTRODUCTION Cassava (Manihot esculenta Crantz) is the seventh most important crop of the world and constitutes a staple food for an estimated 800 million people, one-eighth of the world population (CIAT, 1993; Nweke, 1996). Diseases and pests perhaps constitute greatest constraints to cassava production in Africa (Theiberge, 1985), causing an estimated 50% root yield reductions. The yield losses vary with pests and diseases, and the prevailing climatic conditions (Yaninek, 1994). Of the diseases that attack cassava, Cassava Mosaic Disease (CMD) and Cassava Bacterial Blight (CBB) are the most important while Cassava Green Mite (CGM) is among the most important arthropod pests (Yaninek, 1994). Yield losses for individual susceptible cultivars due to CMD range from 20 to 90% (Thresh and Otim-Nape, 1994). Losses of 90-100% have been reported on CBB susceptible varieties in Uganda (Otim-Nape, 1980) and 75% in Nigeria (Hahn et al., 1989). The causal agents of CMD and CBB are Geminiviruses of the family Geminiviridae (Sub-family III) transmitted by the whitefly (Bemisia tabaci Genn.) and Xanthomonas campestris pv. manihoti, respectively. These diseases and the CGM (Mononychellus tanajoa Bondar (Acari: Tetranychidae) have been studied in detail with a view to developing and selecting high yielding cultivars (Pillai et al., 1983; Thresh and Otim-Nape, 1994; Fargette et al., 1996). Many workers have demonstrated that CBB is largely spread by the use of infected cuttings (Theiberge, 1985; Hahn et al., 1989; Yaninek, 1994). The bacterium invades young tissues causing wilting, defoliation and tip dieback. Symptoms of CMD include reduced leaf size which are distorted and chlorotic bands. Cassava green mite mainly damages upper young leaves and causes reduction in leaf size, defoliation and Acandlestick@ symptoms on young shoots when heavily attacked (Anonymous, 1979; Hahn et al., 1989; Rossel et al., 1994). Reduction in leaf area as high as 95% due to CGM have been reported by Hahn et al. (1980). In Nigeria, cassava production has been seriously threatened by CBB, CGM and CMD, and different methods have been used to control these pests and diseases. These include cultural practices (Akinlosotu, 1982), use of resistant cultivars (Atu and Okeke, 1981), biological control (Yaninek, 1994), and breeding for resistance (Hahn et al., 1980). Of these measures, the use of resistant cultivars and biological control offer a more permanent, sustainable and safe control of the pests (Yaninek, 1994). The stability in yields of agronomically desirable and commercially acceptable cultivars is the ultimate goal in cassava improvement and a pre-requisite in achieving sustainability. One way to ensure this is to select cultivars with adequate levels of resistance to diseases and pests. The objective of this study was to identify cassava genotypes that show low levels of damage by CMD, CBB and CGM in the mid-altitude agro-ecological zone relative to the lowland savanna zone of Nigeria. MATERIALS AND METHODS The experiments were conducted in Nigeria at sites on the Jos plateau (mid altitude) and at Ibadan (lowland savanna zone). Experiments were conducted during 1994/95 and 1995/96 crop seasons at the International Institute of Tropical Agriculture (IITA), Ibadan and National Root Crop Research Institute field stations (Vom and Heipang) in Jos plateau. In the 1994/95 season, cassava stem cuttings were planted on May 5, and May 13, at Ibadan and Jos, respectively, while in 1995/96, planting was on May 10, and May 20, respectively, at Ibadan and Jos. These two locations represent contrasting agroecological zones: Ibadan (altitude: 210 metres above sea level (masl), relative humidity 65-90%, latitude 4° 46'N, longitude 2° 34'E, mean temperature 28± 6° C, annual rainfall 1545mm) and Jos plateau (a) Vom: altitude: 1280 masl, latitude 9° 55'N, longitude 9° E, relative humidity 55-85%, annual rainfall 1099mm, mean temperature 18± 5° C; (b) Heipang: altitude 1290 masl, latitude 9° 38'N, longitude 8° 9'E, relative humidity 60-85%, mean temperature 18± 6° C, annual rainfall 1153mm). The soil at Ibadan is classified in the Oxic Paleuestalf, Alagba series (Greenland, 1991) while in Jos Plateau the soil is Ferruginous tropical soils (Kowal and Knabe, 1972). The rainfall distribution for the study period is presented in Figure 1. Figure 1: Rainfall (mm) distribution at two locations in Nigeria for two planting seasons. Experimental design. Twelve cassava genotypes were used, i.e., six improved IITA genotypes: TMS 30001, TMS 91934, TMS 492 1425, TMS 30572, TMS 50395, TMS 30555; four landraces (local genotypes) commonly grown in southwestern Nigeria: TME1, TME2, Isunikankiyan and Oko-Iyawo; and two landraces (local genotypes adapted to mid-altitudes: Danduala and Danwaru). Disease/pest free cassava stem cuttings of 20cm length were obtained from 12 month-old mother plants at the middle part of the stem. The stem cuttings were immersed in 0.05% solution of the fungicide benlate (a.i. = methyl 1-(butyl carbatomyl)-2-benzimidazole carbamate) to enhance the health status of the planting materials. The experiments were set up in each location in a randomised complete block design with three replications. Each plot had 6 rows, 10 m long with a spacing of 1 m between rows and 0.8 m within a row. Each plot contained 72 plants. Fields were kept weed-free by regular hand-weeding. Data collection and analyses. Evaluation of the genotypes for resistance to CMD, CBB and CGM in the field was based on the injury done to each genotype by each pest or disease. Disease severities for CMD and CBB were scored visually basing on a scale of 1-5 per individual plant (Table 1) (Hahn et al., 1989; Yaninek, 1994). Assessment of CGM damage was on the top 5 fully expanded leaves. Disease and pest assessments were done 3, 6, 9 and 12 MAP in both locations, which coincided with the various seasons; rain, dry and dry-rainy transition periods. The data on plant damage were collected on the four middle rows per plot which at maturity were used for yield data. TABLE 1. Injury scoring system for cassava mosaic disease (CMD), cassava bacterial blight (CBB), cassava green mite (CGM) according to Hahn et al, (1989)
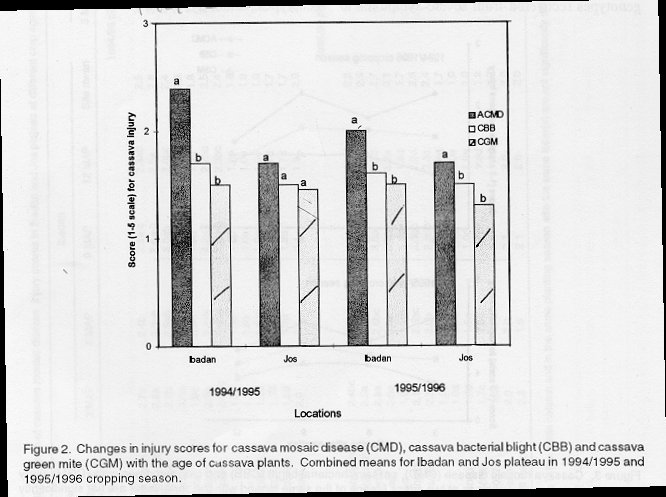
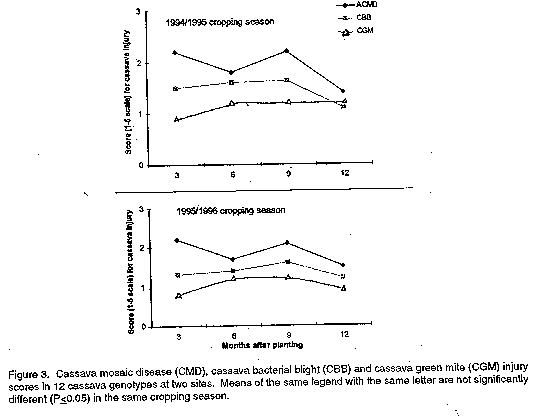
Harvesting was done 12 MAP when tuberous root dry weights were recorded. Also, at 12 MAP, leaf area was measured using a leaf area meter (Model LI-3000, LI-COR, U.S.A.). Statistical analyses were done on injury scores, leaf area and tuberous root dry weight. The general linear model (GLM) procedure of the Statistical Analysis System (SAS, 1985) was used for analyses of variances. Differences between treatment means were compared by Least Significant Difference LSD) Test at P=0.05. RESULTS Rainfall during the crop growth period was highest in both locations 6 and 12 MAP (Fig. 1). During the rainy season many plants recovered; however, the highest injury scores were recorded at 9 MAP at both locations (Fig. 2). Figure 2: Changes in injury scores for cassava misaic disease (CMD), cssava bacterial blight (CBB) and cassava green mite (CGM) with the age of cassava plants. Figure 3: Cassava mosaic disease, cassava bacterial blight and cassava green mite injury scores in 12 cassava genotypes at two sites. The injury scores differed significantly (P<0.05) between the two agroecological zones. Highest overall injury scores for CMD, CBB and CGM occurred at Ibadan (Fig. 3) but varied with genotype. TMS 30001 and TME1 consistently scored lowest for CMD at both locations, while TMS 30572, TME2, TMS 50395 and Oko-Iyawo showed moderate resistance to CMD; Danduala was susceptible to CMD in both locations (Table 2). TABLE 2. Mean of cassava mosaic disease injury scores in Ibadan and Jos plateau at different crop ages in 1994/95 and 1995/96 planting seasons
Means in the same column and in the same planting season with the same letter(s) are not significantly different at P£ 0.05; MAP = months after planting TMS 30001 and TMS 30572 were most resistant to CBB while TMS 91934 and TMS 50395 consistently recorded mild injury scores for the disease (Table 3). For CGM, most of the genotypes were unaffected. The incidence of CGM damage was low at both locations during the two seasons, except for a slight increase during the dry season (9 MAP) for some genotypes (Table 4). TABLE 3. Mean 0f Cassava bacterial blight injury scores for different genotypes at Ibadan and Jos plateau sites at different crop ages in 1994/95 and 1995/96 planting seasons
Means in the same column and in the same planting season with the same letter(s) are not significantly different at P£ 0.05; MAP = months after planting TABLE 4. Mean of Cassava green mite injury scores for different genotypes at Ibadan and Jos plateau sites at different crop ages in 1994/95 and 1995/96 planting seasons
Means in the same column and in the same planting season with the same letter(s) are not significantly different at P£ 0.05; MAP = months after planting Leaf area and dry tuberous root yield at 12 MAP (Table 5) were higher at Ibadan than at Jos Plateau. Genotypes which showed significant leaf area and root yield reductions had the highest injury scores for CMD and CBB in both locations (Table 5). The positive correlation between CBB vs CGM (r = 0.40*, n = 24); and negative coefficient for dry tuberous root weight vs CMD (r = 0.68*, n = 24) were significant (Table 6). TABLE 5. Mean values of dry tuberous root yield and leaf area at different injury scores for cassava genotypes in 1994/95 and 1995/96 planting seasons at Ibadan and Jos plateau
Means in the same column and in the same planting season with the came letter(s) are not significantly different at P£ 0.05; MAP = months after planting; ACMD = African cassava mosaic disease; CBB = Cassava bacterial blight; CGM = Cassava green mite TABLE 6. Correlation coefficients among dry root weights, cassava mosaic disease (CMD), cassava bacterial blight (CBB) and cassava green mite (CGM) scores across locations and years
*Significantly different at P£ 0.05, n=24. CMD = Cassava mosaic disease; CBB = Cassava bacterial blight; and CGM = Cassava green mite DISCUSSION The lower injury scores for CMD, CBB and CGM in cassava genotypes grown at Jos than those at Ibadan provide additional evidence of the significance of interactions between location and cultivar on pest and disease infestation in cassava. Differences in disease development at Ibadan and Jos plateau were attributable to higher concentration of disease inoculum and pests in the surrounding cassava fields at Ibadan where field testing of breeders' selections are being carried out. The CMD disease scores fluctuated with sampling time in both locations. During the rainy seasons (6 MAP and 12 MAP), most of the genotypes recovered from severe symptoms to little or no symptoms. Similar observations were made by Rossel et al. (1994) who reported that initially diseased cassava genotypes, in particular those resistant to CMV, in the absence of the whitefly vector, were observed to largely out-grow the disease. The high injury scores observed in some genotypes 9 MAP coincided with the dry season which suggests an influence of environmental conditions, particularly rainfall, on CMV. Rain tends to enhance plant vigour and hence reduces pest and disease attack depending on the level of host resistance to the pathogen/pest. Contrastingly, resistance may be lowered when cassava plants are growing under conditions of severe water stress (Yaninek, 1994). The injury scores varied between dates. Hence, genotypes that consistently had mild injury scores over time and locations can be regarded as resistant. TMS 30001 and TME1 were the most resistant to CMD while TMS 30001, TMS 30572 and TMS 91934 were more resistant to CBB than the other genotypes. Similarly, TME1, TMS 30001, TMS 91934, TMS 30572 and TMS 50395 can be described as moderately resistant to CGM, although there was little damage of CGM at both locations. Differences in resistance of cassava cultivars to some pests and diseases have been reported by Hahn et al. (1989) and Rossel et al. (1994). Variations in reactions of cassava genotypes between the two cropping seasons further reflected the non-uniform pest infestation, since genotypes were exposed only to natural disease and pest pressure. Greater discrimination among the genotypes could probably have been achieved under more intense pressure achieved by artificially introduced inocula. A knowledge of relationships among CMD, CBB and CGM damage to plants provides basic information for understanding genotype performance under different agro-ecological zones, and whether improvement of one character will result in simultaneous change in another character through inter-character correlation. This study showed a positive significant correlation between CGM and CBB (r = 0.40*, n = 24), which supports earlier reports of Hahn et al. (1989) that significant genotypic correlation exist between resistance to pest and diseases. Where this relationship is true, selection for resistance to either the disease or pest in cassava improvement programme may lead to genetic progress in resistance to any one of them. The negative correlation between dry tuberous root yield and CMD symptom scores indicates that CMD causes a reduction in leaf area and dry tuberous root yield, as was demonstrated by Hahn et al. (1989). CONCLUSIONS The results of this study have shown that the impact of CGM, CMD and CBB on cassava can be reduced significantly in Jos plateau (mid-altitude) by the use of resistant genotypes. TME1, TMS 30001 and TMS 30572 were more resistant to CMD, CBB and CGM as compared to the other genotypes. The strong relationship between CBB and CGM suggests that selection for resistance to either of the two in a cassava improvement programme may lead perhaps to genetic progress in resistance to the other. Cassava genotypes with the highest mean injury scores at both locations had a significant reduction in leaf area. The significant negative correlation between dry root weights and CMD imply that severe attack of CMD could result in cassava yield reductions. ACKNOWLEDGEMENTS This study was financed by the International Institute of Tropical Agriculture (IITA). Mr. Charles Agbi and Dr. K.C. Okonkwo of National Root Crops Research Institute Station at Vom, Jos plateau assisted with the comments and field work. Suggestions made on the draft manuscript by Prof. T. Ikotun of University of Ibadan, Ibadan, Nigeria are gratefully acknowledged. REFERENCES
Copyright 1998, African Crop Science Society The following images related to this document are available:Photo images[cs98041b.jpg]Line drawing images[cs98041c.gif] [cs98041a.gif] | |||||||||||||||||||||||||||||||||||||||||||||||||||||||||||||||||||||||||||||||||||||||||||||||||||||||||||||||||||||||||||||||||||||||||||||||||||||||||||||||||||||||||||||||||||||||||||||||||||||||||||||||||||||||||||||||||||||||||||||||||||||||||||||||||||||||||||||||||||||||||||||||||||||||||||||||||||||||||||||||||||||||||||||||||||||||||||||||||||||||||||||||||||||||||||||||||||||||||||||||||||||||||||||||||||||||||||||||||||||||||||||||||||||||||||||||||||||||||||||||||||||||||||||||||||||||||||||||||||||||||||||||||||||||||||||||||||||||||||||||||||||||||||||||||||||||||||||||||||||||||||||||||||||||||||||||||||||||||||||||||||||||||||||||||||||||||||||||||||||||||||||||||||||||||||||||||||||||||||||||||||||||||||||||||||||||||||||||||||||||||||||||||||||||||||||||||||||||||||||||||||||||||||||||||||||||||||||||||||||||||||||||||||||||||||||||||||||||||||||||||||||||||||||||||||||||||||||||||||||||||||||||||||||||||||||||||||||||||||||||||||||||||||||||||||||||||||||||||||||||
| |||||||||
