 |
| About Bioline | All Journals | Testimonials | Membership | News |
|
||||||
|
||||||
Copyright 1999, African Crop Science Society $endtext $PAGE $keyword journal $keyword 1999 $keyword v7n1 $keyword march $keyword CS990 $title <$web> $endtitle $text African Crop Science Journal, Agro-Ecological Decision Support Systems For Wheat Improvement In Ethiopia: Climatic Characterisation And Clustering Of Wheat Growing Regions BELAY SIMANE, D.G. TANNER1, AMSAL TAREKEGNE2 and ASEFA TAA3 Department of Plant Sciences, Alemaya University of
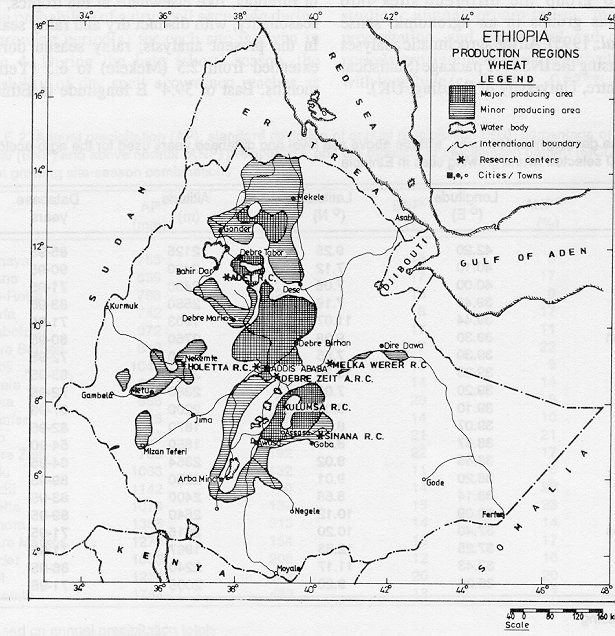
Agriculture, P.O. Box 138, Dire Dawa, Ethiopia (Received 6 October, 1998; accepted 25 February, 1999) Code Number: CS99002 ABSTRACT Wheat production environments in Ethiopia are highly heterogeneous with respect to natural resource characteristics, cropping systems, biotic and abiotic constraints. This paper analyses the agro-climatic resources of 20 representative wheat growing sites in the country and groups them by cluster analysis to develop homogeneous environmental groupings for wheat improvement research. The wheat growing sites are defined and clustered based on precipitation, temperature, altitude, longitude, and length of growing season. Annual precipitation decreases along a west-east axis, ranging from 1784 to 585 mm. The major feature of the precipitation pattern is its seasonality with distinct dry and rainy seasons. Generally, rainy season duration extends from 2.5 to 6.5 months. In the western, central and northern parts of the country, rainfall distribution is generally monomodal. In the eastern part of the country (i.e., 39.4 to 42.5° E) the distribution is bimodal, resulting in two cropping seasons, viz. "belg" (short) and "meher" (main). Of the parameters studied, annual and main season precipitation, and length and end of growing period were negatively correlated with longitude (r = -0.73**, -0.82**, -0.64** and -0.43*). Altitude was negatively correlated only with maximum and minimum temperatures (r = -0.64** and -0.86**). Three main environmental groups (C1, Western; C2, High Altitude; C3, Eastern) and six subgroups (C1-1, C1-2, C2, C3-1, C3-2, C3-3) were identified in the cluster analysis. Such clustering into homogeneous environmental groups should assist the national wheat improvement programme in making decisions about test site selection and proper targeting of released varieties. Key Words: Agroclimatic analysis, environmental characterisation, Triticum aestivum RÉSUMÉ En Ethiopie, les agro-écosystèmes où se cultive le blé sont très hétérogènes quant aux caractéristiques environnementales, les systèmes de culture et les contraintes biotiques et abiotiques. Cet article fait une analyse des ressources agroclimatiques de 20 sites représentatifs du pays de culture du blé et les classent à l'aide de l'analyse factorielle, afin d'établir des groupements d'agro-écosystèmes homogènes pour la recherche en amélioration du blé. Les sites de culture de blé sont définis et groupés en fonction des précipitations, des températures, de l'altitude, de la longitude et de la longueur de la période de croissance. Les précipitations annuelles diminuent le long de l'axe west-est, allant de 1784 à 585 mm. La caractéristique principale du profil de précipitations est son rythme saisonnier avec saisons sèches et saisons des pluies bien distinctes. Généralement, la durée de la saison des pluies va de 2.5 à 6.6 mois. Dans les parties occidentales, centrales et nord du pays, la distribution des pluies est en général monomodale. Dans la partie est du pays (ex.: 39.4 à 2.5° E), la distribution est bimodale, se manifestant par deux saisons de cultures, viz "belg" (courte) et "mecher" (principale). Des paramètres étudiés, les précipitations de la saison la plus importante et les précipitations annuelles, la durée et la date de la fin de la période de croissance, étaient corrélées de manière négative avec la longitude (r = -0.73**, -0.82**, -0.64** et -0.43*). L'altitude était négativement corrélée uniquement avec les températures maximales et minimales (r = -0.64** et -0.86**). Trois principaux groupes environnementaux et 6 sous-groupes ont été identifiés par l'analyse factorielle. Telle classification en groupes d'agro-écosystèmes homogènes devrait aider les programmes nationaux d'amélioration du blé à prendre des décisions sur les sites de sélection et à mieux cibler les variétés mises sur le marché. Mots Clés: Analyse agro-climatique, blé, caractérisation environnementales, Triticum aestivum xxxx INTRODUCTION Ethiopia possesses the second largest area of wheat (Triticum spp.) in the sub-Saharan region of Africa (ca. 884,000 ha) after South Africa (CIMMYT, 1996). Both bread (T. aestivum) and durum (T. turgidum var. durum) wheats are important food crops in Ethiopia (Hailu, 1991): about 85% of bread wheat is grown in Arsi, Bale and Shewa regions, whereas durum is produced predominantly on the Vertisols of the central and north-western highlands of the country (i.e., Shewa, Gojam, Gonder and Tigray regions). The mean national wheat yield is very low, averaging 1.4 t ha-1 over the 1993-95 period (CIMMYT, 1996), and contrasts markedly with the yield levels reported on experimental fields (>5 t ha-1) (Hailu, 1991). The major causes of the low mean national yield include weather variability, environmental degradation, use of unimproved local varieties, traditional crop management practices, and policy-related socio-economic constraints (Bekele et al., 1994). Furthermore, many of the soils on which wheat has traditionally been grown are poor quality in terms of physical structure and chemical fertility (Eylachew, 1994). Farmers' current production practices (i.e., excessive tillage and minimal use of legume-based crop rotations and inorganic fertiliser) contribute to soil degradation and declining crop production. However, the Ethiopian highlands have a high agricultural potential if appropriate crop production and natural resource conservation measures are implemented. During the 1995 and 1996 cropping seasons, food production has been at historically high levels due to favourable rainfall amount and distribution, and the utilisation of recommended agronomic technologies (FAO/WFP, 1996). Wheat is grown in Ethiopia exclusively under rainfed conditions within the varied highland agro-ecologies of the country (Fig. 1). The natural resource base and the respective constraints in these agro-ecologies are extremely heterogeneous (Hailu, 1991). To reduce the food deficit in semi-arid zones, attention should be focussed on efficient water management and utilisation. The definition of an effective starting date and duration of the growing season, and the quantification of dry periods during the growing season represent important management tools in dryland farming areas (Belay et al., 1994). No detailed studies have previously addressed these climatic issues in Ethiopia. Other factors detrimentally affecting wheat production in Vertisol zones, such as transient waterlogging, also require mitigating measures. This study was conducted to characterise the climates of the major wheat growing regions of Ethiopia:
Figure 1: Wheat production regions in Ethiopia. MATERIALS AND METHODS Climatic characteristics were assessed for 20 sites distributed throughout Ethiopia which were selected to represent the major wheat growing regions of the country. Selected sites had a complete set of multi-year meteorological data and geographic descriptors (Table 1). The 20 sites studied extended from 37.25 to 42.2° E longitude, from 7.05 to 13.3° N latitude, and from 1850 to 2750 m a.s.l. altitude (Table 1). Daily rainfall, and minimum and maximum temperatures across the maximum number of years available, were collected from specific research stations and from the National Meteorological Service in Addis Ababa. Soil parameters were collected from published (Eylachew, 1994) and unpublished data sources. For each soil, the plant available soil moisture reserve (on a volume/volume basis) was defined as the difference between moisture content at field capacity and that at the permanent wilting point: an effective rooting zone of 1.0 in depth was assumed for all sites; bulk density varied from 1.1 to 1.2 across sites. TABLE 1. The geographical locations, altitude above sea level and database years used for the agro-ecological analysis of 20 selected wheat growing sites in Ethiopia
* 1989-93 missing "Normal" annual precipitation for a given location was defined as annual precipitation within one standard deviation (SD) unit of the long-term mean for that location. Above normal precipitation and below normal precipitation years exhibited total annual precipitation amounts greater or less than 1.0 SD unit above or below the long-term mean, respectively. In view of rainfall variability, climatic analyses were based on the dependable growing period, which is the minimum growing period that can be expected in three out of four years. The start of the growing season was defined as the first occasion when the available soil moisture content exceeded 40% (approx. 50 mm) of field capacity and when 10 day cummulative precipitation exceeded 50% of potential evapotranspiration. The end of the growing season was defined as the date when available soil moisture content dropped below 10% of field capacity. The length of the growing period was calculated as the difference between the start and end of the season. Based on rainfall patterns and available soil moisture, sites were categorised as having single or double growing periods. A dry spell was defined as <2 mm of daily rainfall for more than 15 consecutive days during the growing period. Correlation coefficient analysis was used to assess the spatial association of environmental variables across the study sites. Rainfall amount and distribution, and temperature data were regressed on an individual basis against geophysical settings to establish baseline information for the classification of wheat growing regions into homogeneous agro-ecologies. In addition, we used the clustering procedure available in the Statistical Analysis System (SAS) package to group the different sites into homogeneous groups in an agronomic sense (Ouyang et al., 1995). All the agroclimatic analyses were done using the INSTAT package (Statistical Service Centre, University of Reading, UK). RESULTS The long-term mean annual precipitation calculated for each of the 20 sites ranged from 585 mm (Mekele) to 1,784 mm (Nekemte) (Table 2). Annual precipitation exhibited variability over time and space; the variability was more pronounced in the drier eastern and northern regions. The standard deviation of annual precipitation varied from 96 (Sinana) to 483 (Nekemte). However, the time series analysis of individual sites did not reveal a clear trend of repeating events. The probability of receiving below normal precipitation varied from 7% of years (Debre Berhan) to 22% (Debre Zeit), whereas above normal precipitation was expected from 0% (Bale-Robe) to 29% (Ginchi) of years (Table 2). TABLE 2. Annual precipitation (AP), standard deviation of annual precipitation (SD), percentage of years below normal (BNP) and above normal (ANP) precipitation, and the modality of precipitation pattern (MOD) of selected wheat growing site-season combinations
a Based on annual precipitation totalsb First (belg) season is too short for crop production A major feature of rainfall pattern or distribution in Ethiopia, like elsewhere in the tropics, is its seasonality, with distinct dry and rainy seasons. In the present analysis, rainy season duration extended from 2.5 (Mekele) to 6.5 (Yetnora) months. East of 39.4° E longitude in Ethiopia, rainfall distribution is bimodal, allowing two cropping seasons, viz. "belg" (short) and "meher" (long), whereas in the central, northern and western regions distribution is generally monomodal. Data for the effective start, end and length of the growing seasons for each location are given in Table 3. In the eastern highlands, the belg season starts from late March (Sinana) to early April (Alemaya), and continues until mid June (Agarfa) to mid July (Bale-Robe). At Alemaya and Bale-Robe, the short rainy season merges with the main season in 30 and 40% of the years, respectively. The length of the meher (main) season ranges from 84 days (Mekele) to 217 days (Nekemte). Effective meher planting can begin from early May (Bekoji, Akaki, Ginchi, Yetnora, Nekemte) to early August (Bale-Robe, Sinana). The end of the growing period is also variable, ranging from the first week of October (Mekele) to the end of December (Sinana). The probability of a dry spell occurring during the growing period(s) for each site is given in Table 4. During the belg (short) season, the probability of dry spell occurrence reaches as high as 25% (at Agarfa in June). Dry spell probability during the meher (main) season is particularly high at the end of the season, peaking up to 100% at some sites during October. The most severely restricted site is Mekele, experiencing dry spells in July, September and October (23, 55 and 100% probability, respectively). For the majority of the regions, October is the beginning of the dry season with the exception of Sinana and Bale-Robe. TABLE 3. The effective and dependable start (STR), end (END) and length of the growing period (LGP) for the selected wheat growing sites
* Frequency of first and second seasons merging (i.e., no dry
spell separating the two rainy seasons) TABLE 4. Probability of dry spells during the effective growing seasons for the selected wheat growing sites
*First season not important The environmental variables that were used for correlation analysis were longitude (LON), latitude (LAT), altitude (ALT), annual precipitation (ANP), modality of precipitation distribution (MOD), main season precipitation (MSP), length of growing season (LGS), start of growing season (SGS), end of growing season (EGS), minimum temperature (Tmn), and maximum temperature (Tmx). The results of the correlation coefficient analysis are presented in Table 5. Of the parameters studied, annual precipitation, main season precipitation, and length and end of growing period were significantly and negatively correlated with longitude (r = -0.73**, -0.82**, -0.64** and -0.43*, respectively). The modality of precipitation distribution is positively correlated with longitude (0.67**). On the other hand, altitude is negatively correlated only with maximum and minimum temperatures (r = -0.64** and -0.86**, respectively). Annual precipitation correlated positively with main season precipitation, length of the growing period, and end of the growing period (r = 0.96**, 0.77** and 0.44*, respectively). Among the climatic data and geographic descriptors studied, longitude, altitude, annual precipitation total and distribution, length of the growing period, and seasonal precipitation were found to be important for clustering the 20 sites into homogeneous agro-ecological environments. Cluster analysis produced several classes at different levels (Fig. 2; Table 6). Comparing the pseudo F and R2 values, a grouping of three major classes and six minor classes best explained the wheat growing regions of Ethiopia. The three major classes are: C1 (western cluster) Nekemte, Adet, Debre Markos, Yetnora, Holetta, Akaki, Ginchi and Gonder; C2 (highlands cluster) Debre Berhan and Bekoji; and C3 (eastern cluster) Sinana, Bale-Robe, Agarfa, Mojo, Debre Zeit, Kombolcha, Mekele, Asasa, Kulumsa and Alemaya. For more precise and efficient environmental definition for crop improvement research, cluster group C1 is further subdivided into two subgroups, C1-1 and C1-2, at the six-group level (Fig. 2, Table 6). Cluster group C3 is further subdivided into three subgroups, C3-1, C3-2 and C3-3. Figure 2: Dendogram for the classification of the 20 wheat growing sites into homogenous agro-ecologies. Three and six group levels are indicated. Sites are described in detail in Table 1. TABLE 5. Correlation coefficient analysis of longitude (LON), latitude (LAT), altitude (ALT), annual precipitation (AP), modality (MOD), main season precipitation (MSP), length of growing season (LGS), start of growing season (SGS), end of growing season (EGS), minimum temperature (Tmn), and maximum temperature (Tmx) for the selected wheat growing sites
a Temperatures during the growing season* P<0.05; ** P<0.01 TABLE 6. Results of cluster analysis and some characteristics of the selected wheat growing sites in Ethiopia
a LGP = length of growing periodb Two cropping seasons, but clustering was done using the main season c Early season waterlogging DISCUSSION Wheat growing regions of Ethiopia can be characterised as having highly heterogeneous, complex agro-ecological conditions. Crop production potential and management practices in each region are affected by the interplay of many factors, including climatic elements, soil characteristics, and a range of socio-economic and biological factors. Development of appropriate crop production technologies requires a thorough understanding of site-specific constraints. Knowledge of such constraints facilitates the identification of production problems, setting of research priorities, and the generation of technology that is agroecosystem-specific. A fuller understanding of the agro-ecological characteristics of the major wheat growing areas in Ethiopia will also allow the dissemination of research results and improved technologies across areas with similar conditions. Among the climatic variables studied, precipitation was found to be seasonal, varying in amount over space and time as expected. Wheat yields in Ethiopia are not only low, but they are highly variable over time and space, probably due mainly to precipitation variability. Singh and Byerlee (1990) also reported that rainfall was the dominant factor influencing yield variability on a global basis. In agreement with a previous study (Belay et al., 1994), mean annual precipitation in the current analysis was noted to gradually decrease from west to north-east (r = -.73**). During the main rainy season (meher), moisture-laden winds originating from the South Atlantic Ocean blow over the humid regions of the Gulf of Guinea and the Congo Basin across central Africa to Ethiopia: as a result, precipitation diminishes in an easterly direction. In contrast to this, belg season rain is derived from moist winds originating from the North Arabian Sea and the Indian Ocean; these are drawn into Ethiopia due to a low pressure air system in the Rift Valley: as a result, the belg season rain diminishes in a westerly direction. It has been reported that altitude plays an important role in the distribution of wheat production in Ethiopia through its influence on precipitation and temperature (Hailu, 1991). Our analysis reveals that altitude had a significant negative relation with temperature, but not with precipitation amount and distribution (Table 5). Similar results have been reported by Belay et al. (1997) for tef (Eragrostis tef) growing regions in Ethiopia. Thus, the traditional classification of wheat growing regions based on altitude alone needs to be re-examined. Since precipitation amount and distribution change along a west-east axis, longitude together with temperature and soil parameters should be utilised in site classification. However, altitude exhibited an effect on mean air temperature which influences crop maturity intervals, the incidence and severity of crop diseases and insect pests, and the rate of evapotranspiration. The effective start and end of the growing season, the length of the season, and temporal and spatial variability are the most important weather-related parameters used in developing a strategic plan for dryland farming technology generation. On the basis of precipitation amount different definitions of these moisture-sensitive parameters have been suggested (Stern et al., 1982; Belay and Struik, 1993). However, crop moisture stress does not begin when rainfall ceases, but rather becomes apparent when plant roots can no longer obtain sufficient moisture from the soil to replenish that lost through transpiration. Therefore, these critical parameters are better defined on the basis of soil moisture reserves rather than rainfall records as demonstrated in this study. Traditionally, the choice of crop species and/or cultivars and the associated crop management practices in Ethiopia are not geared towards using the soil moisture resource as efficiently as possible. To reduce the national food deficit on a long-term and sustainable basis, it is critical to focus on efficient utilisation of soil water. Farmers occasionally sow crops later than the optimal sowing date (i.e., often later than the optimal date by 2 to 4 weeks), both in Vertisol zones where early waterlogging is a problem and in weed-infested highland zones (i.e., where the first flushes of weed emergence are destroyed by tillage). Such delayed planting not only exposes the wheat crop to terminal moisture stress, but also exposes the bare (i.e., fallow) soil to excessive erosion early in the season. From a crop improvement point of view, locations should be classified into homogeneous environmental or agro-ecological groups based on natural resource analysis. The cluster analysis used in this study produced several classes at different levels of discrimination (Fig. 2). However, a cluster of three major and six minor classes could be useful for defining the environments encompassing wheat crop improvement sites and in strategic planning for wheat production. The western cluster of environments is basically characterised by very high precipitation with monomodal distribution, a long growing period, and high production potential. In terms of resource use efficiency, monocropping of wheat in these regions may not be economically optimal. Rather, relay cropping or double cropping systems should be emphasised to increase resource use efficiency. Other negative effects such as transient waterlogging during June and July, particularly on Vertisols, should not be neglected and mitigating measures need to be applied to maximise resource use efficiency. Rainfall distribution in the eastern zone (i.e., approximately between 39.4° and 42.5° E) is effectively bimodal as a consequence of the movements of the Inter-Tropical Convergence Zone. In these regions, double cropping should be an effective means of maximising return per unit area; on-station research at Sinana has already established the feasibility of double cropping at this specific site (Tanner et al., 1994). Clustering production areas into homogeneous environmental groupings should assist the national wheat improvement programme in making decisions regarding the selection of test sites and proper targeting of released varieties. For example, wheat breeding research in the western region (cluster group C1) should focus on the development of long season genotypes tolerant of early waterlogging. For cluster group C3-2, breeding for tolerance to early waterlogging and terminal drought stress is essential. Cluster group C3-3 requires a breeding effort to develop short cycle and drought tolerant varieties. Detailed recommendations about how best to respond to this environmental assessment in terms of land preparation, cultivar characteristics or ideotypes, cropping system components, seeding and fertiliser rates, and time of seeding are vital for the different agro-ecological regions. ACKNOWLEDGEMENTS This project was supported financially by the CIMMYT/EU Project on Strengthening Wheat Breeding and Pathology Research in the NARS of Eastern Africa and by the CIMMYT/CIDA Eastern Africa Cereals Program. We gratefully acknowledge Drs. Efrem Bechere, Bedada Girma and Osman Abdalla for reviewing the manuscript. REFERENCES
Copyright 1999, African Crop Science Society The following images related to this document are available:Photo images[cs99002a.jpg]Line drawing images[cs99002b.gif] | |||||||||||||||||||||||||||||||||||||||||||||||||||||||||||||||||||||||||||||||||||||||||||||||||||||||||||||||||||||||||||||||||||||||||||||||||||||||||||||||||||||||||||||||||||||||||||||||||||||||||||||||||||||||||||||||||||||||||||||||||||||||||||||||||||||||||||||||||||||||||||||||||||||||||||||||||||||||||||||||||||||||||||||||||||||||||||||||||||||||||||||||||||||||||||||||||||||||||||||||||||||||||||||||||||||||||||||||||||||||||||||||||||||||||||||||||||||||||||||||||||||||||||||||||||||||||||||||||||||||||||||||||||||||||||||||||||||||||||||||||||||||||||||||||||||||||||||||||||||||||||||||||||||||||||||||||||||||||||||||||||||||||||||||||||||||||||||||||||||||||||||||||||||||||||||||||||||||||||||||||||||||||||||||||||||||||||||||||||||||||||||||||||
| |||||||||
