 |
| About Bioline | All Journals | Testimonials | Membership | News |
|
||||||
|
||||||
African Crop Science Journal, Vol. 7. No. 4, pp. 341-347, 1999
Estimation of Banana Yield Based on Bunch Phenology P. L. WOOMER, M. A. BEKUNDA1 and S.T. NKALUBO2
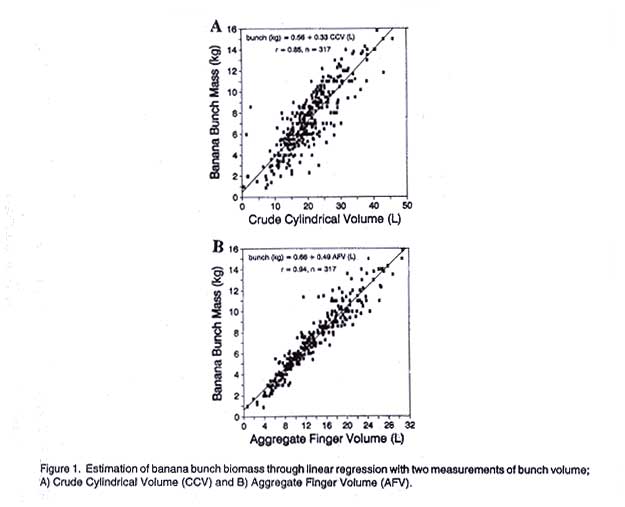
Code Number: CS99024 ABSTRACT Cooking bananas (Musa cvs.) are the most important food crop in Uganda and considerable research attention is now focused on yield declines experienced in long-term banana production areas. Measurement of banana bunch weight using field scales is rapid and reliable, but not always possible during field monitoring because it requires that either farmers, possess and, reliably use scales or that researchers are present during the short interval between bunch harvest and marketing or consumption of bananas. Furthermore, occasional theft of banana bunches from field experiments pose serious sources of experimental error owing to the large mass of individual bunches and relatively few banana plants per experimental plot. The phenology of 317 banana bunches of Musa cv. Mbwaziirume obtained from a three year-old field experiment at the Mukono District Farm Institute was used to construct two estimates of individual bunch volume. Crude cylindrical volume (CCV) is based on the distance between the upper and lower most hands (length) and the maximum bunch girth (circumference). Aggregate finger volume (AFV) is based on the mean length and maximum circumference of three banana fingers x mean number of fingers per hand x number of hands per bunch. Both volume estimates were expressed as litre bunch-1 and compared to individual banana bunch mass (kg bunch-1) using linear regression procedures. Banana bunch mass varied from 0.9 to 15.9 kg and bunch volumes between 0.5 to 45.9 l. Both volume estimates yielded significant relationships with mass as a dependant variable where bunch (kg) = 0.56 + 0.33 CCV (r = 0.85) and bunch (kg) = 0.66 + 0.49 AFV (r = 0.94). These relationships were established across a range of management practices including ± retention of crop residues and ± addition of 10 t ha-1 yr-1 napier grass (Pennisetum atropurpureum) or cattle manure. Bunch mass varied from 4.11 to 8.28 kg in relation to management and these changes were reflected in the slope values of CCV but not AFV, suggesting that AFV provides a more robust estimate, however, CCV is more easily obtained from non-destructive field measurements. Key Words: Cattle manure, East Africa, Musa, Pennisetum atropurpureum, residue management, Uganda RÉSUMÉ Les bananes constituent une culture vivrière en Uganda et une recherche considérable met l’accès sur la réduction de rendements experimentée depuis longtemps dans les régions de production. La mesure du poids du régime de banane utilisant des balances de champs est rapide et sure, mais pas toujours possible durant le suivi des champs parce qu’il requiert que, soit le fermier possède une balance sure ou soit que les chercheurs soient présents entre la petite période de recolte du regime et la commercialisation à la consommation de la banane. Plus encore des voles occasîonnels des regimes de banane en champs d’éxperimentation constitute des sources d’érreurs éxperimentales en raison de la grande masse de régime individuel et relativement peut de plantes de bananes par parcelle. La phenologie de 317 régimes de bananes de Musa cv. Mbwazirume obtainus du champs d’essas âgé de 3 ans à l’Institut de Ferme au district de Mukono été utilisée pour construire deux estimations du volume de regime individuel. Le volume cylindrique brut (CCV = VCB) est basé sur la distance entre la supérieure et la plus basse extrème main (longeur) et la circonferénce maximale du régime. Le volume du doigt aggrégé (AFV) est basé sur la moyenne de la longeur et la circonférence maximale de 3 doigts de banane x la moyenne du nombre de doigts par main x nombre de mains par régime. Les deux volumes ont été exprimés en litre/régime et comparés à la masse de régime individuel (kg/régime) utilisant de procédures de la regression linéaire. La masse du régime de banane a varié de 0.9 à 15.9 kg et le volume de régime entre 0.5 à 45.91. Les deux estimations ont produit de relations significatives avec la masse comme variable dependante où le régime (kg) = 0.56 + 0.33 CCV (r = 0.85)et le régime (kg) = 0.66 + 0.49 AFV (r = 0.94). Ces relations ont été établies à travers une série de pratiques de gestion incluant ± la retention des résidus de plantes et ± l’addition de 10 t ha-1 (Pennisetum atropurpureum) ou le fumier de vache. La masse du régime a varié de 4.11 à 8.28 kg en relation avec la gestion et ces changements ont été reflectés dans les valeurs de pente de CCV et non pas pour AFV, indiquant que AFV produit une estimation plus robuste, alors que CCV est facilement obtainu dans la mesure non destructive en champs. Mots Clés: Fumier de vache, Afrique de l’Est, Musa, Pennisetum atropurpureum, gestion de résidus, Uganda Introduction Cooking bananas (Musa spp.) are the major staple crop in Uganda, which produces and consumes more of this commodity than any other nation (Stover and Simmonds, 1987). Despite this distinction, however, Uganda is facing a crisis in its food security because of declining banana yields (matoke decline) (Bekunda and Woomer, 1996). This crisis has been met with an intensification of field research, with emphasis on on-farm experimentation and local performance trials and demonstrations that examine the response to pest management (AHI, 1996) and soil fertility amelioration options (Woomer et al., 1998). One experiment that addresses declining banana production is located at the Mukono District Farm Institute (Woomer et al., 1998), a farmer vocational facility within an area severely affected by matoke decline. Additional on-farm studies examining incidence of nutrient limitation and various intercropping/rotation strategies are underway. One serious problem encountered in these efforts is the incidence of banana bunches being harvested without researchers having opportunity to take yield records. Given the large weight per bunch and the relatively few bunches per experimental plot, this loss of information imposes a serious source of experimental error and introduces an unwelcome element of distrust between researchers and their client farmers. Regardless of occasional theft of banana bunches, many more are regularly harvested and many different measurements obtained from them such as weight, maximum circumference, length, number of hands and number of fingers per hand. Information on banana bunch characteristics may be combined to estimate the volume of those bunches. In this paper, we explore the possibility of reducing the experimental errors implicit from non-recorded harvest losses through reconstruction of banana bunch weights based on their volumes under the assumption that volume may be measured in-situ. Materials and methods Experimental site and design. A field experiment was established at the Mukono District Farm Institute, Mukono District, Uganda (0º1.4’N, 32º3’E) to determine the effects of field sanitation and organic input additions on banana production. The experimental site is located in Mukono district where the matoke decline is recognised as being severe (Bekunda and Woomer, 1996). The site receives bimodal rainfall (March-June, September-December) averaging 1375 mm yr-1, with average annual minimum and maximum temperatures of 15.0ºC and 27.5ºC, respectively. The soil is classified as a Ferralsol with a sandy clay loam texture, pH 5.3, low in soil organic C (1.1%), available P (9 mg kg-1) and extractable K (<0.3 c.mol. kg-1) with 0.14% total N. The experimental design was a randomised complete block with treatments arranged in a 2 x 3 factorial with ± crop residue removal and ± cattle manure or napier grass (Pennisetum atropurpureum) leaves applied at 10 t ha-1 y-1. Young plants of Musa spp. var. Mbwazirume propagated by tissue culture were planted at 3 m x 3 m spacing in plots 12 m x 15 m (20 plants plot-1) with the central six plants comprising the sampling area. The experiment was planted in February 1996 with banana bunch harvest beginning in September 1997 and continuing through February 1999. Data collection. During the 18 month banana bunch sampling interval, 317 bunches were harvested from the sample plots. These bunches were weighed with a 20 kg capacity hanging spring scale. The maximum circumference of each bunch was measured with a flexible plastic tape. The distance between the upper most and lower most banana hands along the bunch stalk was also determined. The number of hands along the bunch stalk and the number of fingers in each hand were counted. One banana finger was selected at random from the upper most, middle and lower most hand. These fingers were removed from the bunch and the length and mid-point circumference measured with a flexible measuring tape. The volume of each bunch was estimated in two different manners. The crude cylindrical volume (CCV) was calculated as the area (= p r2) of the maximum circumference (= 2p r) x the bunch length. The radius of the maximum circumference was calculated as r = 2 p r/2 p). CCV was expressed in litres (l) and calculated as: CCV (l) = ((p r2 (cm2)) * (bunch length (cm)))/1000 [Equation 1] Aggregate Finger Volume (AFV) was based on the mean calculated volume of three banana fingers based on length and maximum circumference area and adjusted by the number of fingers per bunch where: AFV(l) = (finger volume (cm3) * fingers hand-1 * hand bunch-1))/1000 [Equation 2] Statistical analyses. The average bunch weights and dimensions were calculated for each plot and entered into a spreadsheet. ANOVA was conducted on bunch mass, length and maximum circumference (Wilkensen, 1990) and the Least Significant Difference calculated from Little and Hills (1978). Separate linear regressions were performed with the two volume estimates (CCV and AFV) as independent variables and bunch mass as the dependent variable (Wilkensen, 1990). Linear regressions were conducted for the overall data set and for data sorted by field management and harvest year. Results Banana bunch mass (kg), length (cm) and maximum circumference (cm2) are presented for six different management practices in Table 1. Significant differences (P<0.05) were observed for all variables. Bunch weights ranged between 4.1 kg in the treatment receiving no external inputs and crop residues removed following harvest and 8.3 kg in the treatment receiving 10 t napier grass cuttings ha-1y-1. ANOVA revealed significant interaction between residue management and organic input addition for bunch weight (P=0.05) but not length or maximum circumference. Table 1. Effects of organic resource management on banana bunch
mass and phenology after three years of cultivation at the Mukono District Farm
Institute, Uganda
A Pearson Correlation Matrix of banana bunch characteristics is presented in Table 2. All regression coefficients are highly significant (P<0.001). Bunch maximum circumference had the strongest correlation with bunch mass, accounting for 55% of the observed variation. The overall linear regression of CCV and AFV as predictors of banana bunch weight are presented in Figure 1. Both linear relationships were highly significant (P<0.001). The relationship of bunch weight was somewhat stronger for AFV than CCV, with these two independent variables accounting for 89% and 73% of observed variation, respectively. The linear relationships between field estimates of bunch volume and bunch weights held for several different management practices (Table 3) with AFV again accounting for more variation in bunch weight (80% to 92%) than did CCV (62% to 74%). Furthermore, the slope coefficient for CCV tends to increase with management resulting in larger bunches (r = 0.37, P = 0.09, data not presented). The linear relationships also held for banana bunches as the mats aged (Table 4). Table 2. Pearson Correlation Matrix of banana bunch characteristics
(n = 316)
a finger girth = finger circumference (cm) Table 3. Linear regression equations predicting banana bunch mass (kg) from Crude Cylindrical Volume (CCV) and Aggregate Finger Volume (AFV) under different management systemsa
aMean regression values (and standard errors) from four replicates
Table 4. Linear regression equations predicting banana bunch mass (kg) from
Crude Cylindrical Volume (CCV) and Aggregate Finger Volume (AFV) over timea
a Mean regression values (and standard errors) from four replicates
Discussion Banana bunch yield could be reasonably predicted from estimates of bunch volume based on phenology but it is important to note that these measurements were performed on detached (harvested) bunches rather than being obtained through non-destructive measurement. Aggregate Finger Volume revealed the strongest relationship with yield, but the volume estimate is not well suited to non-destructive field measurement because the total number of hands per bunch and fingers per hand is difficult to estimate from compact bunches, particularly those borne on large-statured banana varieties. Furthermore, AFV is partially a destructive method in that it is based upon aggregation of the volume of three banana fingers that are excised prior to measurement. Crude Cylindrical Volume appears better suited to rapid field measurement as it is based upon only two dimensional variables (bunch length and diameter) but CCV is a less precise (Fig. 1) and robust (Table 3) estimate. Individual physical dimensions of the banana bunches used to calculate CCV and AFV did not serve as particularly strong estimators of banana bunch weight (Table 2), accounting for between 41% and 55% of observed variation. Theoretically, both CCV and ADF linear regression equations assume that the "density", that is the mass to volume relationship, of banana bunches remain constant regardless of their size, growth or/and management conditions. The slope and coefficient of determination (r2) for CCV in Table 3 suggests that this may not be the case over a wide range of management conditions. Inaccuracies of the relationship are also reflected in the intercept values because it tends to be positive while the CCV equation should theoretically approach zero as bunches of diminishing mass also occupy less space until eventually both parameters equal zero. The relationship between AFV and bunch weight may be more precise because it is conceptually more elegant. Matoke decline syndrome is expressed through the production of less hands containing fewer, smaller fingers with the central stalk comprising a larger proportion of the total bunch. Only finger volumes are totalled in the estimation of bunch volume, the volume of the central stalk is not taken into account. However, the stalk is considered along with the bananas when the bunch is weighed. Accordingly, the intercept term (y) of the linear regression predicting bunch weight from AFV represents the central stalk because it is the component of bunch mass that is not accounted for by the total volume of banana fingers (x). The y-intercept is thus not expected to approach zero but rather represent the banana stalk mass. Therefore, the linear regression equation based on ADF as an independent variable predicts 0.66 kg for a barren banana stalk. A source of error is not introduced as bunches increase in size and contain a larger stalk mass because the slope coefficient accounts for not only increased banana finger mass, but the stalk increase required to support that greater amount of fingers. Other researchers have taken different approaches to estimating banana bunch yield. Meyer (1995) reported a strong correlation between the biomass of the median finger of the fourth hand and total bunch mass and used this relationship to predict bunch yield within ±0.5 kg. To some extent, however, this approach is somewhat superficial because field workers could readily weigh the entire bunch rather than select representative fingers to obtain a more accurate measurement of yield. Rekha and Prasad (1993) examined the characteristics of 170 banana genotypes in India, reporting significant positive correlations between finger weight and bunch weight but the number of hands bunch-1 and fingers bunch-1 did not significantly correlate with yield, concluding that finger weight was an important selection criteria for improvement in banana. Turner et al. (1988) estimated the number of fingers on banana bunches based on the number of fruits on the third hand from the top end of the bunch and on the second hand from the bottom end of the bunch and the number of hands on the bunch. This technique could be incorporated into our field estimates of AFV with caution because its accuracy was specific to Mbwazirume but not other cultivars. These authors also identified the central hand along the bunch stem as the most representative for calculating mean finger weight, which partially supports the approach taken in this study. Ortiz and Vuylsteke (1995) reported that bunch weight, finger weight and size were positively influenced by both ploidy increases and change of recessive to dominant alleles of the parthenocarpy gene. While these relationships are of great importance in genetic improvement of bananas, they provide little opportunity to rapidly estimate yield in smallhold farming systems. Sands and Saerah (1981) examined fruit characteristics of 18 cultivars of Malaysian bananas, observing that increasing number of hands bunch-1 is more likely to be associated with an increased number of fruits per hand and per bunch in triploids than in diploids and that the weights of fruits tend to be greater in triploids. These differences between genotypes suggest that the regression relationships described in this study may be specific to cv. Mbwazirume. Thus, further studies are needed on the regression equations between bunch mass and estimates of bunch volume for other banana cultivars and genotypes. Acknowledgement The assistance of David Bwamiki of the National Agricultural Research Organisation (NARO, Uganda), Christine Najjuma of Makerere University Department of Soil Science and Musaazi James of the Mukono District Farm Institute in data collection and field maintenance is gratefully acknowledged. This research was financed through a grant from The Rockefeller Foundation Forum for Agricultural Resource Husbandry. References
©1999, African Crop Science Society The following images related to this document are available:Photo images[cs99024a.jpg] | ||||||||||||||||||||||||||||||||||||||||||||||||||||||||||||||||||||||||||||||||||||||||||||||||||||||||||||||||||||||||||||||||||||||||||||||||||||||||||||||||||||||||||||||||||||||||||||||||||||||||||||||||||||||||||||||||||||
| |||||||||
