 |
| About Bioline | All Journals | Testimonials | Membership | News |
|
||||||
|
||||||
African Crop Science Journal, Vol. 7. No. 4, pp. 559-567, 1999 Soil fertility management in the banana-based agriculture of central Uganda: Farmers constraints and opinions H. Sseguya, A. R. Semana and M. A. Bekunda Code Number: CS99047 ABSTRACT Soil nutrient depletion is one of the root causes of declining food production in Uganda. Results of a study comprising a survey and group discussion with farmers in Mukono district, Uganda, revealed that farmers perceive continuous cropping and erosion as the main causes of soil fertility degradation. The most frequent resource input to mitigate the degradation was banana residue. Only 0.9% of the farmers use mineral fertiliser, applying it to annual crops (maize and beans) whose residue is transferred to banana. Farmers perceive manure, coffee husks, compost as best suited for effective soil fertility management but the relationships between farm size and use of cattle manure was significant and positive (P<0.001), implying a need for much land if one is to utilise cattle manure. Utilisation of domestic compost was positively related with households headed by females (P<0.05), implying that since they lack access to most resources and provide most of the agricultural labour, they resort to the more labour intensive but easily accessible domestic compost. Group membership shifted the predicted probability for adoption of coffee husks from non-adoption to adoption whereas access to credit facilities shifted the predicted probability to adopt chemical fertiliser from 0.06 to 0.99. Access to extension services was also significantly related to adoption of soil fertility management practice, particularly coffee husks. Provision of credit, information, inputs and involving farmers in the development activities appear to be major requisites for improved agricultural production in the area. It is recommended that farmers in the smallhold banana agriculture in Mukono district be availed with a variety of practices for soil fertility management to choose from because they have a diversity of resources at their disposal. Key Words: Farmer opinions, Lake Victoria Basin, smallholder farmers, soil fertility RÉSUMÉ La dégradation des élements nutritifs du sol est l’une des racines fondementales biophysiques qui cause le déclin de la production alimentaire en Uganda. De résults d’une étude d’enquête et de groupes de discussions avec les fermiers dans le district de Mukono, a révélé que les fermiers aperçoivent que la culture continue et l’érosion sont les principales causes de la dégradation de la fertilité du sol. La resource la plus fréquante qui atténue la dégradation étaient les résidues de banane. Seulement 0.9% d’agriculteurs utilisent des engrais mineraux les appliquant sur les plantes annuelles (maïs et la haricots) dont les résidus sont transferés à la banane. Les agriculteurs constatent que le fumier, les balles de café, le compost sont les meilleurs appropriés pour une gestion effective de la fertilité du sol, mais la relation entre la taille de l’exploitation et l’utilisation du fumier de vache était significative et positive (P<0.001), suggérant un besoin de beaucoup de terre si quelqu’ un doit utiliser le fumier. L’utilisation du composte domestique était associée positivement aux ménages dont les femmes sont à la tête (P<0.05), signifiant que comme elles n’ont pas accès à la majorité de ressources et fournissent plus de main d’oeuvre agricole, elles font recours au travail le plus intense mais au composte domestique facilement accessible. L’adhésion au groupe a changé la probabilité prévue pour l’adoption des tourtaux de cafés de la non-adoption à l’adoption là où l’acceés aux facilités de crédit a changé la probabilité prévue pour adopter l’engrais chimique de 0.06 à 0.99. L’accée aux services de vulgarisation était aussi significativement lié à l’adoption des pratiques de gestion de la fertilité de sols en particulier les balles de café. La provision du credit, l’information,les intrants et l’implication des agriculteurs dans les activités de dévelopment les concernant apparaissent être les plus nécéssaires pour la production agricole améliorée dans la région. Il a été recommendé que les agriculteurs qui ont de petites parcelles de bananeraie dans le district de Mukono soient disponibilisés d’une variété de pratiques de gestion de fertilité du sol d’où ils peuvent faire un choix parce qui’ils ont une diversité de sources à leur disposition. Mots Clés: Opinions des fermiers, le Bassin du Lac Victoria, petits exploitants, fertilité du sol Introduction Banana is a major food crop for at least 30 % of the people in Uganda (FAO, 1995) but production decline in the country is a reality (Bekunda and Woomer, 1996). This decline has been attributed to pests, diseases, soil nutrient deficiencies and a host of socio-economic and post-harvest problems (Rubaihayo, 1991). The most affected part of the country in banana decline is the Lake Victoria Basin, a high rainfall region lying within 25 to 30 km around Lake Victoria (Bekunda and Woomer, 1996; Gold et al., 1999). In the Lake Victoria Basin banana is mostly grown by small-scale farmers on an average land size of less than two hectares (SFI, 1999). Soil nutrient depletion on smallholder farms has been cited as the biophysical root cause of the declining food production in Africa (Sanchez et al., 1996). The soils of the Lake Victoria Basin have low inherent fertility because they are old and highly weathered (Delvaux, 1996). This soil fertility depletion problem could be overcome if the removal of nutrients resulting from harvests and other losses were being replaced. Soil fertility in Uganda is mainly replenished by the use of organic crop residues (Ddungu, 1987), but the materials removed from the banana growing areas are seldom returned to the fields, because they have many alternative uses, such as use as feed for animals (Swift et al., 1994). Inorganic fertilisers could supplement the organic input. Unfortunately, these have a supply constraint as one of the leading problems hindering its use (Young, 1994). According to Sanchez et al. (1997), soil fertility depletion in small-scale households is largely a consequence of socio-economic constraints and policy distortions. We hypothesise that this also applies to adoption of soil fertility management practices. This research focuses on banana-based small-scale farms in Mukono district, Uganda, to generate information on factors that affect utilisation and adoption of soil fertility management practices and technologies respectively, and the farmers’ opinions as regards effective soil management. Materials and Methods Data depicted in this study took into account the innovation-diffusion model and the adopter perception model (Makokha et al., 1999). Surveys and group discussions with seven selected farmers were employed in Mukono district. Table 1 summarises the main features of the area and its farming systems. Table 1. Features and farming systems of Mukono district
Sources: Mugisha (1996), Bekunda (1999) For this study, the muti-stage sampling procedure was used. Surveys were conducted in two of six randomly selected counties, Mukono and Ntenjeru in the district. From the 2 counties a total of 115 households were interviewed, each household being represented by the member responsible for decision making in banana agriculture. The farmers interviewed were randomly selected with assistance of members of the local administration units. The information sought consisted of practices being used to replenish soil fertility, factors that affect the utilisation and adoption of the practices, livestock numbers, farm size, banana mat age, mat density, estimated banana yield and farmer opinions on effective soil fertility management. Also sought were the perceived importance for crop production and soil fertility management, and possible reper-cussions for each practice. The group discussions were conducted in five villages in a radius of two kilometres from the District Farm Institute (DFI). The selection of the seven farmers in the five villages was done with the assistance of the extension worker attached to the DFI and the farmers themselves, one of the main criteria being the farmer having an extremely depleted banana field. Data from the farmer discussions consisted of the farmers’ causes of soil fertility depletion, practices in place and those known to the farmer to combat the depletion farmer opinions on effective soil fertility management, and other activities in the area. Both the surveys and group discussions were conducted in the local dialect (Luganda), and responses recorded in English. Surveys were held between November and December 1998, whereas the group discussions were held at least twice a month for six months. For both studies the data were sorted, coded and entered into the SPSS-PC computer programme, and thereafter, analysed using frequencies, correlations (Phi, or Cramer’s V), and logistic regression. Results and Discussion Discussion during group sessions revealed that farmers perceived continuous cropping and erosion to be the main causes of soil degradation (Table 2). However, several other constraints were revealed, including negative effects with use of inorganic fertiliser which one farmer experienced. This same farmer was one of the two who cited lack of information as a contributing factor to soil degradation. She had no knowledge on the appropriate methods of inorganic fertiliser utilisation. Table 2. Perceived causes of soil degradation (n = 7)
Table 3. Effect of resource use on banana production and yield
parameters (n=115)
a B, banana stalks and leaves, FC field crop residues, CM cattle manure,
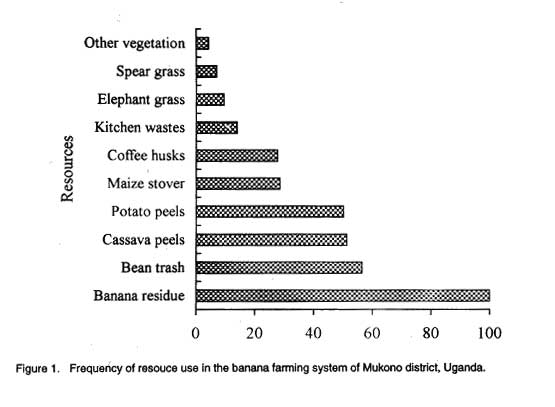
NCM, non-cattle manure, M, all manure, DC, domestic compost Figure 1 shows the farmers’ resource use frequency in banana agriculture. The most frequent input is banana residue; only 0.9% of the farmers used fertiliser input, applying it to other crops (maize and beans). Although the farmers used a variety of inputs, most were reported to be inadequate. About 38% of the farmers reported having sufficient inputs and these realised average annual banana yields of 8.37 metric tons per hectare compared to the overall average of 5.03 metric tons per hectare. Farmers were also aware of other soil fertility management practices but had reasons for not using them (Table 4). Most farmers were aware of inorganic fertiliser but did not apply them because fertilisers were too expensive. Farmers did not have access to credit even though 99.1% of the respondents were aware of at least one credit source. Only 30.5% had ever applied for loans, of whom 13.1% were successful. Reasons for limited application for loans included fear of property confiscation upon default (40%), lack of information on borrowing procedures (14.8%), and lack of collateral (0.9%). Farmers aware of erosion control structures cited limited land, labour and lack of technical knowledge as the reasons for failure to adopt the practice. The major reason for not using compost was that it was labour intensive. Those who did not use manure had no animals and could not afford to purchase from neighbours. Table 4. Practices known to farmers but were not adopted (n=115)
With regard to the relationship between soil fertility management practices and farmer characteristics, the correlations are presented in Table 5. The data were further analysed using the logit model to predict the probabilities of farmers’ adoption of soil fertility management practices, and the independent variables responsible for the probabilities (Table 6). Table 5. Relationships between soil fertility management practices
and selected variables
1BANLAND: Land under banana over 0.5 ha, EXTAGENT: farmer has access to extension agent, (NOAGENT: no access), EXTFRND: farmer relies on friends and neighbours for information, GENDERF: Female household member responsible for banana agriculture, LOAN: Credit reception (NOLOAN: No credit), MEMGRP: Farmer group membership, NUMFEMAL: Female household labour force, SCHYR: Farmer educational level, POPDENS: Population density, TOTLAND: Farm size Table 6. Logistic regression analyses of adoption of soil fertility
management practices in the banana-based farming system of Mukono district1
1These equations were generated using stepwise forward selection using the maximum likelihood method at the 0.05 significant level. BANLAND: Land under banana over 0.5 ha, EXTAGENT: farmer has access to extension agent, (NOAGENT: no access), GENDERF: Female household member responsible for banana agriculture, LOAN: Credit reception (NOLOAN: No credit), MEMGRP: Farmer group membership, POPDENS: Population density, TOTLAND: Farm size The analyses in Tables 5 and 6 revealed that eight factors were significantly (P<0.05) related to the utilisation of the selected soil fertility management practices. They included farm size and banana plot size, source of agricultural information, population density, gender, agricultural labour force, group membership, access to credit facilities and the farmer’s educational level. From the logit model, P (adoption) = (1 + e-z)-1, where z = B0 + B1X1 + B2X2 + ... BnXn (B0 is the constant, B1 - Bn are the coefficients and X1 - Xn are the corresponding independent variables). This derivation was used to predict the probability of adoption of each of the practices, based on the models resulting from Table 6 for each practice. For adoption of manure, For adoption of domestic compost, For adoption of coffee husks, Therefore, P (adoption of coffee husks) = (1 +e-(-0.14)) -1 = 0.47 ... Equation 3 Finally, for adoption of chemical fertiliser with credit acquisition, z = 7.8 So, P (adoption of chemical fertiliser) = (1 +e-7.8) -1 = 0.9995 ... Equation 4 By assuming absence of the conditions in the respective models for the practices, the predicted probabilities for adoption are as shown below (Equations 5 - 10). For prediction of adoption, the general decision rule is that if the estimated probability of the event is less than 0.5, we predict that adoption will not occur. If the probability is greater than 0.5, we predict that adoption will occur (SPSS, 1994). For adoption of livestock manure, in case a farmer does not belong to any farmer’s group, z = (0.58 -0.4) = 0.18, P = 0.54 ... Equation 5, whereas with a small land holding, In case of coffee husks, if farmers manage small banana plots (< 0.5 ha),
though with provision of extension services, With absence of group settings, other factors remaining constant, z = 0.85 - 0.56 -0.99 = -0.7, P= 0.33 ... Equation 9, Finally, in case of adoption of chemical fertiliser, with absence of loan facilities,
From the equations therefore, in case of adoption of cattle manure, absence of groups and a small farm size does not lead to failure to predict the probability of its utilisation. For adoption of coffee husks, absence of groups among farmers was predicted to shift the adoption probability from a region of adoption to a region of non-adoption, though lack of extension services does not lead to this outcome. Management of small banana plots of less than 0.5 hectares leads to a rise in probability for adoption of coffee husks. For adoption of chemical fertiliser, credit availability and accessibility dramatically shifts the adoption probability from a low level of 0.06 to a high level probability of 0.99. All the full models in Table 6 lead to predictions that adoption was likely, given the conditions as predicted. Table 7 presents farmer opinions on the potential intervention methods for land management. For ease of comprehension and discussion, these have been considered in four categories, namely soil fertility management practices, financial conside-rations, extension and action on pests and diseases. Table 7. Farmer opinions for soil fertility management and other
interventions
Table 8. Farmer attitude to practices used in soil fertility management
In order to manage the soil resource effectively, certain socioeconomic conditions require attention (Table 7). Farmers consider input subsidy, strengthening of the extension service and better organised credit conditions as essential entry points for adoption of soil fertility management practices and technologies. Pests and diseases also need to be controlled as part of the soil fertility management strategy. The solutions to soil fertility management lie within and outside the domain of the physical soil science solutions. Conclusion Farmers in banana-based cropping systems in the Lake Victoria basin consider the problem of soil fertility depletion as serious. They are aware of and apply a variety of practices to ameliorate it, but do not use them as recommended because they lack technical know-how. They also lack resources, especially input and credit. The study suggests that researchers, extension workers and farmers interact to bridge the current knowledge gap and to develop technologies appropriate to the farmers’ situation. There is need to provide farmers with information on land use and manure management, as well as recommended crop husbandry practices. Extension methods such as tours should be used to enable farmers to learn from each other. There is also need to increase farmers’ access to input and credit facilities. Acknowledgements The research was funded through a grant provided by the Forum on Agricultural Resource Husbandry, a programme of the Rockefeller Foundation. References
©1999, African Crop Science Society The following images related to this document are available:Photo images[cs99047a.jpg] | |||||||||||||||||||||||||||||||||||||||||||||||||||||||||||||||||||||||||||||||||||||||||||||||||||||||||||||||||||||||||||||||||||||||||||||||||||||||||||||||||||||||||||||||||||||||||||||||||||||||||||||||||||||||||||||||||||||||||||||||||||||||||||||||||||||||||||||||||||||||||||||||||||||||||||||||||||||||||||||||||||||||||||||||||||||||||||||||||||||||||||||||||||||||||||||||||||||||||||||||||||||||||||||||||||||||||||||||||||||||||||||||||||||||||||||||||||||||||||||||||||||||||||||||||||||||||||||||||||||||||||||||||||||||||||||||||||||||||||||||||||||||||
| |||||||||
