 |
| About Bioline | All Journals | Testimonials | Membership | News |
|
||||||
|
||||||
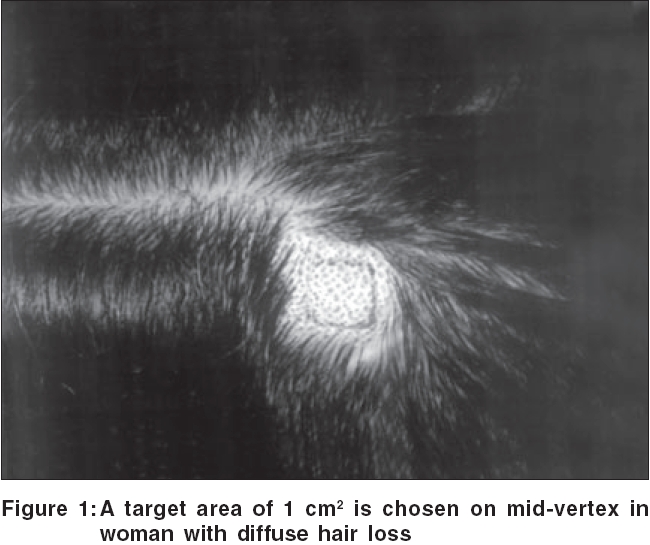
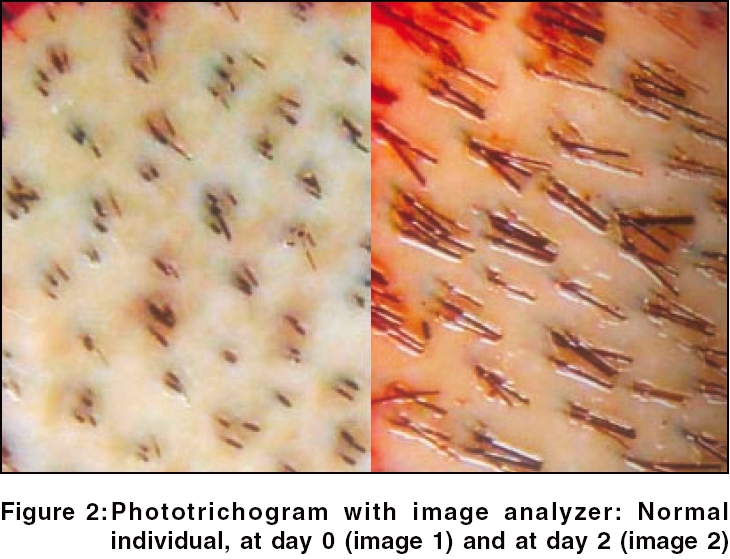
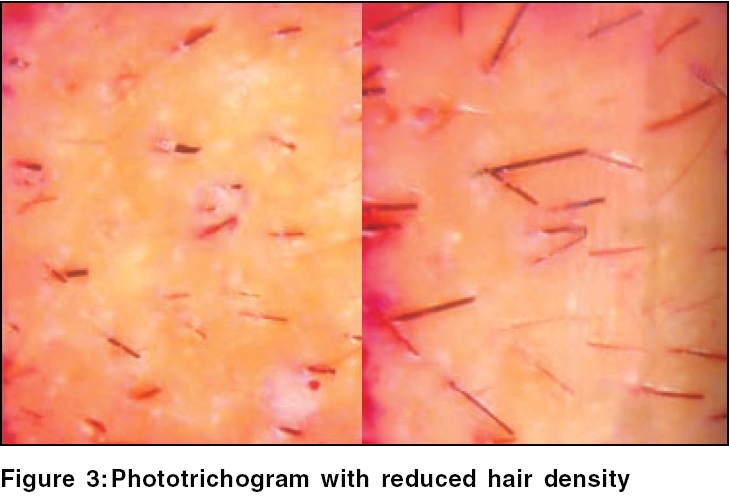
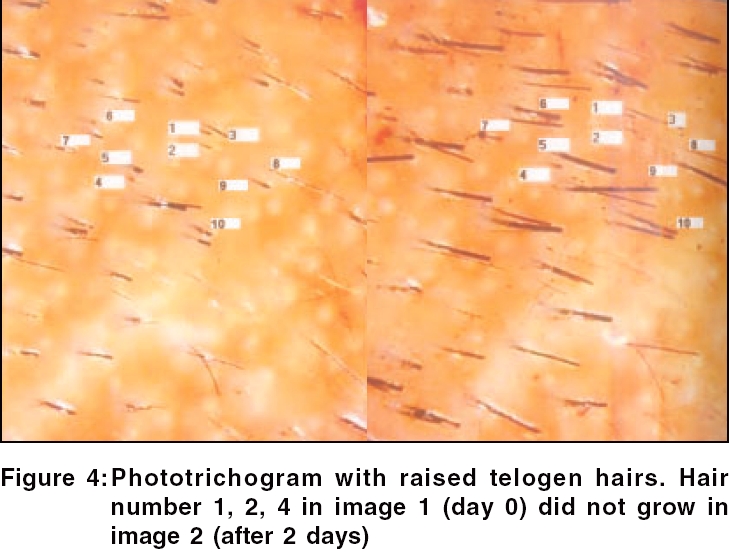
Indian Journal of Dermatology, Venereology and Leprology, Vol. 72, No. 3, May-June, 2006, pp. 242-244 Focus Phototrichogram Dhurat Rachita LTMM College and LTMG Hospital, Sion, Mumbai Code Number: dv06083 Established cases of androgenetic alopecia (AGA) are easy to recognize in men. However, AGA is harder to discern in women, with an intact frontal hairline and diffuse milder thinning over the vertex. The most common forms of hair loss like androgenetic alopecia (AGA) and telogen effluvium (TE) require quantification to assess the degree of hair loss and response to treatment. Numerous methods have been reported to assess hair variables,[1] viz,. density, growth rate, anagen/telogen ratio and hair diameter. These techniques can be classified as either invasive (e.g., biopsies[2],[3]), semi-invasive (trichogram,[4],[5] unit area trichogram[6]) or noninvasive (e.g., global hair count,[7] phototrichogram[8],[9],[10],[11],[12],[13]) methods. Trichogram The standard trichogram is a method for quantifying hair loss or monitoring the effect of therapy. It can be used to quantify and characterize effluvium (anagen/telogen). The classic trichogram involves several, usually painful, epilations. In the case of androgenetic alopecia (AGA), epilation is done on a balding scalp area and as a comparative control, on a scalp area not affected by the condition, i.e., on the occiput. Microscopic counting of the hair roots enables calculation of the anagen/telogen ratio and hence, one can determine the severity of hair loss. More than 50 hairs need to be epilated for the trichogram results to be reliable or valid. In addition to the pain of epilation, the need to abstain from washing hair for several days before the procedure, limits the significance of the trichogram. Besides, it requires experience to obtain a sample of undamaged hairs and this affects the results of the test. Standardization of conditions for the epilations is crucial for reproducibility of results. The examiner has to be aware that the site of epilation and the amount of epilated hair can vary from session to session, which leads to variability of test results and affects the diagnostic accuracy of the procedure. Thus the standard trichogram has a role in the basic evaluation of hair loss, but when compared to phototrichogram, it has several disadvantages. Phototrichography First introduced by Saitoh in 1970,[8] the phototrichogram (photographic trichogram) is a noninvasive technique that is simpler and more reproducible and sensitive than a trichogram. It allows the in vivo study of the hair growth cycle. It can be used to find the rate of hair growth, size of hair fibers and frequency of telogen hair follicles and to quantify shed hair. Several variants of the phototrichogram have become popular for evaluating hair in the clinic and in clinical research trials. Saitoh et al .[8] developed a method for measuring the ratio of anagen, catagen and telogen to the full cycle of growth in human scalp. All hairs in a 2 sq cm area are trimmed 1 mm from the skin surface [Figure - 1] and a baseline photograph is taken. After a week, the same region is photographed and the hairs are trimmed again. This process is repeated until enough pictures are available for comparison. By comparing with the baseline picture, one can observe as to which hair fibers have grown (follicles in anagen) and which have not (follicles in telogen) [Figure - 2], the rate of hair growth (the length of hair in 7 days), the density of the hair (the number of hairs in the photograph) and which hair fibers are missing 5 days later (an indication of the rate of hair shedding) [Figure - 3][Figure - 4]. To facilitate observation over a long period of time, a dot is tattooed on the volunteer′s scalp. The tattoo allows another phototrichogram at the same spot several months later. This is useful for testing new hair loss treatments and quantitatively evaluating hair growth in the same spot over the long term. Digital phototrichogram At the beginning, phototrichogram analysis was done manually; the photographs on day 0 and day 5 would be placed side by side for comparison. The length and diameter of hair fibers would be measured with a ruler and then the average hair growth rate calculated. This technique has been improved by image analysis and later, by the use of immersion oil (scalp immersion proxigraphy photographic method)[9] and digital contrast enhancement.[10] The scalp immersion proxigraphy photographic method involves using close-up photography, where the scalp is viewed under a glass slide with a drop of immersion oil. This increases the resolution of the image and gives more clarity to the image under similar magnification conditions. The remaining procedure is similar to that in a classical phototrichogram. The contrast-enhanced phototrichogram procedure involves coloring hair with black-colored dye immediately before the procedure. These temporarily colored hairs give a better contrast against the white scalp, making this method more sensitive for less pigmented and thin hairs. However, all these methods are tedious and very time consuming; consequently, a phototrichogram is not commonly used in the general dermatology clinic. Hence, need for development of a computerized automated phototrichogram system that could be easily used in a dermatology clinic has been felt since many years. Hoffmann, in 2001, developed a commercial fully computerized phototrichogram technique with automated software named ′Trichoscan′.[14] A target area (a transitional area of hair loss between normal hair and the balding area in male AGA and mid-vertex in women with diffuse hair loss) of 1.8 cm 2 is chosen for clipping. The area on the scalp is marked with a central black tattoo. The clipped hairs within the target area are dyed for gray or fair hairs and photographs are taken immediately after shaving, 2 or 3 days after shaving with a digital close-up camera with epiluminescence microscopy. These two photographs are then examined by a software system that is able to recognize individual hair fibers in the photographs. By comparing the two photographs, the computer can determine which hairs are growing and which are not. Trichoscan can be used to monitor the success of treatment, as it is reproducible. The Trichoscan system is now available on the Internet (http://www.trichoscan.com). The primary advantage of this technique is that it can be used for clinical studies to compare placebo versus treatment or to compare the efficacy of various hair growth promoting substances. Phototrichogram can be used for studying AGA or other forms of diffuse hair loss and it can be adopted to study the effect of drugs or laser treatment on hypertrichosis or hirsutism.[14] References
Copyright 2006 - Indian Journal of Dermatology, Venereology and Leprology The following images related to this document are available:Photo images[dv06083f4.jpg] [dv06083f1.jpg] [dv06083f3.jpg] [dv06083f2.jpg] |
| |||||||||
