 |
| About Bioline | All Journals | Testimonials | Membership | News |
|
||||||
|
||||||
Indian Journal of Dermatology, Venereology and Leprology, Vol. 74, No. 1, January-February, 2008, pp. 80 Net Study A study of oxidative stress in paucibacillary and multibacillary leprosy Jyothi P, Riyaz Najeeba, Nandakumar G, Binitha MP CHC, Iriveri, Kannur Code Number: dv08030 Abstract Background: The study and assessment of oxidative stress plays a significant role in the arena of leprosy treatment. Once the presence of oxidative stress is proved, antioxidant supplements can be provided to reduce tissue injury and deformity. Keywords: Leprosy, malondialdehyde, oxidative stress, superoxide dismutase The major defense against microbial infection is the macrophage system. Microbial killing by macrophages is associated with a burst of respiratory activity that leads to the production of a variety of molecules and free radicals called reactive oxygen species (ROS), such as superoxide anion, hydrogen peroxide and hydroxyl radicals. [1] These ROS can damage lipids, proteins and nucleic acids. Prime targets of peroxidation by ROS are polyunsaturated fatty acids (PUFA) in membrane lipids. PUFA is degraded by free radicals to form malondialdehyde (MDA). The level of MDA in serum serves as a marker of cellular damage due to free radicals. [2] Cells have multiple mechanisms to remove free radicals and thereby minimize tissue injury. Antioxidants (AO) such as enzymes superoxide dismutase (SOD) and catalase and nutritional antioxidants trap free radicals and act as free radical scavenging systems. [3] Oxidative stress (OS) is an expression used to describe various deleterious processes resulting from an imbalance between free radical generating and scavenging systems. OS leads to metabolic impairment and cell death. OS occurs if ROS are not adequately scavenged by antioxidants. [4] The ratio of MDA/SOD may be considered as an index of OS. [5] The present study was conducted to assess the OS in leprosy patients by estimating the levels of antioxidant enzymes (SOD), lipid peroxidation products (MDA) and the ratio of MDA/SOD in paucibacillary (PB) and multibacillary (MB) leprosy and to analyze if there was any difference in OS between leprosy patients and controls. Material and Methods Fifty-eight newly diagnosed cases of leprosy attending the outpatient department during the period from May 2004 to August 2005 were selected for the study before starting multidrug therapy. Patients were classified into two groups, paucibacillary (PB) and multibacillary (MB), based on the WHO guidelines. [6] Patients with chronic debilitating diseases, smokers and those taking other medication were excluded. The control group consisted of 58 age- and sex-matched apparently healthy subjects, who were nonsmokers and not on any drugs. Informed consent was taken from each patient and control before the procedure. Estimation of SOD and MDA Blood samples were collected by venous puncture using disposable syringes and needles and transferred into clean dry containers. Blood was allowed to clot and the serum separated by centrifugation at 3,000 rpm for 5 min. Analysis was done in UV-Vis spectrophotometer. Serum SOD activity was measured by the method suggested by Marklund and Marklund. [7] This method utilizes the inhibition of auto-oxidation of pyrogallol by SOD. Reagents
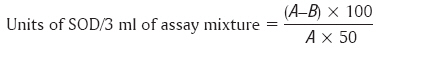
Procedure (for control) : To 2.9 ml of tris buffer, 0.1 ml of pyrogallol solution was added and mixed; and reading was taken at 420 nm exactly after 1 min 30 s and 3 min 30 s. The absorbance per 2 min was recorded and the concentration of pyrogallol was adjusted so that the rate of change of absorbance per minute was approximately 0.020-0.023 nm. For sample : To 2.8 ml of tris buffer, 0.1 ml of sample was added and mixed; and the reaction was started by adding 0.1 ml of adjusted pyrogallol solution (as per control). Reading was taken at 420 nm exactly after 1 min 30 s and 3 min 30 s and the absorbance was recorded per 2 min. Calculation
Unit x 10 = Units/ml of sample solution Definition of unit : One unit of SOD is described as the amount of enzyme required to cause 50% of inhibition of pyrogallol auto-oxidation per 3 ml of assay mixture. Malondialdehyde was measured in the serum by the method based on Pasha and Sadasivadu′s procedure. [8] MDA reacts with thiobarbituric acid (TBA) to generate a colored product, which can be measured spectrophotometrically. In acidic solution, the product absorbs light at 530 nm. TBA test detects only free MDA and measures the amount of free MDA in peroxidising lipid system. The molar extinction coefficient of MDA-TBA product is (1.54 x 10⁵) at 530 nm and it is used to calculate the amount of MDA formed. Reagents : 40% trichloroacetic acid (TCA), 0.67% thiobarbituric acid Procedure : One milliliter of serum added to 1 ml of 40% TCA followed by addition of 2 ml of 0.67% TBA. The mixture was then kept for 10 min in a boiling water bath. It was cooled immediately in ice-cold water bath. The mixture was then centrifuged at 6,000 rpm for 30 s and absorbance of supernatant was read at 530 nm. Calculation Comparison of evidence of OS between patients and controls was performed using Analysis of covariance (ANCOVA) test. P-value < 0.05 was considered significant. Results Of the 58 patients, 23 (40%) were PB and 35 (60%) were MB leprosy patients. The age of PB patients varied from 7 to 45 years, with a mean of 26.09 years; and that of MB patients from 13 to 60 years, with a mean of 37.94 years. The age of the control group varied from 5 to 60 years, with a mean of 32.52 years. The mean levels of SOD and MDA and the MDA/SOD ratio in all cases of leprosy taken together and in PB and MB cases taken individually are shown in [Table - 1]; and they are compared to those of the control group. The mean value of SOD in the leprosy patients group was decreased when compared to the control group. The mean value of MDA was increased in the study group when compared to the control group. The mean ratio of MDA/SOD was increased in the study group when compared to the control group. The difference in all the three values was found to be statistically significant. The mean value of SOD was lower in PB group compared to the control group, but it was statistically insignificant. The mean value of MDA was high in the PB leprosy group in comparison to the control group and it was statistically significant. Even though the mean value of MDA/SOD ratio was high in the PB leprosy group, it was statistically insignificant. Comparison of SOD, MDA and MDA/SOD ratio between MB patients and the control group was done. The mean value of SOD was low and that of MDA and MDA/SOD ratio was elevated when compared to the control group. The difference in all the three values was statistically significant. The MDA, SOD and MDA/SOD ratio in different types of leprosy is shown in [Table - 2]. The results show an increase in the MDA/SOD ratio from the tuberculoid (TT) to the lepromatous (LL) types. Even though there was gradual reduction in SOD from TT to LL, the MDA level does not show a gradual increase. It may be due to small sample size in each group. Discussion According to Ridley and Jopling, leprosy is classified into five subtypes - Tuberculoid leprosy (TT), borderline tuberculoid (BT), mid-borderline (BB), borderline lepromatous (BL) and lepromatous leprosy (LL). Neuritic and indeterminate types are not included in it. In this study, there were four cases of HD (N) and three cases of HD (I). Here it may be worthwhile to consider WHO classification when these two types were also accounted. Besides, while following R-J classification, the size of the sample will substantially be reduced. The levels of SOD in MB patients were significantly low when compared to those of normal controls, as well as of PB patients. There was no significant difference in SOD levels between PB patients and normal controls. Antioxidant status gradually decreased along the spectrum from TT to LL. SOD is one of the major AO enzymes which scavenge free radicals. The results indicate that AO defense is weaker in MB patients. This decrease in SOD could either be due to inhibition of the enzyme or due to lower concentration of the enzyme as a result of repression of the SOD gene. Some component of M. leprae might also be down-regulating the SOD gene in the macrophages and other tissues. [5] In MB cases, the bacillary load is high compared to that in PB cases. As a consequence, free radical production is also high. It is possible that these free radicals may be utilizing AO enzymes and this may be the reason for decreased SOD in MB patients. In tuberculoid spectrum, there is only localized nerve damage and is not widespread as seen in lepromatous spectrum. Antioxidants are found to be low in leprosy, especially in lepromatous spectrum. Vitamin A, C and E levels are found to be low compared to those in normal people. [9],[10],[11] Decreased antioxidant defense may be one of the reasons for increased levels of ROS and subsequent tissue damage in lepromatous spectrum. ROS produced in PB can be scavenged by antioxidants. Intervention with antioxidant supplementation prevents oxidative stress mediated through ROS and activates the net antioxidant status. [12] MDA levels in both MB and PB patients were significantly elevated compared to those in normal controls. This indicates that increased lipid peroxidation due to ′free radical′-mediated injury occurs in leprosy patients. Increased lipid peroxidation can occur if the rate of production of reactive oxygen species is higher or the antioxidant level is low. The maximum increase in MDA level was in LL. In lepromatous leprosy there is defective monocyte-macrophage function. The macrophage in LL shows normal phagocytosis, but they are unable to kill the M. leprae due to inadequate superoxide production. In LL the source of ROS could be some other subpopulation of phagocytes in which normal respiratory burst occurs like immunologically activated macrophages, neutrophils and some other sources. SOD is an antioxidant enzyme found in many cell types. One type of SOD is the copper-zinc-SOD - made up of two identical subunits, each having one atom of copper and one atom of zinc. It is found in cytoplasm of all eukaryotic cells. The second is manganese-SOD, in which manganese is present in the active site and is seen in mitochondria. In PB patients, since the ratio of MDA/SOD was not significantly increased, it can be assumed that there is not much oxidative stress. MDA/SOD ratio was significantly high in MB patients, indicating high oxidative stress. This may be due to high bacillary load. There is a steady increase in the ratio as we go along the spectrum from TT to LL. Even though mean MDA/SOD ratio is found to be high in HD (I), the P-value is> 0.05 and hence is not significant. We got only three cases of indeterminate leprosy. Hence a definite opinion regarding oxidative stress in indeterminate leprosy cannot be formed with this finding. A detailed study, with more cases, may be necessary. This study was conducted in patients before starting the treatment. This study confirms the presence of OS in leprosy, especially MB leprosy; and this is the highest in LL. Nutritional AO such as carotenoids, especially beta carotene; and lycopene, flavonoids, tea polyphenols, selenium, vitamins C and E scavenge superoxide, hydrogen peroxide, hydroxyl and peroxyl radicals, singlet oxygen and reactive nitrogen species. They prevent lipid peroxidation and DNA damage. Hence intervention with AO supplementation prevents OS and thereby may be helpful in reducing tissue injury in leprosy. Acknowledgment The authors gratefully acknowledge the expert guidance and support rendered by Dr. K. Parvathi, Prof. and Head, Department of Biochemistry, Medical College, Calicut. References
Copyright 2008 - Indian Journal of Dermatology, Venereology and Leprology The following images related to this document are available:Photo images[dv08030t1.jpg] [dv08030t2.jpg] |
| |||||||||
![[Table - 1]](/showimage?dv/photo/dv08030t1.jpg)
![[Table - 2]](/showimage?dv/photo/dv08030t2.jpg)