 |
| About Bioline | All Journals | Testimonials | Membership | News |
|
||||||
|
||||||
Indian Journal of Dermatology, Venereology and Leprology, Vol. 74, No. 6, November-December, 2008, pp. 691-695 Research Methodology Basics of statistics for postgraduates Nerurkar RP Department of Pharmacology, T. N. Medical College, Mumbai Code Number: dv08285 Statistics is frequently considered by postgraduates to be a tool for analyzing data after a dissertation work is complete. However, it is mandatory to use statistics right from the planning stage of a study. This article covers the area of basic statistical concepts with the aim of guiding postgraduates toward choosing correct statistical methods for a particular research question and dataset. Statistical Concepts Definition of statistics Statistics is a way of thinking about the variable events. The relative frequency with which an event occurs is called its probability ( P value). By convention, events with a probability of 5% or less ( P < 0.05) are considered rare or significant. The objective of research is to find out about the population at large. However, it is generally not possible to study the whole population and research questions are addressed in an appropriate sample. The information obtained from a sample of individuals is used to make statements about a wider population of similar individuals. The procedure of drawing conclusions about the population based on study data is known as inferential statistics. The findings from a study give us the best estimate of what is true for the relevant population. Types of data In research, it is necessary to study certain characteristics in a group of subjects, such as age, sex, socioeconomic group, etc. Each of these characteristics may vary from person to person and is referred to as a variable. The values taken by these variables are referred to as data. Data collected during a study may fall into one of the following three types of data:
Descriptive statistics Descriptive statistics includes measures of central tendency and variability. This type of statistics is commonly used to summarize data about sociodemographic and clinical features. Measures of central tendency include mean, median and mode.
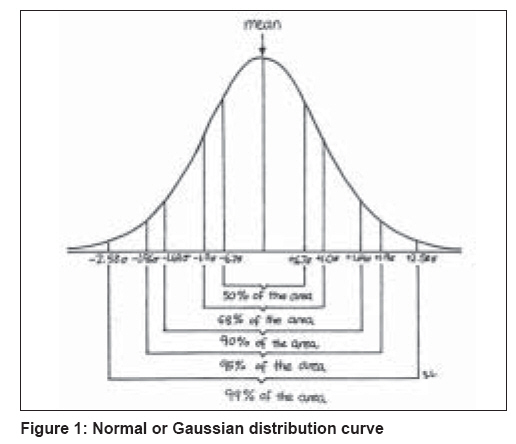
Measures of variability include range, interquartile range, standard deviation (SD) and standard error of mean (SEM). The range denotes the spread between extreme values (minimum and maximum). Interquartile range is the data included between the 25 th and the 75 th percentile of a distribution. SD describes the variability of data about the sample mean and it therefore describes the variability within a given sample. The SEM helps describe the distribution of means of several samples about a true population mean. It describes the variability of mean between samples. SEM is given by the formula SD/√N. Finally, confidence interval (CI), which is derived from the SEM, defines the interval likely to include a true population value, based on statistical values and probability characteristics of data distribution. Mean + 1.96 SEM gives the 95% CI. It gives the range of values that will contain the true population mean with a probability 0.95. A wider CI implies wider variance. Studies with a large sample size will provide a narrow CI. Categorical (nominal) data can be summarized as frequencies or percentages. Distribution of data: Normal distribution The most important distribution in statistics is called normal distribution. It is often called Gaussian distribution. The term "normal" does not mean that the distribution is common or typical. Normal distribution curve is a frequency distribution curve and is unimodal, symmetrical and bell-shaped [Figure - 1]. Many statistical tests ( t -test, analysis of variance, correlation and regressions) are based on the assumption that the collected data passes the normality test (Gaussian distribution). When data do not have a normal distribution, we can either transform the data (e.g., by taking logarithms) or use a method that does not require the data to be normally distributed. However, this process requires a little more expertise in biostatistics. Presentation of data After the data is summarized, it needs to be presented in the tables, graphs or diagrams. Line diagrams are generally used to show an event in relation to time. Bar diagrams are generally used to provide visual comparison of figures. Pie diagrams are used to show the relative frequency (or percentage) of many parts of a whole. Histograms are used for frequency distribution. Scatter diagrams are useful to show an association between the variables. Uses of Statistics Statistical methods are helpful for:
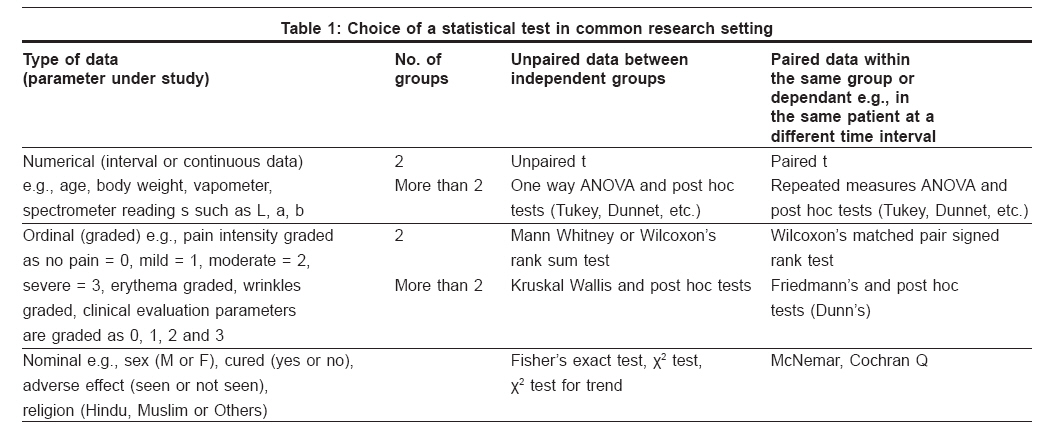
Hypothesis Testing To answer questions such as "Is there a difference between two means?" or "Is there an association between various observations?," we use various tests of significance. These tests are aimed at assessing whether the null hypothesis is likely to be correct. The null hypothesis states that there is no difference between the groups with respect to the measurements made. The significance test chosen is dependent on the type of data we are dealing with, whether it has a normal distribution, and the type of question being asked. Once the distribution is known, you can tell if the null hypothesis should be tested using parametric or nonparametric methods. Analysis using parametric tests relies on the data being normally distributed. Nonparametric tests are used when the data is not normally distributed. The various tests of significance give us the test statistic value ( t , F , U , r , etc.) and the P -value is then calculated using standard tables provided. If P < 0.05, the null hypothesis is rejected and we conclude that there is a significant difference or association between the groups. Importance of sample size in planning and interpretation of medical research The role of statistics in medical research starts at the planning stage of a clinical trial or laboratory experiment. This is carried out to establish the design and the size of the experiment that will ensure a good prospect of detecting the effects of clinical or scientific interest. The increasing volume of research by the medical community often leads to an increase in the number of contradictory findings and conclusions. If the sample size is too small, the study may fail to detect a true difference that actually exists (Type II or beta error, False -ve conclusion). By convention, the beta error should be 0.2 or 20% or less i.e., sample size should be large enough to have a maximum 20% chance of the result being false negative (i.e. P -value being more than 0.05 even when there is significant difference between the two groups). In other words, we say that the study did not have enough power to detect a true difference. Then, the power of a study is termed as 1-beta and should be 0.8 or 80% or more. If the sample size is too large, it may be concluded that even a very small difference is statistically significant but, in actuality, this difference is not clinically significant. We conclude that a difference exists when actually it does not exist. This is known as Type I error or alpha error (False +ve conclusion). By convention, this error (level of significance) should be 0.05 (5%) or less. A very large sample size also increases the cost and causes delay in completion of a research project. For details of calculation of the sample size before starting a study, please refer to the article by Zodpey (Sample size and power analysis Indian J. Dermatol Venereol Leprol Mar-Apr 2004; 70:p 123-128). Choice of Statistical Test (Why a Particular Test is Chosen) It depends on the objective or the goal of the study [Table - 1].
Tips and Guidelines for Descriptive and Inferential Statistics
Common errors in statistics (examples of the misuse of statistics) Incorrect analysis of data is probably the best known misuse of statistical methods. Mishandling of statistical analysis can lead to incorrect answers and conclusions.
Which statistical software should I use? There are many statistical softwares available for carrying out the analysis, such as SPSS, SAS, NCSS, Epi-info, etc. The Graphpad Instat software is very popular as its demo version can be freely downloaded from the website www.graphpad.com. However, one may use any of the commercially available softwares as well and may get equally good results. This article has summarized commonly used statistical methods in clinical research. An attempt has been made to introduce the subject of statistics to postgraduates ready to undertake research, although with an attendant risk of oversimplification at times. Readers are requested to refer to the bibliography for further details and consult an expert biostatistician for the detailed analysis of their data.[16] References
Copyright 2008 - Indian Journal of Dermatology, Venereology and Leprology The following images related to this document are available:Photo images[dv08285t1.jpg] [dv08285f1.jpg] |
| |||||||||

