 |
| About Bioline | All Journals | Testimonials | Membership | News |
|
||||||
|
||||||
Electronic Journal of Biotechnology, Vol. 3, No. 2, August, 2000 SHORT COMMUNICATION Semi-quantitative detection of genetically modified grains based on CaMV 35S promoter amplification Alejandro C. Tozzini*1, M. Carolina Martínez2, M. Florencia Lucca3, Cecilia Vázquez Rovere4, Ana Julia Distéfano5, Mariana del Vas6 and H. Esteban Hopp7 1Instituto
de Biotecnología, Instituto de Tecnología Agropecuaria (INTA) Castelar.
Argentina, Las Cabañas y Los Reseros, s/n, 1712, Villa Udaondo, Pcia. de
Buenos Aires E-mail: atozzini@cicv.inta.gov.ar
Received February
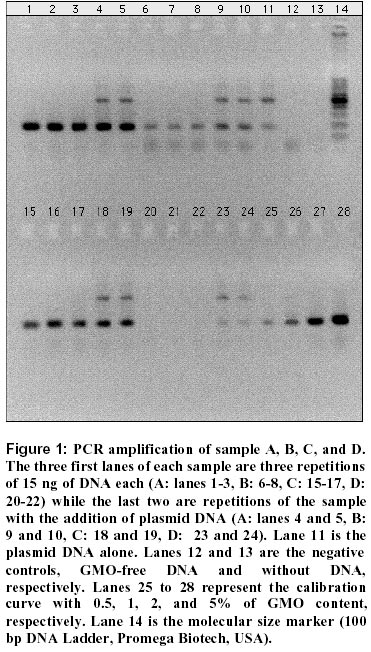
26, 2000 Code Number: ej00014 Abstract The detection and exact quantification of the presence of GMOs (genetically modified organisms, also named as living modified organisms, LMOs) grains has become very important in international commercial transactions, especially from countries producing both types of commodities, GMOs and GMO-free. This makes necessary to check every batch previous delivery to the recipient country. Several PCR protocols have been proposed to detect the presence of GMO DNA in a sample due to its sensitivity and independence of environmental and physiological influences. However, most of them are qualitative assays and don’t give a good quantitative estimation of the detected signal. We developed a semi-quantitative method based on the comparison of the mass of the amplification product of the sample with the mass obtained from standard samples of known GMO concentration delivering an accurate estimation of the amount of GMO in a sample. At the same time the reaction is countersigned by an internal reaction control. A strict set up of the conditions is essential to control error-prone steps (like the quantification of the DNA template and of the DNA products and pipetting errors) that may bias the result. Using this protocol, we were able to routinely assess the quantity of transgenic grains present in shipments that sum more than 600,000 tons of corn and 250,000 tons of soybean exported between 1997 and 1999. Keywords : Genetically modified organisms, GMO, Living modified organisms, LMO, PCR, TransgenicArticle Currently, the detection of genetically modified organisms, GMOs (also called living modified organisms or LMOs) has become an important subject in international trades of agricultural products. Furthermore, international agreements (Conference of the Parties held at Montreal in January 2000) established the labelling requirement for trans-boundary movement of genetically modified seeds for planting (LMOs), as well as grains intended for direct use as food or feed, or for processing (GMOs). The indiscriminate use of elevators and transport media of GMO and GMO-free grains may create mixtures containing both types of grains. Also GMO pollen can fecundate GMO-free plants, thus transmitting recombinant DNA to the resulting grain. This source of small contamination makes unrealistic to establish a zero threshold for certification of GMO-free grains. The fact that mixtures are possible makes necessary to implement checking at different points of traceability schemes that go from the field to the food processing plant. In international commerce a threshold level of 1% is currently accepted for certification (European Union directive number 49/2000). Polymerase chain reaction is the laboratory method of choice for the detection of a DNA modification introduced into an organism. There are different PCR primers for the amplification of DNA present in most GMOs (see for example Argentine CONABIA home page, http://www.sagpya.mecon.gov.ar/programas/programas.htm go to "conabia"), like the 35S promoter from CaMV and the NOS terminator from the Agrobacterium tumefaciens Ti plasmid. Thus, the detection of these elements will serve as a diagnostic of the vast majority of GMO plant material. Using PCR primers for the 35S promoter (DG JRC, Environment Institute, Consumer Protection and Food Unit) we developed a routine PCR protocol for detection of GMOs in a semi-quantitative way, i.e. comparing the mass of the amplified product with standard samples of known GMO concentration. This methodology gives good estimations of the concentration of GMO DNA. Materials and Methods Materials. Two samples of 2 kg of non-transgenic corn grains where mixed with 50 gr and 20 gr of transgenic corn (Novartis Argentina, transformation event 176) to perform samples A and B, respectively. Sample C comes from a corn shipment for exportation, while sample D is "organic corn" processed (hominy grits) for export destined to the production of corn flakes. Soybean samples were similarly prepared using transgenic seeds from Nidera (Argentina) containing transformation event 40-3-2. Sampling seeds and processing. From representative 2 kg samples of grains (that were sampled according to International Seed Trade Association –ISTA- standards (Bould, 1986)) not less than 500 grains were chosen at random and blended in an analytical mill (A-10 Analytical Mill, Tekmar, Ohio, USA) until the seeds were completely transformed into meal. Approximately 40 µl (about 70 mg) of meal were transferred to a 1.5 ml tube and labelled. The mill was carefully and exhaustively cleaned with a brush until no visible particles of meal were observed. The brush was strongly shacked during the cleaning process to eliminate the meal particles from it, too. Before the milling of each sample, around 50 to 80 grains belonging to the same batch were milled in the same mill and the product was discarded, then the mill was cleaned again as described before, and only after this step the actual grains to be analysed were processed. A sample of 80 GMO-free grains was processed as a negative controls every 5 consecutive samples. DNA extraction and quantification. Different DNA extraction protocols (Dellaporta et al. 1983; Saghai-Maroof et al. 1994; Spoth and Strauss, 1999) were assayed. The use of positive and negative controls and the comparison of results with highly purified control DNA indicated that the Dellaporta procedure of extraction gave the best combination of speed, absence of interfering inhibitors and low cost (data not shown), therefore this procedure was selected. The Dellaporta et al. (1983) protocol was used with modifications. Briefly, 700 µl of extraction buffer (50 mM Tris-HCl pH 8, 10 mM EDTA, 100 mM NaCl, 10 mM 2-mercaptoethanol, 1% SDS) were added to the meal and incubated during 10 min at 65°C. Then, 200 µl of 5M potassium acetate were added, the sample was vortexed and placed on ice during 10 min. After this, the mixture was centrifuged 12,000 rpm during 10 min at 4°C. Then, 400 µl of the supernatant were taken and placed in a new 1.5 ml tube. One volume of 2-propanol was added, vortexed and centrifuged at 2,000 rpm for 10 min at 4°C. The supernatant was discarded and the pellet was washed twice with ethanol 70%. Finally, the pellet was dried and resuspended in 50 µl of deionized water. To check and quantify the DNA preparation, an aliquot was resolved in a 0.8% agarose gel in 1x TAE buffer, and compared with a standard of known mass (Lambda DNA/HindIII marker, Promega Biotech, USA). The accuracy could be improved by the use of a computer imaging system (CIS) and a software to handle data from images. Out of the 700 mg of corn meal usually 1 µg of DNA was obtained. High precision Gilson pipettes (France) models P2, P10, P20, P100, P200 and P1000 were used for the different steps of DNA purification and quantification and for the preparation of PCR reaction mix. In all cases, tips with spray barrier were used. PCR analysis. Two different PCR reactions were performed with each sample, one to evaluate the quality of the DNA and the other to detect the presence of the transgene. The first one was accomplished using primers for the amplification of a conserved sequence of the genome of corn (or soybean) to corroborate the template capacity of the purified DNA obtained; at the same time this reaction allowed the evaluation of the presence of PCR reaction inhibitors. To this aim, we used primers for the amplification of microsatellites, which are presented as a single copy sequence and are more sensitive controls than other multicopy sequences (mitochondrial or chloroplast DNA). The microsatellite primers were: Maize: GCTTTCGTCATACACACACATTCA/ /ATGGAGCATGAGCTTGC ATATTT, yielding a product of about 160 bp (bnlg 161) Soybean: CTAGCCGTCATGCTAGTC/ /TGCACGTCAAATTGCTG, yielding a product of about 500 bp (see Dr. P. Cregan web page http://129.186.26.94 ). The other PCR reaction was developed for the detection of the CaMV 35S promoter. Usually, three repetitions of this PCR were routinely performed. The primers used were: GCTCCTACAAATGCCATCA (sense) and GATAGTGGGATTGTGCGTCA (antisense) yielding a product of 195 bp. The PCR reactions were carried out in final volume of 25 µl, using the 10x buffer PCR buffer supplied with the enzyme, 1U Taq DNA polymerase (Promega Biotech, USA), 1.5 mM MgCl2, 0.1 mM dNTPs and 0.25 µM of each primer, and 15-20 ng of sample DNA. The thermocycler (PTC-100 MJ Research Inc. USA) was programmed with an initial step of denaturation at 94°C for 3 min. Cycling conditions were: denaturation at 94ºC for 1 min and elongation at 72°C for 1 min. The annealing was programmed with a gradient of temperatures starting at 67°C and ending at 62°C after 10 cycles, while the annealing conditions of the remaining 25 cycles were at 62°C, all for 1 min. The last round of elongation was for 10 min at 72°C. Together with the negative controls processed all the way long with the samples, a tube with reaction mix but with no DNA, and a series of known GMO DNAs (containing 15-20 ng of DNA from 5, 2, 1 and 0.5% GMO grains) were also included. The later groups of GMO samples were used to establish a calibration curve for later comparison of the unknown samples, as well as positive and sensitivity controls of the assay. These positive controls were prepared by milling one GMO grain (transformation event 176, Novartis for maize, and 40-3-2, Nidera for soybean) with different number of GMO-free grains. Another internal reference reaction was prepared using a highly purified plasmid DNA containing the sequence of the double 35S promoter cloned in pBI121 plasmid (Clontech, USA). This plasmid contains two different sequences of annealing for the designed primers. Thus, PCR amplification using this plasmid DNA as template produces two bands: a 195 bp band (which is the same than that produced in transgenic plant DNA) and a 500 bp band (due to the amplification of the largest fragment between primer annealing sites in the double 35S promoter construct). Half a microliter of a 1:106 dilution of this plasmid preparation (500 ng/µl), which gives a PCR amplification mass comparable to that of 1% GMO content, was used to evaluate the influence of inhibitors in every DNA sample. Another two repetitions were prepared for every sample mixing the DNA to test and 0.5 µl of plasmid dilution. The reference reaction for this assay was prepared with 0.5 µl of the plasmid DNA alone, which amplification products were two different bands: one was the expected 195 bp band, and the other was of 500 bp. The last band was selected as internal control to evaluate the performance of the reaction of every sample. The PCR products were separated in a 2% agarose/ethidium bromide gel 1xTAE buffer, using the 100 bp DNA ladder (Promega Biotech, USA) as the molecular size marker. The results were evaluated by direct observation on a UV transilluminator and then recorded using a computer imaging system (Eclipse System Fotodyne, USA). Results and Discussion For each sample, one PCR reaction was performed using the corn specific microsatellite marker to assess the PCR-grade quality of the obtained DNA. The four samples to analyse plus a control DNA showed the expected PCR amplification band (data not shown), indicate the fitness of the applied procedure of extraction. This result also indicates that PCR reaction inhibitors in the samples were efficiently removed during extraction procedure. Figure 1 shows the results of the analysis of samples A, B, C, and D with their respective controls. First, the calibration curve (positive controls, lanes 25 to 28) shows the expected band of 195 bp, with increasing intensity from 0.5% to 5% GMO content. At the same time it shows that the assay was sensitive enough to detect the presence of at least 0.5% GMO DNA. No PCR amplification occurred neither in the negative control (Figure 1, lane 13), nor in the GMO-free DNA control (Figure 1, lane 12). The latter control indicates that there was no GMO DNA contamination during the milling process or during the DNA purification, while the negative control in absence of DNA indicates that the solutions used to prepare the reaction mix were free of contaminating DNA. In addition, both negative controls show that no contamination occurred while pipetting before the tubes were placed in the thermocycler. Samples A, B, and C show the expected band of 195 bp (Figure 1, lanes 1-3, 6-8, 15-17, respectively) indicating that the three samples contained GMO DNA. Simultaneously, the same band is not observed in sample D (Figure 1, lanes 20-22), indicating that, in this sample, GMO DNA was undetectable, i.e.: GMO-free or with a content of less than 0.5%. This conclusion is validated by the fact that lanes 23 and 24 show the same pattern and intensity of bands than lane 11 (plasmid DNA control) indicating that inhibitors of PCR reaction in the sample were removed during DNA extraction. Therefore this result is not a false negative. By visual comparison between the DNA mass obtained in samples A and B and the DNA mass observed in the calibration curve samples, it is possible to estimate that sample A has more mass than 2% but less than the 5%, while sample B is in the range of 0.5 to 1% GMO content. These results were expected since both samples were prepared ad hoc for the experiment (see Materials and Methods). Sample C band (Figure 1, lanes 15-17) is more intense than the 1% standard, but less than the 2% one in all three repetitions, therefore the GMO content of sample C is in the range of 1-2%, indicating that it can not be considered free of GMOs according to the 1% threshold value. The GMO content estimated for each sample must be related and corrected by the results of the internal control. The comparison of the result obtained with the plasmid DNA mixed with sample DNA and the plasmid DNA alone serves as an indication of the presence of inhibitors of PCR reaction in the sample DNA. If this is the case, the intensity of the specific band of 195 bp obtained from the sample may not reflect the actual GMO content. To perform this, the intensity of the 500 bp band (belonging to the amplification of the sequence located between the more distant primer annealing sites in the double 35S promoter construct) of sample reaction was compared with that observed with clean plasmid DNA. In the present example, no detectable differences between the results obtained with samples A, B, and C (Figure 1, lanes 4, 5, 9, 10, 18, and 19) compared with plasmid DNA were observed (Figure 1, lane 11). Due to the high sensitivity of the PCR, the proposed protocol (as any PCR-based protocol) is liable to result in false positives due to amplicon contamination. This subject is particularly important when PCR reaction is used to detect and quantify one GMO genome in hundreds of GMO-free genomes (a single copy gene per haploid genome in hundreds genomes not bearing the target gene). Thus, it requires a very strict set up of the conditions, as was determined by the collaborative trial study conducted by Lipp et al. (1999). As stated in many diagnostic protocols based on PCR, this can be prevented by adopting rather known laboratories practices which are essential for this purpose (Dieffenbach et al. 1995) that will not be discussed here. As mentioned, the proposed detection protocol has some critical error prone or semi-objective steps. These are the quantification of the DNA template and the quantification of the products (the specific 195 bp band and the internal control product). Since the quantification procedure may be biased by the "operator" (semi-objective steps) and/or affected by random error of pipetting, we prefer considering this procedure as a semi-quantitative method rather than a quantitative one. The mentioned error-prone steps may lead to differences between repetitions and between laboratories, being the last case of special importance when the labs represents both sides of a commercial transaction. A more strictly accurate quantitative analytical protocol has been developed in our laboratory as well (Tozzini et al. 2000) that is more expensive and thought for critical samples. Nevertheless, after a rigorous set up of the working conditions, the semi-quantitative protocol proposed here is well suited to be successfully applied in large scale. Using this protocol, we were able to routinely assess the quantity of transgenic grains present in commercial shipments that sum more than 600,000 tons of corn and 250,000 tons of soybean exported between 1997 and 1999. Most of the results were well bellow the 5% level and many were just bellow the 1% threshold level, which is an expected result since many shipments were traced and controlled all the way from the farm to the ship. Acknowledgements The authors thank Dr. Analía Berinstein for the linguistic revision of the manuscript. M.C.M. holds a fellowship from the Consejo Nacional de Investigaciones Científicas y Técnicas (CONICET, Argentina), M.F.L. holds a fellowship from ANPCyT and Dr. H.E.H. is a career member of the Comisión de Investigaciones Científicas de la Provincia de Buenos Aires (CIC) and Professor at the Facultad de Ciencias Exactas y Naturales, Universidad de Buenos Aires (UBA). References
Supported by UNESCO / MIRCEN network © 2000 by Universidad Católica de Valparaíso -- Chile The following images related to this document are available:Photo images[ej00014f1.jpg] |
| |||||||||
