 |
| About Bioline | All Journals | Testimonials | Membership | News |
|
||||||
|
||||||
Electronic Journal of Biotechnology, Vol. 4, No. 1, April, 2001 Optimization of the citric acid production by Aspergillus niger through a metabolic flux balance model Daniel V. Guebel1, Néstor V. Torres Darias* 2 1Counseling
Biotechnological Services, Av. San Martin 4927 Dpto. A. (C1417DSJ), Buenos Aires.
Argentina Tel: 54-11-45039355 E-mail: dguebel@radar.com.ar Financial support: The work of one of us (N.V.T.D) was supported by a research grant from the Comisión Interministerial de Ciencia y Tecnología, contract nº BIO99-0492-C02-02 and also by a research from the Gobierno de Canarias, contract nº PI2000-071. Received
October 27, 2000 Code Number: ej01002 Abstract Idiophase, the citric acid producing stage of Aspergillus niger was mathematically modeled to identify required genetic manipulations to optimize citric acid production rate. For this reason, a consistent picture of cell functioning had to be achieved. The transient idiophase nature was established by stoichiometric analysis. The main intracellular fluxes were computed by application of material and physiological constraints (ATP, reduction equivalents, proton motive force) at culture time 120 hours. The HMP pathway accounts for 16% of the glucose input (carbon basis), the Krebs cycle for 13% and the citric acid synthesis for the remaining 71%. This profile implies an operative glycerol-P shuttle. It recycles 93% of the cytosolic glycerol-P to cytosolic DHAP thus coupling the transformation of cytosolic NADH to mitochondrial FADH. A cellular maintenance energy of 3.7 mmol ATP/g·h was determined. It would be spent in fueling cytoplasmatic (1.4 mmol H+/g·h) and mitochondrial (1.8 mmol H+/g·h) H+-ATPase pumps with efficiencies of 0.65 and 1.2 mmol H+/mmol ATP respectively. The role and extent of the alternative respiration system activity and polyol excretion is accounted by the model as well. In addition, the significance of GABA shunt and futile NH4+/NH3 cycle were rejected. According to the developed model, the specific citric productivity would be increased in 45% by an unique change if glucose influx were duplicated. Differences with predictions from other model that required many manipulations are also discussed. Keywords: bioenergetics, metabolic engineering, metabolic pathway, stoichiometry. Article Aspergillus niger fermentation is the world’s leading source of commercial citric acid. This process has thus been the subject of many studies (reviews of Kubicek et al. 1994; Röhr, 1998; Kristiansen et al. 1998). Several efforts were developed to integrate the core of this knowledge in highly structured dynamical models (Torres, 1994a; Torres, 1994b; Torres et al. 1995; Torres et al. 1998; Alvarez–Vazquez et al. 2000). However, no recent attempts are reported about to gain insight trough macroscopic and energetic modeling strategies despite of some early precedents (Verhoff and Spradlin, 1976; Röhr et al. 1987). Macroscopic approach is attractive due to the general character of its assumptions and because it works without detailed mechanistic kinetic information. The availability of in vivo kinetic information under representative physiological conditions is usually scarce particularly in the case of pelletized fungus as Aspergillus (Hess et al. 2000). Hence, both modeling strategies must be considered as complementary and cross-validating (Schmidt et al. 1998). On the other hand, overexpression of some key enzymes such as phosphofructokinase and pyruvatekinase (Ruijter et al. 1997) or citrate synthase overproduction (Ruijter et al. 2000) were not successful in increasing the citric rate production. In
view of this picture, based in metabolic flux analysis -a formalism derived from
macroscopic approach- we have developed a mathematical model of the process. This
model, was aimed not only to the better understanding and description of the process
but also to help in the design of the best genetic strategies leading to the optimization
of citric acid production rate. An important hypothesis developed in the present
model is the existence of a close energetic coupling between the citric acid production
and the intracellular pH regulation. This is due to the evidence of the strong
acidic conditions that are required for A. niger to produce citric acid
(extracelullar pH In dealing with these goals, the first step was the quantitative elucidation of the main metabolic pathways involved. Since citric acid is obtained through a biphasic batch process, the analysis was focussed at the idiophase stage (80-220 hours culture time) when the growth drops and citric acid production becomes the main cellular activity. At this stage, we have quantitatively tested the significance of those pathways that have been the subject of some discussion (the hexose monophosphate pathway, the GABA shunt, the NH4+/NH3, the Krebs cycle and the alternative respiratory system among others) due to their potential influence over the cellular energetic status. In the following Model set-up section the relevant system inputs and outputs are defined and the available experimental data evaluated for consistency according to macroscopic theory principles (Erickson et al. 1978; Roels, 1983; Noorman et al. 1991; Andrews 1993). In the Model development section, the macroscopic approach was extended to intracellular level through metabolic flux analysis techniques (Niranjan and San, 1988; Vallino and Stephanopoulos, 1993; Bonarius et al. 1995; Vanrolleghem et al. 1996; Delgado and Liao, 1997). Here, the unique flux distribution compatible with the material (carbon), energy (reductance grade, Gibbs free energy) and physiological balances (ATP, NADH, FADH, proton motive force) was found. Finally, in the Optimization section the resulting model was used to identify the best targets for genetic manipulation aiming at the improvement of the process productivity. Model set-up
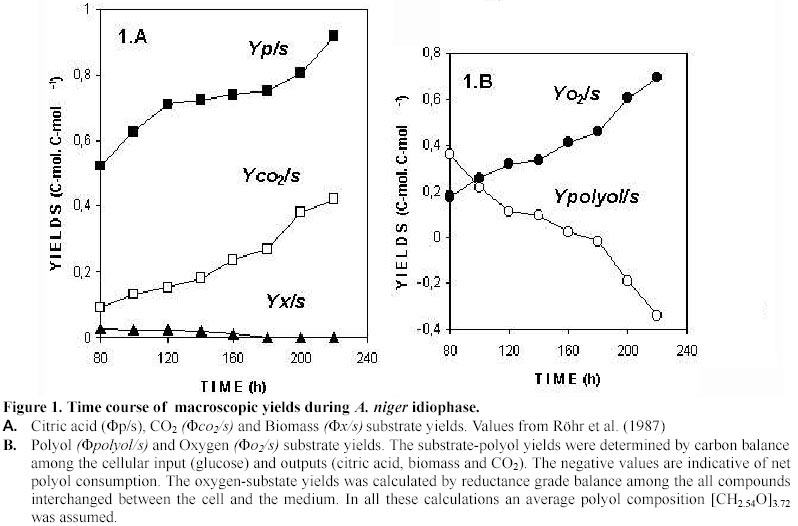
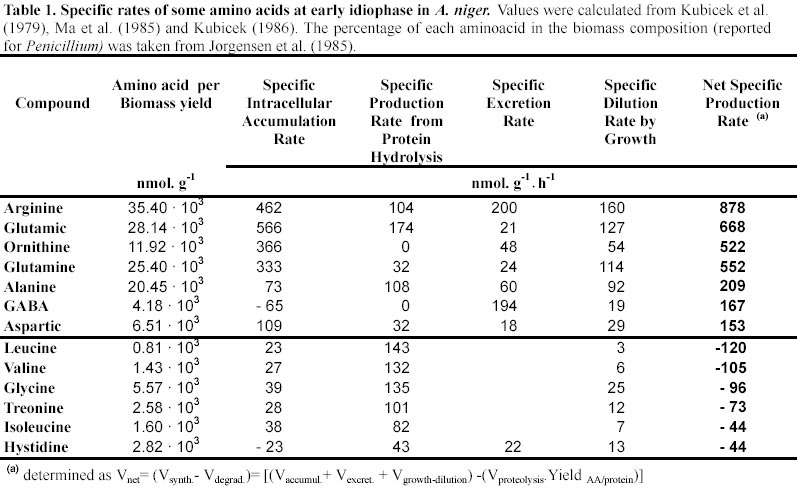
Mostly based on data gathered by the Kubicek group (Röhr et al. 1987) we have calculated the time course of macroscopic yields (Figure 1). The analysis of these data lead us to identify three different idiophase stages: early idiophase (between 80 and 120 hours); medium idiophase (120-180 hours) and late idiophase (180-220 hours). This finding suggests that the idiophase it is not a sole physiological stage and therefore an unique biochemical entity. This finding is further supported by experimental evidences. First, it has been observed that different polyols are excreted at the early and medium idiophase (Röhr et al. 1987), some of them being re-consumed in later stages (Röhr et al. 1987; Omar et al. 1992). Second, Kubicek et al. (1979) reported increases in the amino-acids and ammonium cellular pools in the early and medium idiophase stages, while the intracellular citric acid (Prömper et al. 1993), ammonium and RNA/DNA pools drops in the later idiophase stage (Kubicek et al. 1979). Finally, it is well known the fact that an alternative respiratory system (Kirimura et al. 1987) is active during idiophase when changes in the transport electron chain (Wallrath et al. 1991; Schmidt et al. 1992) and in the energy transduction efficiency (Prömper et al. 1993) occur. The stoichiometry of each one of the identified idiophase stages are the following:
In this way we have depicted a more realistic, fine tuned picture of the idiophase stage as a sequence of at least three different metabolic scenarios. It should be noted that in equations [1] and [2] the nitrogen source is not present although biomass synthesis occurs. This fact is discussed later in the Macromolecular demand and Intra and extracelullar ammonium sections. The CO2 production rate is discussed in section (b) of the Model Development and the corresponding to polyols in the ATP balances section.
Metabolic
demands for the biomass synthesis were computed from the specific requirements
of its main macromolecular components, namely: proteins/amino-acids, RNA/DNA (Kubicek
et al. 1979), polysaccharides/chitine (Kisser et al. 1980)
and lipids (Jernejc and Cimerman, 1992). But, given the small
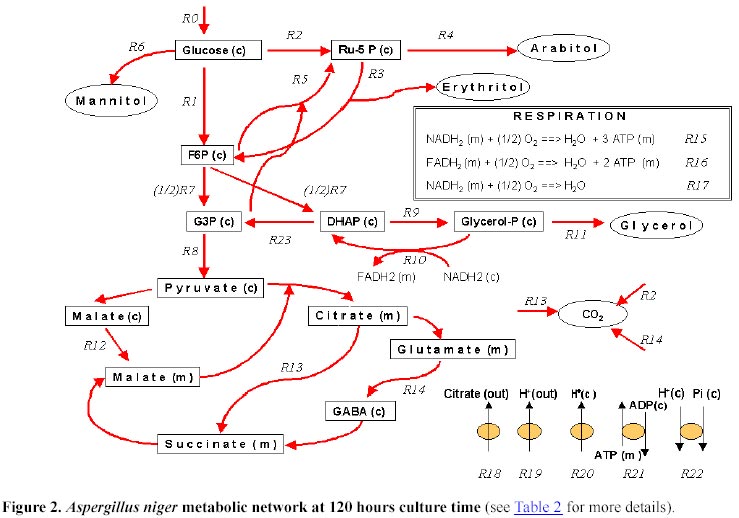
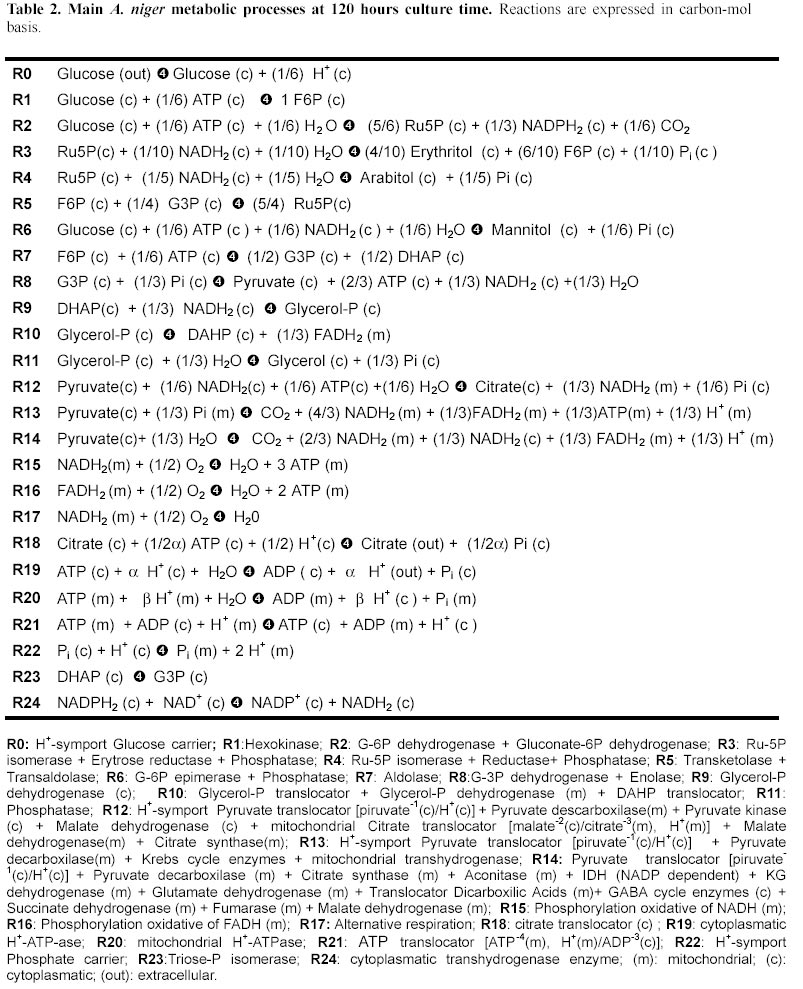
idiophase growth rate (m Model development The idiophase stages identified in section (a) of the Model set-up are discrete approximations to the actual changes operating in A. niger. Hence, for metabolic flux analysis only instantaneous inputs and outputs were considered. Although the citric acid yield remains almost constant from 120 to 180 hours (Figure 1A), values at 120 hours were selected since polyol excretion is better determined and no re-consumption reported at this time. The specific macroscopic rates considered, expressed as carbon-mmol.g-1· h-1 were: substrate, 6.85; CO2, 1.04; citrate, 4.87; glycerol, 0.264; erythritol, 0.316; arabitol, 9.4·10-2; mannitol, 4.4·10-2; biomass, 0.178, and oxygen, 2.16 mmol· g-1· h-1. An overview of the metabolic pathways analyzed is showed in Figure 2 while the details of the reactions are presented in Table 2.
Analysis of the available data from different sources (Kristiansen and Sinclair, 1978; Kubicek et al. 1979; Jernejc et al. 1992) clearly shows that nitrogen provided by the culture media is insufficient to sustain the reported idiophase biomass levels. On the other hand, it has been also reported that A. niger accumulates ammonium at idiophase (Kubicek et al. 1979; Habison et al. 1979). These contradictory observations can be however reconciled on the light of the observation of an intense proteolytic activity (Ma et al. 1985) and the postulation of a futile NH4+/NH3 cycle, as it has been observed in other biological systems (Kleiner, 1985; Wu et al. 1993). Previous estimations (data not shown) shows that the loss of cytosolic NH3 does not exceed 30 m mol NH4+·g-1·h-1. In order to test the magnitude of fluxes associated with the temptative GABA cycle we computed the ammonium flux from cellular proteins (Section II in Appendix).
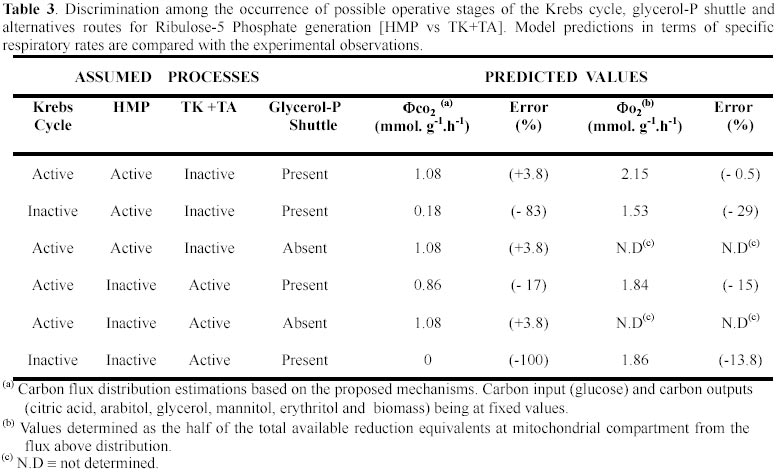
The previous idiophase stoichiometric analysis showed that a significant amount of CO2 is produced. This CO2 can be generated through the activity of three metabolic processes: the HMP (Legisa and Mattey, 1988); the Krebs cycle (Kubicek and Röhr, 1986; Kubicek et al. 1994) or the GABA cycle (Kumar and Punekar, 1997). After the quantitative analysis of GABA cycle (R14 reaction in Table 2) was carried out, it was concluded that it occurs only in a minor extent (Appendix). To discriminate between the two remaining alternatives we evaluated the magnitude of the polyols excretion. Since the erythritol and arabitol excretion are accounted by the model (R3 and R4 reactions respectively, Table 2), the Ribulose-5-P metabolism (Ru-5P) have to be included. At this point two mechanisms could explain the occurrence of this pentose, either a conventional HMP pathway (R2 reaction) or the combined action of transketolases and transaldolases (R5 reaction). Moreover, A. niger excretes glycerol (R11 reaction), suggesting thus that a glycerol-P shuttle would be present (R9 and R10 reactions). That implies that NADH is consumed in the cytoplasm in the reaction transforming DHAP into glycerol-P(c). A minor fraction of this glycerol-P(c) must be transformed in glycerol (R11 reaction) and then excreted while the rest of it will be translocated to mitochondria becoming glycerol-P(m). In the mitochondria, glycerol-P would be transformed into DHAP(m) and transferred to cytoplasm as DHAP(c). The oxidation of glycerol-P(m) to DHAP(m) would be coupled either with the NADH(m) or FADH(m) synthesis. All the above proposed mechanism were tested and compared with the available experimental observations (Table 3). From the above analysis and the fco2 and fo2 rates observed it is concluded that the Krebs cycle, the HMP pathway and the glycerol-P shuttle are operatives at the idiophase. It should be noted that the assumption about an inactive Krebs cycle leads to a marked underestimation of CO2 rate, while the assumption of a non operative glycerol-P shuttle leads to a not feasible scenario due to the balance between production and demand of NADH can not be closed. However, the material
balances alone not allow to conclude which, the NAD+(m) or FAD+(m)
acts as the glycerol-P shuttle acceptor. To clarify this point further energy
balances were required. Hence, the following specific metabolic fluxes were established,
expressed as C-mmol· g-1· h-1: R0:
6.85; R1: 5.57; R2: 1.06; R3: 0.79; R4: 0.094; R5:
0; R6: 0.044; R7: 6.04; R8: 5.776; R9: 3.02; R10:
2.756; R11: 0.264; R12: 4.872; R13: 0.904; R14:
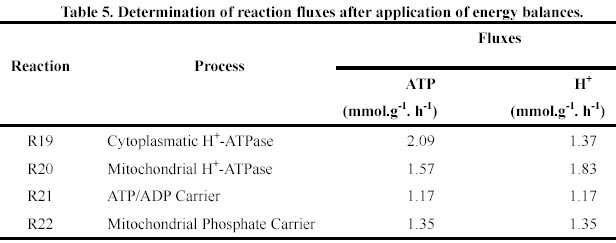
An antiport carrier ATP-4(m), H+(m)/ADP-3(c) (Alberts et al. 1994) through reaction R21 is included in the model (Table 2). The net demand of ATP at the cytoplasmatic compartment is computed by equation [4], while the net rate of mitochondrial ATP synthesis ready to be exported is given by equation [5].
At steady state both magnitudes are equal. This allows us to calculate the cellular maintenance energy (Pirt 1975), m, (equation [6]):
On
the other hand thermodynamic analysis showed that citrate excretion is not an
energy consuming process by itself, but the excretion of their associated proton
(R12 reaction). In fact, the DG (DGcitrate-diffusion
=+3 cal·mmol-1) due to the citrate gradient (4 mM vs. 680 mM; Netik
et al. 1997) would be counteracted by the exceedingly negative D
G (D Gcitrate-electric field=-13.85
cal·mmol-1) associated to the interaction between the citrate anion
and the membrane potential (Dj
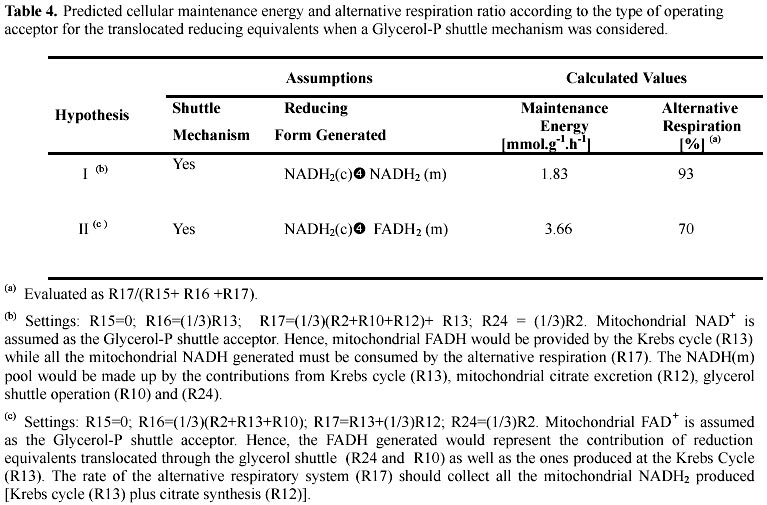
The total respiration rate (fo2) is composed by the oxidative phosphorylation term (R15+R16) and the alternative respiration system term (R17). As the respiration rate takes a fixed value at a given culture time (section (b) of Model set-up), R15 and R16 result a function of the R17 rate. In turn, the total respiration rate (and thus also R17) is a function of the reduction equivalents generated by the operating metabolic pathways. Since the respiration ratio accounted for the alternative respiratory system is known [(R17/fo2) = R17/(R15+R16+R17)], it was used as an additional constraint in order to discriminate among temptative mechanisms. This constraint is important in connecting the energy (ATP) and reductive (NADH/FADH) balances (Appendix). In addition, from the above analysis the cellular maintenance energy and the ATP-ase pumps activities can be determined (Section (d) of Model development). Results are shown in Table 4. The two scenarios in Table 4, were analyzed under the following two assumptions. First, the R15 reaction was considered null because citric acid producing A. niger strains lose the phosphorylating site I at the idiophase (Wallrath et al. 1991; Schmidt et al. 1992). Second, we have considered the occurrence of some transhydrogenase activities (R24 and R13 reactions in Table 2) since the accuracy of the fo2 predicted rates in Table 3 were improved after its inclusion (data not shown). Comparison of the predicted alternative respiratory ratio values with those experimentally measured by Kirimura et al. (1987) showed that hypothesis II is the only one feasible. In this scenario, the estimated coefficient of cellular maintenance was m = 3.66 mmol ATP. g –1· h-1 (Table 4).
Optimization of the citrate rate production An important application of the present approach is it application to the optimization of citric acid rate production. This optimization would imply the improvement of both, the citric acid synthesis (R12 reaction) and its excretion rate (R18 reaction). In turn, each one of the optimum solutions must fulfill either the material as well as the energy constraints. Thus, the first step in the optimization procedure is the definition of such constraints. Equation [7] determines an upper bound to citrate synthesis based in carbon availability as obtained from the cytosolic pyruvate mass balance.
Moreover, an independent constraint based in energy considerations can be obtained from the cellular maintenance energy equation [6], as is presented in equation [8]:
As R8 depends on R1, R2, R6 and R7 we can accordingly rewrite equation [8] as equation [9]. In this form equation [9] summarizes both, the carbon and energy constraints.
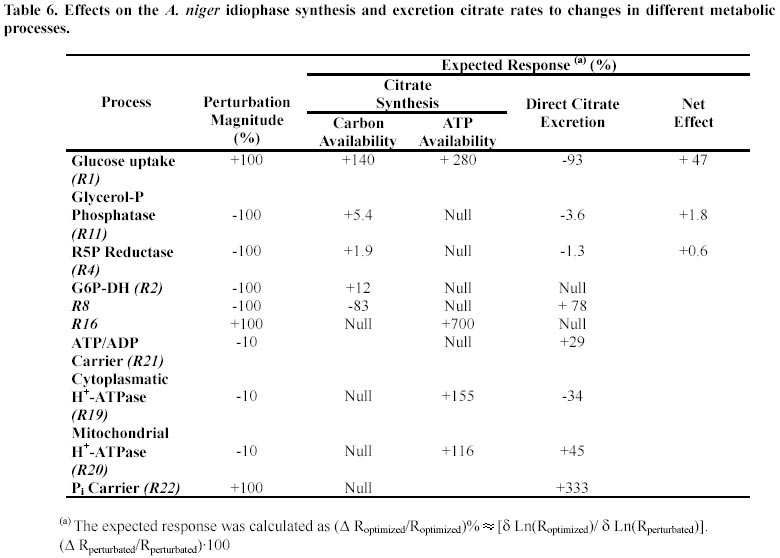
Examination of equation [7] suggest three strategies leading to increases in citric acid synthesis rate: i) To increase the glucose uptake; ii) to decrease the biosynthesis rate of by-products (i.e. polyols), and iii) to decrease fluxes diverting mass from the pathway leading to citrate precursors, namely, the biomass synthesis (f x) and the Krebs cycle (R13). On the other hand, it can be clearly seen from equation [9] that the synthesis of citric acid (R12) describes not only a carbon consuming process but also an energy consuming one. Consequently, it would be expected R12 be improved either by a higher ATP availability from oxidative phosphorylation (R15/R16) or by a diminished activity of H+/ATPases (R19/R20). Regarding equation [9], the influence of both, glucose uptake and polyols excretion was already commented in relation to carbon availability. In addition this equation serves to interpret the beneficial effect of reducing the polyols synthesis in terms of the consumption of reductive power and the subsequent diminished ATP availability. From this same equation it can be seen that the Krebs cycle (R13) would have a dual effect, a bigger and positive one as a source of FADH and ATP and a quantitatively less important but negative one due to the carbon loss as CO2. An upper bound for citrate excretion can be derived from the mass balances of cytosolic citrate and cytosolic H+ as it is showed in equation [10]. Here, it is worthwhile to note here that citrate excretion is not an energy consuming process by itself but their associated H+ transport processes.
Other interesting relationship that can be drawn is expressed by equation [11]. It comes from the fact that the mitochondrial Pi uptake (R22) can be expressed as a function of the mitochondrial H+-ATPase pump activity (R20), while the R8 reaction can be expressed in terms of the R1, R2, R6 and R7 fluxes:
This set of constraints allows us to find out which changes will lead to improvements in citric acid production rate. In Table 6 the results obtained from these explorations are showed. Discussion Any non trial and error optimization design could only be accomplished from a consistent picture of the cellular physiology. In this work we have made some progress on the understanding of the biochemical basis of idiophase metabolism, the citric acid producing stage of A. niger. The model allowed us to quantify the carbon flux distribution through some of the main metabolic processes present (HMP pathway: 16%; Krebs cycle: 13%; citrate synthesis: 71% expressed as fraction of carbon uptake). We concluded that a GABA cycle can not have a significant influence on citric acid productivity. This finding have been supported by Kumar et al. (2000). On similar basis the negligible energetic importance of an NH4+/NH3 futile cycle was established. The model strongly suggests an important role for a glycerol-P shuttle (ATP balances section). Together to the Krebs cycle, it would provide the FADH(m) that the cells divert toward oxidative phosphorylation (R16). All the NADH(m) is re-oxidized by the alternative respiration system without ATP gain (R17) since the phosphorylating site I is inactive at idiophase. In fact, the cytoplasmatic R8 reaction would provide 58% of the total ATP produced, either directly (substrate phosphorylation) or indirectly (NADH(c) transformation to FADH(m)) which represents an unusually high ratio for an aerobic process. In this way cells are able to minimize the miss-match between the reductive and ATP balances observed at the citric acid synthesis stage. Hence, according with our model the citric acid synthesis (R12 in Table 2) would produce up to 43% of the total NADH but consuming only 12% of the total ATP. These unbalances implies thus the operation of some redox regulatory mechanism in order to maintain an steady state. Our model support (Appendix, section IV) the claim by several authors (Kubicek et al. 1994; Kristiansen et al. 1998) that some reductive equivalents are consumed either as polyols or through the alternative respiration system. Another model finding refers to the importance of H+-ATPases. They seems to be the main ATP demanding process, consuming up to 55% of the ATP. The rate of ATP demand for cellular maintenance was determined as 3.7 mmol ATP.g-1· h-1. The present work constitutes an attempt to design optimization strategies of the citric acid production rate in A. niger by integrating in a mathematical framework the most relevant aspects of the A. niger physiology. In this regard the most noticeable finding was the identification of the glucose carrier (R1 reaction) as the most suitable step as target for a up modulation. Table 6 shows that the two-fold up modulation of the glucose carrier activity will cause an 45% increase in the citric acid productivity. This prediction has been made on the assumption that the glucose uptake is coupled with the transport of H+ through a symport mechanism (Warnacke and Slayman, 1980; Nicolay et al. 1983). If, as it has been recently claimed (Wayman and Mattey, 2000) the glucose uptake is not coupled to an H+ flux, the increase in citrate rate production would be even greater. But this is not the only transport process suitable for citric acid rate improvement. Our exploration showed that increases in the mitochondrial phosphate carrier activity (R22) would enhance the citric acid rate production (Table 6). The main factor underlying this effect is the enhancement on the ATP availability. Thus, while the activity of cytoplasmatic H+-ATPase will be diminished, the mitochondrial ones should be more active. Since the mitochondrial pump is energetically most efficient (section (d) of Model development) a net ATP saving can be expected. Others perturbations based in the blocking of some diverting fluxes, i.e. the HMP pathway (R2) or the excretion polyols, mainly glycerol (R11) and arabitol (R4), have been shown to have null effect on the citric acid production. Reported failures to increase A. niger citric acid production by overexpression of one enzyme (citrate synthase; Ruijter et al. 2000) or two enzymes (phosphofructokinase and pyruvate kinase; Ruijter et al. 1997) are in agreement with our model predictions, since not any one of these enzymes are pinpointed as flux controlling steps. On the other hand the big flux control showed by the glucose carrier is in agreement with conclusions arising from other model developed (Alvarez-Vazquez et al. 2000). In their approach Alvarez-Vasquez et al. showed that in order to attain significant increases in citric acid rate production at least 12 additional enzyme modulation are required. This discrepancy can be explained in terms of the inner differences in the modeling strategies as well as in terms of the different underlying physiological assumptions. Regarding the first point, it should be stated that the optimization scenarios considered are not the same. While the Alvarez-Vasquez et al. model predictions were referred to a broader range of changes (up modulation of enzyme activities of 1-50 times the basal values), in the present one those changes do not exceed two times the basal values. Other features present in the current version that help to explain the observed results differences refers to the recognition of the fact that A. niger idiophase is not an unique physiological steady state; the distinction made between the two different H+-ATPases pools; the compartmentalization of the ATP, NADH, FADH and H+ pools; the linkage of each H+ pool to the activity of antiport and symport carriers; and the independent consideration of the NADH and FADH consumption through in respiration (R15, R16, R17 reactions) that includes variable ratios of (P/O) efficiency. In contrast with other optimization solutions (Alvarez-Vasquez et al. 2000) the implementation of the optimum solutions through genetic changes are, in the preset case, much more feasible. The first change to be explored in order to seek an improvement of production rate is the overexpression of the glucose carrier (R1). By the same token the overexpression of the mitochondrial phosphate carrier activity (R22) would enhance the citric acid rate production. These type of genetic changes have not been carried out yet, but they are well available with the current DNA recombinant techniques in the A. niger citric acid production realm (Verdoes et al. 1994; Yu et al. 2000). The glucose carrier have been characterized (Torres et al. 1996) and we are currently working on the characterization of the mitochondrial transport steps. We are confident that the availability of the relevant information on the transport steps and the conclusions derived from this integrative model approach will encourage in the near future the directed optimization of the process through the overexpression of few, selected metabolic steps. Finally, it is our view that any rational design of optimization strategies of biotechnological processes should be based on predictions from well-developed models. In the present case the model integrates the available information about the biochemistry of A. niger idiophase while in conditions of citric acid production. The current model set-up provides us not only with an better understanding of the A. niger metabolism, but also with rational strategies for the optimization of the process. Appendix
Polyols. For macroscopic analysis a simple process representation was obtained by substitution of the overall set of excreted polyols (Röhr et al., 1987) for an unique formula equivalent. The mean composition used was [CH2.54O]n, n=3.72 since the average composition of polyols showed minor variations among the different idiophase stages (data not shown). This expression is a weighted average of the elementary composition of all polyols involved, considering as weight factor their own excretion rate. However, when the balance of intracellular fluxes was done, individual polyols were considered. Macroscopic rates were calculated by means equation (A.1) where f stands for fluxes (in C-moles. g-1. h-1) of medium exchanged compounds .
Oxygen. Reductance balance was used to the determination of the oxygen yields at the idiophase stages considered in the model: early, medium (A.2) and late (A.3). In these equations f stands for fluxes (in C-moles.g-1.h-1) between cell and medium, while g stands for the reductance grade.
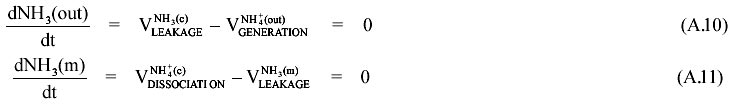
II. Determination of the rate of GABA cycle At the early idiophase the NH3/NH4+ pool is considered at steady state (free diffusion). This fact, together with the absence of nitrogen at the culture medium allows us to write down the following mass balance equation:  The balance equations for the extracellular (A5), cytoplasmic (A6) and mitochondrial compartments (A7) are the followings:
By summation of equations A5-A7 we obtain (A.8), suitable for the R14 reaction.
Following the same procedure we can write the corresponding equation for NH3 in each compartment:
From equations (A.9) to (A.11) we obtain (A.12):
By substitution of A.12 in A.8 we finally obtain:
III. Energy Balances Assuming a steady state the H+ balance equation
allows us to write equation A.14:
Analogously, the mitochondrial ATP balance
allows us to write equation A.15:
By substituting equation A.15 into A14 we obtain the uptake rate of mitochondrial Pi:
From the mass balance for cytoplasm Pi, we obtain A.17:
By substitution in A.17 of A.16 we obtain A.18:
That together equation 6 (see Energy balance section in the main text) we finally obtain A.19, that allow us the determination of the H+-ATPase rates.
After evaluation of R19 and R20 it can be determined the values for R21 and R22.
The alternative respiration fraction can be envisaged as a consequence of an imbalance between the energy and reductive mechanisms. Only if the oxygen demand based in ATP is equal to the oxygen demand from the reductive equivalents, all the respiration rate would be ATP associated. Hence, for conservation of ATP equation A.20 must be fulfilled, ao, ax, ap standing for ATP yields of respiration, biomass and citric acid respectively; f being the corresponding specific productivity respectively and m the ATP cellular maintenance as defined in equation (6) in the text.
On the other hand, equation A.21 must be satisfied by the reductive equivalents. The subindex i refers to any product different but biomass that consume or produce NADH, NADPH or FADH. aoH, axH refers to yields in reduction equivalents for oxygen and biomass respectively. Accordingly the following expression (A.22) is derived for the ratio of the alternative respiration system rate, which equivalent to the previously presented for the alternative respiration ratio [R17/(R15+R16+R17].
References
Supported by UNESCO / MIRCEN network © 2001 by Universidad Católica de Valparaíso -- Chile The following images related to this document are available:Photo images[ej01002f2.jpg] [ej01002t4.jpg] [ej01002t6.jpg] [ej01002f1.jpg] [ej01002t3.jpg] [ej01002t1.jpg] [ej01002t2.jpg] [ej01002t5.jpg] |
| |||||||||


 0.02; R23: 0.264. This flux distribution shows that that the HMP pathway
accounts for up to 16% of the carbon-glucose uptake, the Krebs cycle accounts
up to 13% while the remaining 71% would be accounted by citric acid synthesis.
0.02; R23: 0.264. This flux distribution shows that that the HMP pathway
accounts for up to 16% of the carbon-glucose uptake, the Krebs cycle accounts
up to 13% while the remaining 71% would be accounted by citric acid synthesis.


