 |
| About Bioline | All Journals | Testimonials | Membership | News |
|
||||||
|
||||||
Electronic Journal of Biotechnology, Vol. 5, No. 2, August, 2002 SHORT COMMUNICATION Biodegradation of two commercial herbicides (Gramoxone and Matancha) by the bacteria Pseudomonas putida Maria Kopytko*1, Graciela Chalela2 and Fernando Zauscher3 1Facultad de Ingeniería
Ambiental, Universidad Pontificia Bolivariana, Apartado Aéreo 2932, Bucaramanga,
Colombia Tel: 57 7 6448445 Fax: 57 7 6448445 E-mail: mkopytko2001@yahoo.com
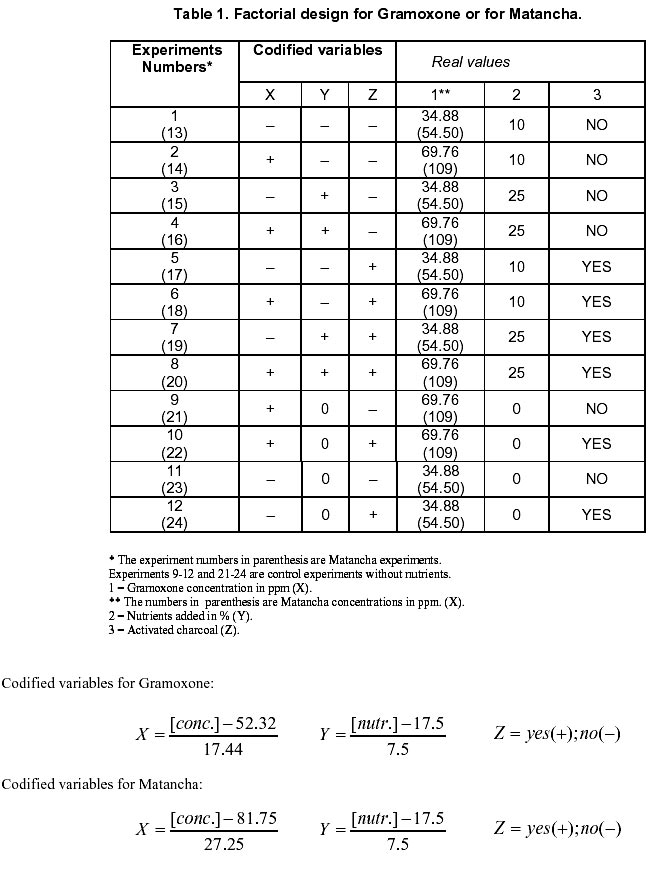
Financial support: Research Division of the School of Science, Universidad Industrial de Santander, Bucaramanga, Colombia. Received October 11, 2001 Code Number: ej02029 Abstract The purpose of this project was to evaluate the biodegradation of two commercial herbicides (Gramoxone and Matancha) by the bacteria Pseudomonas putida. Gramoxone’s active ingredient is Paraquat (1,1’-dimethyl-4,4’-bipyridylium) and Matancha’s is 2,4-D (2,4-dichlorophenoxiacetic acid). To carry out the biodegradation experiments, a factorial design 23 was executed, where the independent variables were: herbicide concentration, nutrient concentration and the use or no use of activated charcoal (AC) in the same experiment with bacteria. Duplicate experiments were performed for a period of three days using 500 ml bioreactors. The best results obtained when no AC was used were: 47,29% degradation for Gramoxone (by UV/VIS) and 68.72% for Matancha (by HPLC). The treatments carried out with the use of AC for either of the two herbicides gave more than 95% degradation at 72 h. In fact, under these conditions most of the experiments showed at least a 90% removal at 24 h. It is clear that the dual combination of adsorption by AC and biological activity by the bacteria was very effective, in particular when at least 10% nutrients were added. The statistical study of the results showed that AC is a highly significant variable, and that there are significant interactions between the three variables used in the experimental design. The application of these experiments to wastewater (COD = 584.11) confirmed that it is possible to remove more than 90% of either of these herbicides in a 24 h period. Keywords: 2,4-dichlorophenoxiacetic acid, activated charcoal, biodegradation, Gramoxone, herbicides, Matancha, paraquat, Pseudomonas putida. Article The chemical formulation of a commercial herbicide requires an active ingredient, which in the case of Gramoxone is Paraquat and for Matancha is 2,4-D. These herbicides are part of a group of bioresistant compounds, which are not biodegradable by the environment or by conventional treatment in water purification plants. When a pesticide enters the soil some of it will adhere to soil organic matter through the process of adsorption, and some will dissolve in water between soil particles. By rain or irrigation, the adsorbed pesticide may become detached from soil by desorption. The solubility of a pesticide and its adsorption capacity to soil particles are inversely proportional, (Bicki, 1989). Gramoxone has a persistent half-life of more than 100 days and a partition coefficient of 4.46. Therefore, this compound has a high groundwater contamination potential. Matancha (or its active ingredient) has a half-life of less than 30 days and a small partition coefficient (32.0). Thus, its potential for groundwater contamination is moderate (PMEP, 2001). The bacteria Pseudomonas has multiple applications; in particular, it is known for its capacity to degrade phenolic compounds (Hughes and Cooper, 1996) and other aromatic substances (Eaton and Seliefonov, 1996; Park et al. 1999). To degrade phenol, P. putida immobilized in calcium alginate was used to study the effect of the following operating conditions: initial phenol concentration, initial cell loading and alginate gel loading. The degradation time was found to increase initially and then reached a stationary value (Banerjee et al. 2001). Four variables at 3 levels were studied in a Box-Behuken design for phenol degradation with the same bacteria. The optimum conditions found were: maltose (0.052 g/l), phosphate (8.97 g/l), pH = 7.9 and temperature (31.5ºC) (Annadurai et al. 1999). The addition of conventional sources of carbon (sodium glutamate and glucose) enhances the biodegradation of phenol with P. putida, when 4-chlorophenol (a non growth substrate) is present (Loh and Wang, 1997). The effectiveness of treatments which combine physicochemical and biological systems to remove toxic and hazardous compounds from liquid industrial waste has been reported (Erickson et al. 1994). These studies used sequencing batch bioreactors (SBRs) with the addition of activated charcoal to obtain a percent of removal higher than 95%. A strain of P. putida adapted very well to the SBRs and was added to the microbial mixture to get a 99% degradation. The concurrent dual organic removal mechanism of adsorption and degradation of persistent compounds improved treatment performance (Timmins et al. 1988). A granular activated carbon biological fluidized process was used to treat landfill leachate containing organic materials with typical COD values in the range 800 to 2700 mg/l, and high concentrations of ammonia (220-800 mg/l). This process offers a highly effective option for the biological removal of ammonia with the additional advantage of a good COD removal (Horan et al. 1997). In another report, the addition of powdered activated carbon (PAC) caused a significantly improved settling of the activated sludge, reducing the sludge-volume index and decreasing the organic halogen content from municipal wastewater by 24%. No evidence of a synergistic effect of the PAC addition to activated sludge, nor regeneration of the PAC, was observed. This suggest that the observed effects probably are caused only by simple adsorption (Bornhardt et al. 1997). In this report we show and discuss the result of the individual treatment by Pseudomonas putida of a water solution of each herbicide and the effect that activated charcoal (AC) has on stimulating the degradation process. The idea is to obtain more scientific information about water treatment, when it has a high level of any of these herbicides, which are currently in use in Colombia. Materials and Methods Media and growth conditions. Pseudomonas putida strain supplied by Centro de Innovación en Biotecnología Industrial from their microorganism collection was initially incubated in nutritive agar at room temperature for 24 h and was later identified and characterized. The bacteria was then adapted to the modified medium using gradually increasing concentrations of each herbicide (3, 5, 10, 20, 50 and 100 ppm). The nutrient medium was decreased to 50%, 25% and 10% gradually. Samples were taken periodically during this process to follow the bacteria’s growth. The liquid nutrient used for the bacteria was Merck’s medium 1.05443 and for the solid medium Merck’s nutrient agar 1.05450 was used. Distilled water was used to prepare the working solutions under aseptic conditions. The herbicides were purchased from a local dealer in a 1 l. container each. Growth kinetics. A fresh culture of the bacteria in a modified media with each herbicide was incubated during 18 h under continuous air supply and stirring. From these two cultures, six inoculum were taken for the kinetic experiments, which were carried out in 500 ml Erlenmeyer flasks containing 250 ml working solution, with continuous stirring and air supply, under aseptic conditions. An addition of 25% nutrients was made to each experiment. A control experiment with 25% nutrient and no herbicide was performed for each case. The initial cell concentration was 2.6x10⁶ cells/ml. Samples were taken every two h during a 24 h period to follow the bacterial growth. The number of cells was determined with a Neubauer-type haemocytometer, preparing a 1:1000 dilution in sterile water. Experimental design and analysis. A 23 factorial design (Box et al. 1978) was used to carry out the biodegradation experiments, which ended after 3 days (Table 1). The independent variables were:
The highest herbicide concentration used corresponds in both cases to the concentration recommended by the manufacturer. The lowest concentration was equal to the highest divided by 2. The weight of AC used in all cases was 15 g/l. The AC had a 1.18 mm diameter and was purchased from a local factory. The dependent variable H (response) was the percentage of biodegradation. The residual Gramoxone was detected at 257 nm using a UV/VIS HP 6890 Spectrophotometer with a Microsoft Chemstation. For Matancha a Perkin Elmer HPLC was used, which was equipped with a diode detector Array 235C and a Lichrosorb RP-18 (5 :m) column. The programming method for HPLC analysis was the following:
The percentage of solvents was changed as follows:
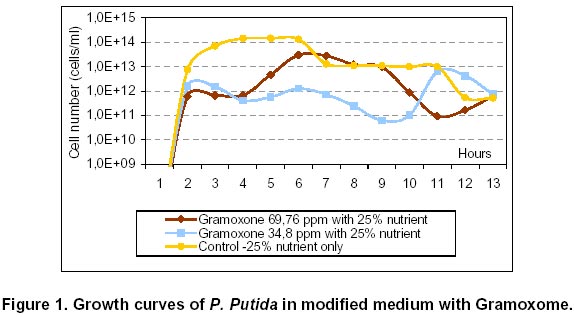
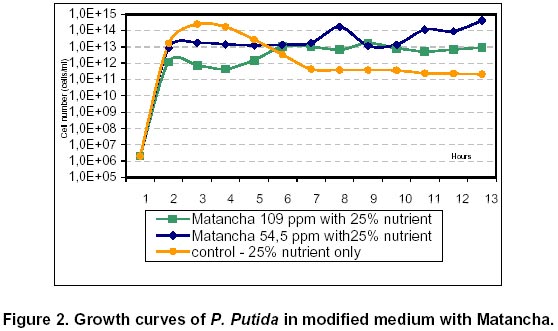
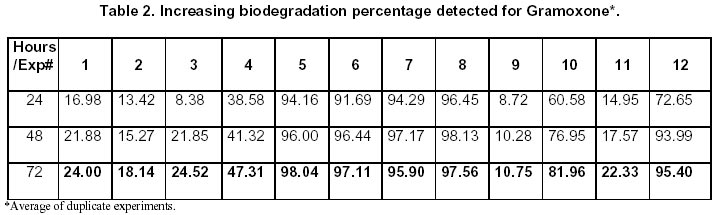
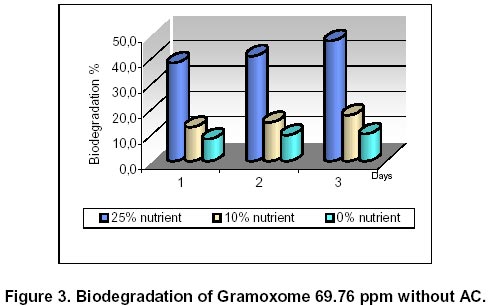
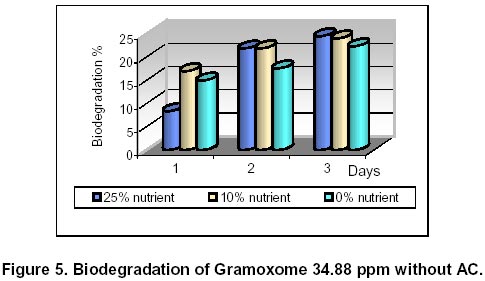
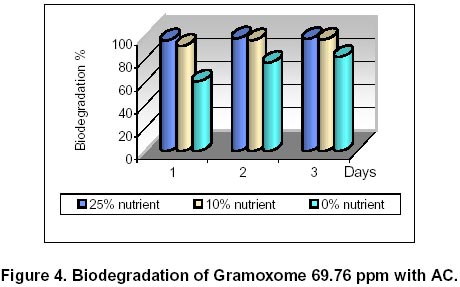
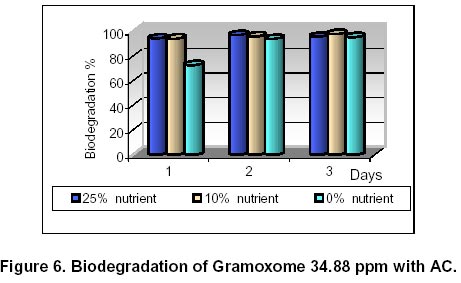
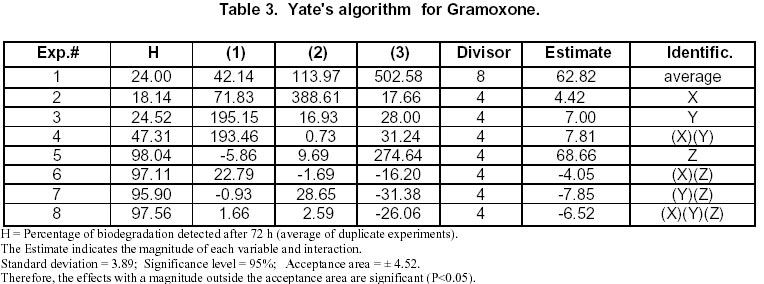
A calibration curve was previously elaborated for each analytical procedure. The data represent the average of duplicate experiments. An initial inoculation of 2x10⁶ cells was used for each experiment. To measure the bacterial growth, the optical density (OD) of each sample was determined at 540 nm using a spectrophotometer Spectronic 20D (Milton Roy) and related to a standard curve previously obtained using the McFarland scale. No additional experiments with AC and no bacteria present in the medium with herbicide were performed because the idea was to determine the effectiveness of the combination of the biological and the physicochemical processes to the future design of a water treatment plant. A series of six additional experiments for each herbicide were performed with dead cells of this bacteria to check for a possible adsorption by these cells. These experiments were carried out as described for the experimental design, except that once the media was inoculated, the solution was sterilized during 18 h. The chemical analysis was performed as explained above. No AC was used in these experiments. Four experiments (two sets of duplicates) were carried out later for each herbicide using wastewater from the Rio Frio Treatment plant in Girón, Colombia. The same two levels of herbicide indicated above were used here, with or without addition of AC. No nutrients were added. The wastewater was used as taken from the plant with no previous treatment or dilution. The water was sterilized by autoclave, then the herbicide was added and the sample was inoculated with the bacteria. The working volume was 250 ml and the initial inoculum was 2.0x10⁶ cells/ml. The same analytical methods as described above were used to measure the bacterial growth and the degradation percentage. It must be pointed out that the wastewater used is of the domestic type, which is characterized by a high percentage of organic matter, but is not contaminated by herbicides, because these compounds are not used in the city. The purpose of these experiments was to determine possible growth of the bacteria when the only nutrient is the organic matter present in the wastewater and also to simulate a situation in an agricultural area, where the water is contaminated with this type of chemicals. The usual treatment in a water treatment plant is effective in partially eliminating the organic matter but does not remove the herbicides because the bacterial consortium does not have this capacity. Therefore, the inoculation of P. putida may be helpful in this aspect. Results and Discussion Bacteria characterisation and adaptation The gram-negative P. putida was identified by its morphology (short motile straight rods, polar flagella), size (0.5-1.0 by 1.5-4.0 μm) and biochemical reactions (Oxidation-fermentation, urea, citrate, LIS (Lisine-Iron), TSI (Three Sugars and Iron), VP (Voges and Proskauer), MR (methyl red), SIM (sulfur-indol-mobility), Nitrites and gel hydrolysis). No growth was observed at 41ºC. From these results the identity of the bacteria was confirmed as Pseudomonas putida (Palleroni, 1984; Smitbert and Krieg, 1994). During the process of adaptation, a green-blue pigment was noticed on the modified medium, specially in the first phase. In the presence of 100 ppm. Gramoxone, the bacteria was greatly stressed and its growth was slowed in consequence. The bacteria changed its normally rod-shaped morphology to that of a coccus when there was an increase in the herbicide concentration, specially when no nutrient was added. However, this change was temporary, because the cells recovered the original rod form after a few days. Much more difficulty was observed when adapting the bacteria to the modified medium with Gramoxone than with Matancha. Growth kinetics When comparing the kinetics for Gramoxone, it is clear from Figure 1 that the bacteria grows faster and to a higher number of cells, when the herbicide concentration is the highest. The maximum count was 3.0x10¹³ cells/ml at 10 h. The growth for the lowest concentration is very slow; the maximum cell count (6.3x10¹²) was achieved at 20 h. On the other hand, the control experiment (no pesticide) reached a cell count of 1.4x10¹⁴ at 6 h. This result is an indication of the difficulty that the microorganism has to adapt to this type of herbicide. But once it is adapted to a higher concentration, it grows very well. The growth of P. Putida in the medium modified with 54.5 ppm Matancha (Figure 2) is the best of all for this pesticide (1.6x10¹⁴ cells/ml at 14 h). However, it decreases slightly until finally it reaches 4.0x10¹⁴ at 20 h. The control experiment shows a maximum growth in a shorter time (1.6x10¹⁴ at 6 h). Gramoxone biodegradation The residual concentration of Gramoxone after treatment with the bacteria was initially determined by HPCL, but this method was discarded because there was interference in the chromatogram with the secondary products formed by the process. Therefore, the UV/VIS method was used. When no AC was present (Experiments 1-4, Table 2), the best result after 72 h was 47.29% degradation (Experiment 4), where 69.76 ppm of herbicide and 25% nutrient were added to the medium (Figure 3). In this experiment, the biodegradation was 38.59% the first day and increased to 41.32 % the second day. When 10% (Experiment 2) or 0% (Experiment 9) nutrient were added, with the same level of herbicide, the results were less than 20% degradation. It is apparent that in these experiments the nutrient is enhancing the degradation process. The lesser the nutrient that is available for the bacteria, the lower degradation results. On the basis of the data presented in Table 2, these three experiments reached during the first 24 h nearly 80% of the total degradation observed. Later, the process becomes slow, specially in Experiment 9, where the increase in the last day is less than 5%. With a 34.88 ppm concentration of the herbicide the results were very similar, near 24% (Experiments 1 and 3, Table 2). In other words, the percentage of nutrient present makes no significant difference in this case. This is confirmed by Experiment 11, with 0% nutrient, which gives a 22.33% biodegradation (Figure 5). It is apparently a surprising result, compared to the experiments that have a higher herbicide level, where the nutrient was an important factor as noticed above. However, Experiments 1 and 11 give a higher degradation percentage than their counterparts Experiments 2 and 9, respectively. There is not a clear reason to explain why the result of Experiment 3 is only about half of Experiment 4, specially when by OD the number of cells of these two experiments at 72 h were similar (1.8x10⁷ cells/ml). Nevertheless, it was noticed during the kinetic study that the cells grew faster during the first 12 h when the level of Gramoxone was higher, and that is probably what determines the observed result. When AC was used in the experiments for Gramoxone (Experiments 5-8, Table 2), the percentage of herbicide removed was more than 95% (Figure 4 and Figure 6). The results for the control experiments (Experiments 10 and 12), when no nutrient was present, show a high removal, although Experiment 10, with the highest pesticide concentration, gives only 81.96%. Obviously, the combination of the biological process done by bacteria and the physicochemical process performed by AC is crucial in the removal of the herbicide. The dual action of these two mechanisms is so powerful that Experiments 5 – 8 show more than 90% removal during the first 24 h (Table 2). Regarding the bacterial growth, the OD showed that the number of cells/ml was the highest (from 1.8x10⁷ to 7.4x10⁷) after 3 days, in the four experiments using a 25% nutrient (Experiments 3, 4, 7 and 8). It is important to notice that the bacterial growth in these experiments is similar whether the AC is present or absent in the solution, which may indicate that the biodegradation process is done independently of an adsorption process by AC. The OD decreased slightly when the amount of nutrients was 10% (Experiments 1, 2, 5 and 6). It should be noted that the OD analysis was performed with no interference in the experiments using AC, because once the stirring stops in the solution in order to take the sample, the AC goes to the bottom of the flask. The optical density decreased sharply in all the control experiments (Experiments 9-12), specially for Experiment 12, with AC present in the solution. The initial number of cells (2.0x10⁶) decreased to 5.2x10⁵ after the first day and at the end of 3 days no cells were detectable. The explanation of this result may be that the AC has a very high retention of material and the cells can not grow because the amount of nutrients is very limited in the solution (0% nutrients). Since Experiment 12 gives 95.40% degradation, it seems that the removal of the pesticide apparently occurs mostly by adsorption from AC, with intervention from the bacteria only at the very beginning of the process. In fact, this experiment reached a 72.65% removal after 24 h and 93.99% after 48 h of treatment (Table 2). Yate´s algorithm was used to determine the magnitude of the single, double and triple effects (Table 3). The statistical data indicates that the following effects are significant (P<0.05):
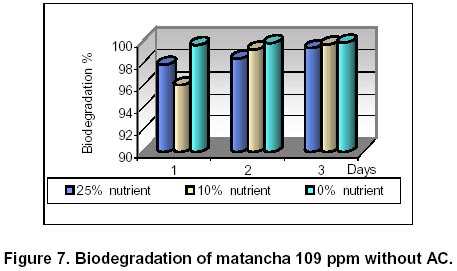
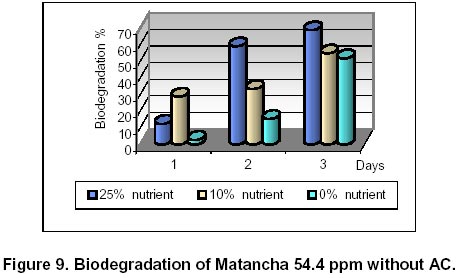
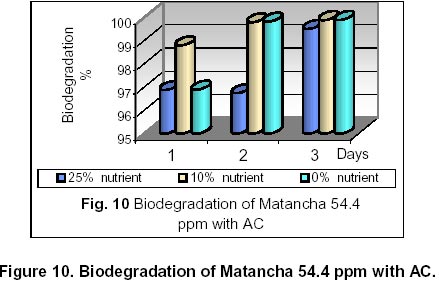
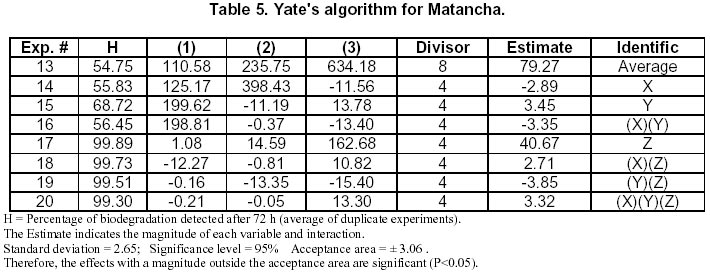
This data indicates that it is a complex system where many effects take place simultaneously. Even though the herbicide concentration is not a significant factor by itself, it interacts with the other two variables. The result of most practical interest is the high removal when AC is used, which indicates that the combination of an adsorption mechanism by AC and the biological activity of P. putida to degrade Gramoxone, achieves more than 90% removal after 72 h of treatment. If 10 to 25% nutrients are added to the solution at the beginning of the process, a decrease of more than 90% of the herbicide should be expected during the first 24 h. Matancha biodegradation In the experiments without AC, the biodegradation of 109 ppm herbicide (Figure 7) increases gradually from the first to the third day, when it is around 56% for both experiments (Experiments 14 and 16, Table 4). It is interesting to notice that when no nutrient is used (Experiment 21), the bacteria gradually degrades the chemical, to give a similar result as when nutrient is present. The OD analysis gave also similar results in regard to the cell growth. This indicates that the bacteria adapted very well under these conditions and there are no limitations when the amount of nutrient added is low. If the amount of herbicide is 54.5 ppm (Experiments 13 and 15, Table 4), the degradation is a little bit higher, specially with 25% nutrient (Figure 9). This is the best result of all the experiments done without AC. For control Experiment 23, the degradation during the first 24 h is only 2.74%, which indicates that the bacteria is adapting very slowly to this situation. Then, from the second to the third day there is a 70% increase, which means that the cells then grow with almost no inhibition. However, there is a 16.9% difference with Experiment 15 (25% nutrients) at 72 h. Thus, when the level of herbicide is lower, the bacteria needs some nutrients to grow, otherwise the process becomes very slow. When the process was done in the presence of AC (Experiments 17 - 20, Table 4) the removal of Matancha was remarkably high (near 100%) at the end of all treatments (Figure 8 and Figure 10). In fact, it is higher than 95% after the first day. The nutrients in this case make no difference. Again, the AC is a definite factor to increase the amount of herbicide removed. A similar result was obtained in the control experiments (Experiments 22 and 24), where the decrease in herbicide was very high, although no nutrients were added. The OD in these experiments always showed a constant growth, even in the experiments with 0% nutrient, which indicates that the bacteria adapted very well to the modified medium and there is no interference from the AC. However, Experiment 22 was an exception, because at the end of 72 h. it showed a lower number of cells (1.6x10⁶) than the initial inoculum. It is somewhat similar to what was explained above for Experiment 12, where the number of cells decrease at 72 h, but a very high removal was observed. The explanation given above for Experiment 12 may apply here too, namely that the biological mechanism takes place mostly during the first 24 h of treatment. In fact, this experiment shows (Table 4) a 99.66% removal at 24 h. Yate´s algorithm to calculate the magnitudes of the different factors that intervene in this process is shown in Table 5. After the calculation of the standard deviation and the acceptance area, the following factors are significant (P<0.05):
Again the herbicide concentration was not a significant factor, but it interacted with the other two variables. Thus, the effect of the single variables should be considered jointly. All the experiments where AC was used showed very high removal, even with 0% nutrients. The experiments under these conditions showed more than 95% removal at 24 h, when apparently the dual action of adsorption and biodegradation had taken place. Experiments with dead cells Three experiments were performed for each level of herbicide during 72 h using 25, 10 and 0% nutrients. Samples were taken every day to control the degradation. The results for Gramoxone showed that the higher degradation (2.13%) at 72 h occurred when 25% nutrients were added. Lower percentages of nutrient gave much lower degradation. In the case of Matancha, the results were 2.80% for the higher concentration (109 ppm) and 4.48% for 54.5 ppm, when the level of nutrients was 25%. With 0% nutrient the results were near 3.0%. This result indicates that a very low percentage of degradation is performed by dead cells of P. putida, regardless of the amount of nutrient present in solution. The cells used grew in the modified medium with each herbicide, but were not previously washed. Therefore the observed degradation may be due to either the intrinsic degradation of the herbicide or to the external enzymes which may be present in the unwashed cells or to a combination of both factors. Application to wastewater The COD analysis of the wastewater gave the following average results in mg O2/l:
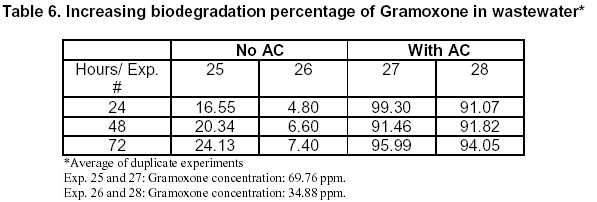
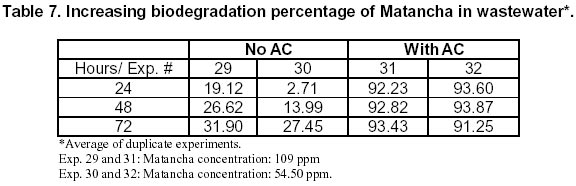
These values show that the wastewater is highly contaminated by organic matter, and also that the nutrient by itself produces a high COD. The results obtained for the degradation of Gramoxone present in wastewater are shown in Table 6. The highest removal percentage was obtained when AC was used (Experiments 27 and 28). In these two experiments the removal was more than 90% at 24 h of treatment, which is a very interesting result, taking into account that no nutrients were added and that this water was highly contaminated. If no AC was used, the results went down to 24.13% when the herbicide concentration was 69.76 ppm (Experiment 25) and to 7.4 % when the concentration was 34.80 ppm (Experiment 26). It must be pointed out that no previous cultures of the bacteria were made with this water. The inoculum was taken directly from the culture used before for the experiments with distilled water, so the cells adapted very well and quickly to the new environment. Under these conditions, the degradation when no AC was used is much lower compared to the results obtained above for Gramoxone (Table 2). But with AC present, the results were similar, regardless of whether the medium is prepared with distilled water or with wastewater. The experiments with Matancha (Table 7) show that a removal higher than 90% at 72 h was obtained when AC was used (Experiments 31 and 32), and only 31.90% and 27.45% when no AC was present (Experiments 29 and 30, respectively). Again, the removal was higher than 90% at 24 h when using AC. This result is similar to those reported above when distilled water was used. The OD analysis for both herbicides showed a good bacterial growth in all the experiments. In particular, the cell number increased one order of magnitude at 24 h, and stayed more or less constant at that level, whether AC was present or absent in the solution. These results confirm that it is possible to remove more than 90% of either of these two herbicides in 24 h when AC is added to the aqueous solution. It makes no difference whether the water is distilled or wastewater. In the case of the former, an addition of at least 10% nutrients gave better results. References
Supported by UNESCO / MIRCEN network © 2002 by Universidad Católica de Valparaíso -- Chile The following images related to this document are available:Photo images[ej02029t6.jpg] [ej02029f2.jpg] [ej02029f3.jpg] [ej02029t7.jpg] [ej02029t3.jpg] [ej02029f5.jpg] [ej02029f9.jpg] [ej02029f1.jpg] [ej02029t2.jpg] [ej02029t4.jpg] [ej02029f4.jpg] [ej02029f6.jpg] [ej02029f7.jpg] [ej02029t1.jpg] [ej02029f8.jpg] [ej02029f10.jpg] [ej02029t5.jpg] |
| |||||||||
