 |
| About Bioline | All Journals | Testimonials | Membership | News |
|
||||||
|
||||||
Electronic Journal of Biotechnology, Vol. 6 No. 3, December 15, 2003 Effect of the production or use of mixtures of bakers’ or brewers’ yeast extracts on their ability to promote growth of lactobacilli and pediococci Claude P. Champagne*1, Hélène Gaudreau2, John Conway3 1Food Research and Development Centre,
Agriculture and Agri-Food Canada,
3600 Casavant Blvd. West,
Saint-Hyacinthe, Québec, J2S 8E3 Canada
Tel: 450 773 1105
Fax: 450 773 8461
E-Mail: chamgnec@agr.gc.ca Received February 6, 2003 / Code Number: ej03023 Abstract Three brewers’ and three bakers’ yeast extracts (YE) were obtained from five commercial suppliers. They were added to microbiological media and their growth-promoting properties were examined using four lactic cultures (Lactobacillus casei EQ28 and EQ85, Lactobacillus acidophilus EQ57, Pediococcus acidilactici MA18/5-M). Bakers’ YE have a higher total nitrogen content than brewers’ YE, but there was not always a correlation between the nitrogen content and growth. A systematic preference for bakers’ YE over brewers’ YE was only encountered with Lb. casei EQ85, but the other lactic cultures had variable reactions to the source of YE. With Lb. casei EQ85 and Pc. acidilactici 17/5M, mixing of the two sources of YE gave progressively higher growth as a function of the content of the better YE. With Lb. acidophilus EQ57 and Lb. casei EQ28, however, there were instances where a mixture of 75% brewers’ YE with 25% bakers’ YE gave biomass levels higher than those obtained with the pure products. A series of autolyses were conducted with mixtures of brewers’ and bakers’ yeast, to see if the YE obtained differed from those obtained from autolysis of the individual yeast cultures. Brewers’ yeast autolysates had higher turbidity than those of bakers’ yeast. The maximum yield was obtained with the co-autolysis of a combination of 60% bakers’ yeasts and 40% brewers’ yeasts. Growth of Lb. acidophilus EQ57 was best in the autolysate obtained from 100% brewers’ yeast, in spite of the higher nitrogen content of YE produced when bakers’ yeast was used during co-autolysis. Keywords: autolysis, Lactobacillus, Pediococcus, yeast extracts. The autolysate of yeast cells is a valuable source of various substances which can be used as ingredients in foods, feeds and fermentation media (Peppler, 1982; Selmer-Olsen and Sorhaug, 1998). Many workers have shown the growth-promoting properties of yeast extracts (YE) on bacterial growth (Bibal et al. 1989; Milton et al. 1991; Jensen and Hamer, 1993; Ibrahim and Bezkororainy, 1994; Olmos-Dichara et al. 1997). Yeast extracts also enhanced lactic acid production rates by lactic acid bacteria (Aeschlimann and von Stockar, 1990). Although YE are generally less expensive than protein hydrolysates, they still remain a relatively expensive material for large-scale fermentations process (Neklyudov et al. 1993). In most cases YE are autolysates of Saccharomyces cerevisiae, as brewers’ or bakers’ yeast. The YE obtained from brewers’ yeast are generally less expensive than those obtained from bakers’ yeast. This is primarily because biomass for the manufacture of brewers’ yeast extracts is usually obtained from breweries as surplus brewer’s yeasts rather than from sources of primary-grown yeasts such as bakers’ yeast produced on molasses (Peppler, 1982). Selmer-Olsen and Sorhaug, 1998 have shown that autolysed brewery yeast can be added to whey for both growth and production of metabolites on the large scale. There is thus an economic interest in using brewers’ YE in microbiological media, but little is known of the comparative growth-promoting properties of bakers’ or brewers’ YE. The yeast species influences YE composition (Reed and Nogodawithana, 1991), and the strain has an influence as well. There is one report that brewers’ YE has lower nitrogen contents than those obtained from bakers’ yeast (Gaudreau et al. 1999). There is little information on how variations in the composition of YE influence their growth-promoting properties, and if mixtures of various sources of YE can be beneficial. In examining the effects of blends of brewers’ and bakers’ YE on their biological properties two avenues are possible: mixing commercial YE made from pure cultures of brewers’ or bakers’ yeast, or producing a YE by co-autolysis of the two strains. Cohas and Cohas, 1990 have carried out co-autolysis of two types of yeasts but no information on the YE compositions and growth-promoting properties were presented. Thus there is no information of the biological value of YE produced by co-autolysis, at least with respect to the growth of lactic cultures. The aim of this study was to determine the effect of the sources of bakers’ and brewers’ YE, as well as their mixtures, on the growth of four lactic acid bacteria. Furthermore, YE were produced by co-autolysis of bakers’ and brewers’ yeast and the biological value of the products was examined. These data are aimed at providing information to laboratory and industrial scientists that formulate microbiological growth media, as well as to producers of YE. Yeast Fresh compressed bakers’ yeast (28% solids) was obtained from Lallemand Inc. (Montréal, Canada), and was kept at 4ºC until used. The brewers’ yeasts (14% solids) was an industrial bottom fermenting yeast from NPC Dehydrators (Orrville, Ohio, USA); it was frozen for shipping purposes and kept at –20ºC until used. Lactobacillus casei EQ28 and EQ85, Lactobacillus acidophilus EQ57, Pediococcus acidilactici MA18/5-M were strains kindly provided by Equipharm SA (Aurillac, France). The strains were propagated at 37ºC in MRS broth (BDH, Darmstadt, Germany), until the pH reached 4.6 (approximately 8 hrs). The cultures were put on ice for 30 min to stop the acidification process and stored at 4ºC until used. Stock cultures were prepared by mixing 20 mL of freshly MRS-grown cultures with 50 mL of 20% skim milk and 50 mL of a 20% glycerol solution (glycerol and milk were sterilized separately). The milk/glycerol/cell suspensions were divided into 1 mL fractions, added to sterile 2 mL cryovials (Nalgene, Rochester, NY) and stored at –70ºC until used. Commercial yeast extracts powders Six commercial YE powders were used, three from bakers’ yeasts and three from brewers’ yeasts. The three bakers’ YE were from BioSpringer (Maison Alfort, France), Lallemand (FNI‑100 Montréal, Can.) and Difco (Detroit, USA). The three brewers’ YE were from Red Star (Red Star 695; Milwaukee, USA), Lallemand (FNI 200) and Champlain (Veeprex B400; Cornwall, Can.). For the purpose of data presentation, but in order to prevent any prejudice to the commercial suppliers, the bakers’ YE were coded BK1, BK2 and BK3, while the brewers’ YE were coded BW4, BW5 and BW6. Such an approach was chosen in order to enable the replication of the experiments by others, while still protecting the interests of the suppliers. Basic yeast autolysis procedure Unless otherwise stated, bakers’ and brewers’ yeast creams were prepared separately at 14% (w/v) dry matter. Ethyl acetate was added at 1.5% in the bakers’ yeast suspension, but none was added to the brewers’ yeast suspension since it naturally contained 7% ethanol. When co‑autolysis of the two types of yeasts was carried out, the yeast cell suspensions were mixed in the appropriate proportions. This gave variable ethyl acetate and ethanol contents (Table 1). The pH of the yeast suspensions was adjusted to 5.5. Unless otherwise stated, 250 mL of the yeast suspensions were added to a 500 mL Erlenmeyer flask, and the autolysis procedures were allowed to proceed at 48ºC for 24 hrs in a rotary shaker at 150 rpm. The autolysate was then heated at 85ºC for 30 min, to remove ethyl acetate and ethanol, and centrifuged at 5000 g for 15 min. The pellet was washed with deionized water, vigorously stirred and centrifuged again at 5000 g for 15 min. The two supernatants were pooled, and these YE were freeze-dried at 25ºC for 48 hrs in a Lyo-San unit (Lachute, Can.). Autolysis yield was calculated as the fraction of solids recovered in the centrifugation supernatants, from the initial yeast solids.
Effect of incubation temperature and initial yeast solids on autolysis yields The initial solids content of the bakers’ yeast was 28%. The effect of solids on autolysis yields was first examined. Suspensions of 10, 12, 14, 16 and 18% solids were prepared. For bakers’ yeast, the appropriate quantity of compressed yeasts was simply diluted with deionized water. Autolysis was then conducted at 48ºC for 24 hrs and the autolysates were treated as described previously. Some assays were also carried out at temperatures varying from 45 to 54ºC. In these assays, bakers’ and brewers’ yeast suspensions had 18 and 14% dry matter respectively. The α-amino nitrogen (α-AN) of the fractions was determined by titration following reaction with formaldehyde (USP, 1985). A 5% YE solution was prepared at pH 7.0 with 0.1 M NaOH or 0.1 M HCl. Formaldehyde (37%) was adjusted to pH 9.0, and 10 mL added to 25 mL of the YE solution. The mixture was mixed, and then titrated to pH 9.0 with 0.1 M NaOH. The total nitrogen (TN) concentration was determined using a FP-428 LECO apparatus (LECO Corporation, Saint Joseph, MI) and the conditions were the following: 150 mg sample size; 900 EC oxidation furnace temperature; 650 EC oxidation standby temperature; three purge cycles; 30 s minimum timeout; comparator level at 1.00; loop selected at low range; flow constants all at high for 30 s; gases were 99.99% oxygen and 99.99% helium; 150 mg EDTA (nE 502-092, 9.56 ± 0.03% Nitrogen, LECO Corporation, Saint Joseph, MI) calibration standard. Automated spectrophotometry (AS) was used to assess the effect of YE on the growth of lactic cultures in microbiological media. The analyses were carried out on a Bioscreen C unit (Labsystems, Corp. Helsinki, Finland) with the method of Champagne et al.1999. The base medium used for the AS tests had the following composition, per L of medium: 20 g glucose, 3 g K2HPO4, 3 g KH2PO4, 3 g sodium citrate, 1 g Tween 80, 0.2 g MgSO4.7H2O, 0.05 g MnSO4.2H2O, and 2.0 g YE for Lb. acidophilus EQ57 and Pc. acicilactici MA1815-M or 1.0 g for Lb. casei EQ28 and EQ85 strains (unless otherwise stated). It must be stressed that these YE concentrations do not enable the highest growth possible, but are chosen to keep OD levels under 1.0 in order to differentiate the growth-promoting properties of the YE. Glucose and magnesium sulfate were mixed together at twice the concentration (40 g/L and 0.4 g/L respectively) and autoclaved 15 min at 121ºC. The rest of the medium was also prepared at a double concentration and sterilized the same way. Both solutions were mixed following sterilization. Two features of the AS growth curve were examined: highest growth rate (µmax) and highest optical density (ODmax). The µmax values were obtained by plotting the OD curve on an Ln scale and determining the slope of the linear portion of the curve (exponential growth phase) using Sigma Plot software (SPSS, Chicago). Turbidity of YE solutions was determined with an Orbico-Hellige turbidimeter (Model 965; Farmingdale USA). Three independent repetitions were done for each experiment. Statistical analyses were performed using SAS (1989) Institute, Inc. (Cary, USA) software. Analysis of variance was used with significance defined at P ≤ 0.05. Nitrogen content of commercial YE Total nitrogen and α-AN content of brewers’ and bakers’ YE are presented in Table 2. Bakers’ YE have a higher TN content than brewers’ YE. Contents in α-AN were relatively constant in bakers’ YE, and they represented approximately half of TN (Table 2). However, variations in α-AN were greater in brewers’ YE as well as their proportional content of TN. The proportion of α-AN in TN provides a picture of the degree of hydrolysis of protein and peptides in the YE. Thus, the YE apparently having the highest degree of hydrolysis is brewers’ BW5, while brewers’ BW6 had the lowest. This suggests that significant variations in free amino acid and peptide contents are encountered in the YE. The YE used in this study were obtained from five different suppliers or producers, and the differences in nitrogen content are probably related to the yeast strains as well as the autolysis procedure used.
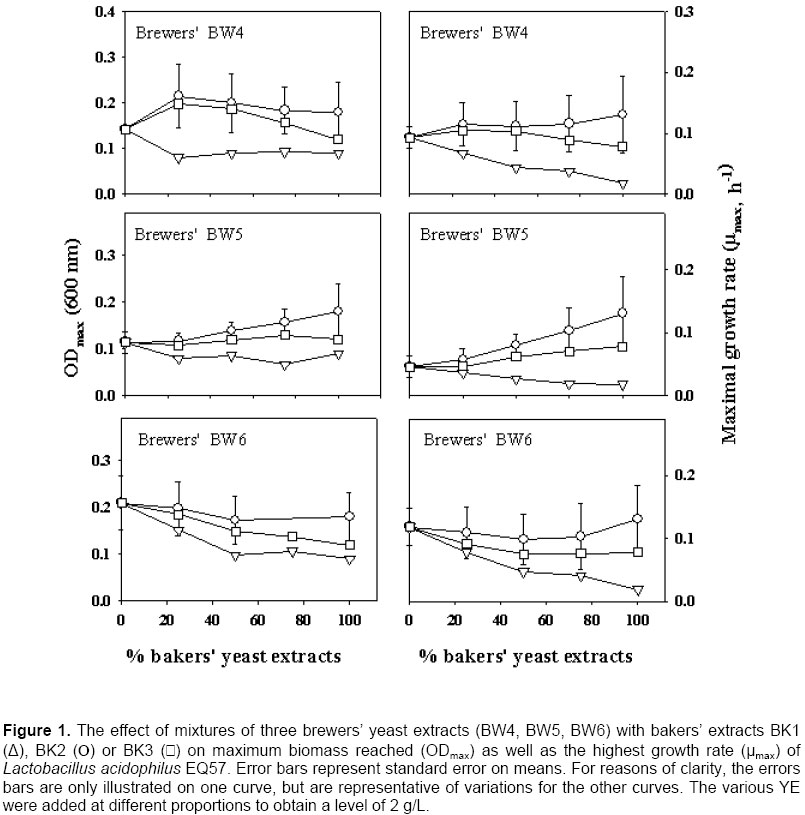
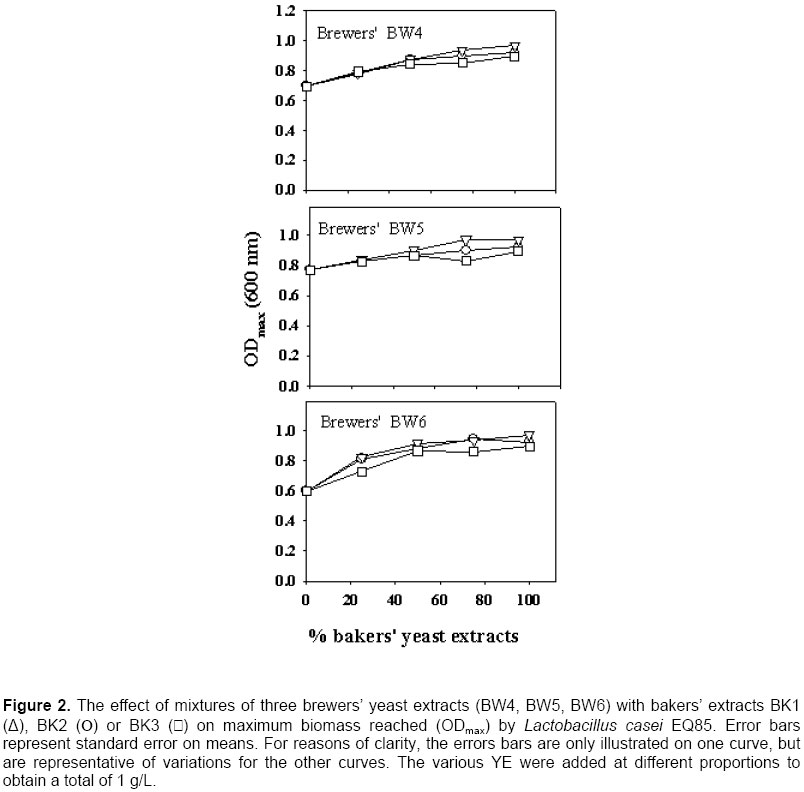
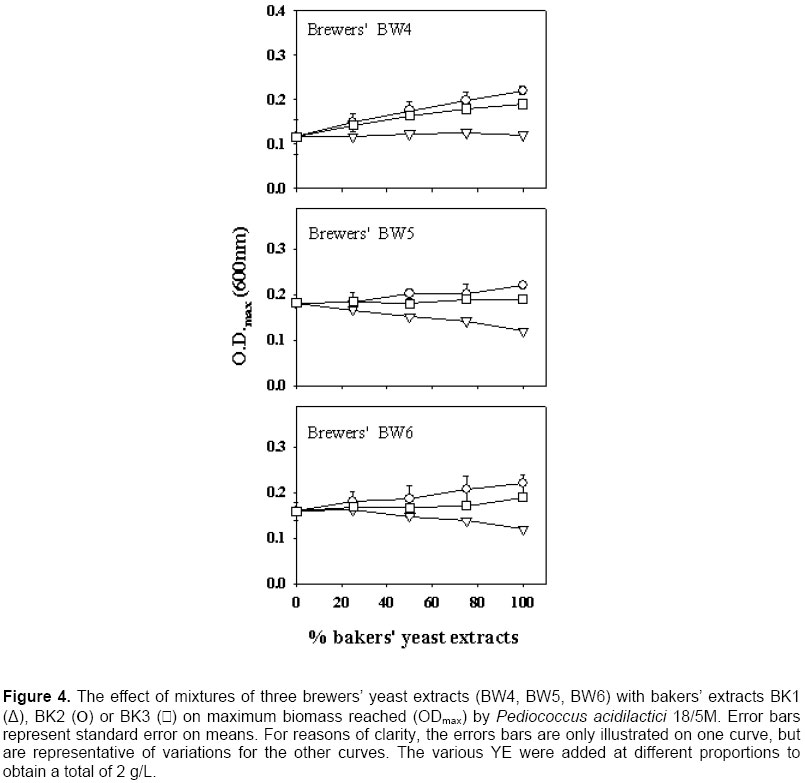
Growth of the LAB in pure bakers’ or brewers’ YE The ODmax and µmax properties of the growth curve generally present two different pictures of the value of YE. Since µmax occurs at the beginning of the growth curve, the effect on growth is related to the mere presence of essential as well as stimulatory components, and high concentrations are not required at this point. However, for ODmax, the concentration of all the essential growth factors is of prime importance, since growth will stop when only one essential factor has been depleted in the medium. There was a correlation between ODmax and µmax values (R2 = 0.82 for Lb. acidophilus EQ57), and the same trends could be seen with both measurements (Figure 1). This was also the case for the other strains (data not shown) and thus, for them, only the ODmax data is presented (Figure 2, Figure 3 and Figure 4). There was a significant effect of YE source on lactic cultures (Table 3). Overall, there was little difference in the reaction of the cultures to BK3 or BK2 bakers’ extracts. However, a preference towards bakers’ BK2 over BK1 extract was noted for Lb. acidophilus EQ57 (Figure 1) as well as for Pc. acidilactici 18/5 M. (Figure 4). With media having 100% brewers’ YE (0% bakers’ YE), product BW6 gave better growth than BW5 with Lb. acidophilus EQ57 (Figure 1), while the opposite was seen for Lb. casei EQ85 (Figure 2).
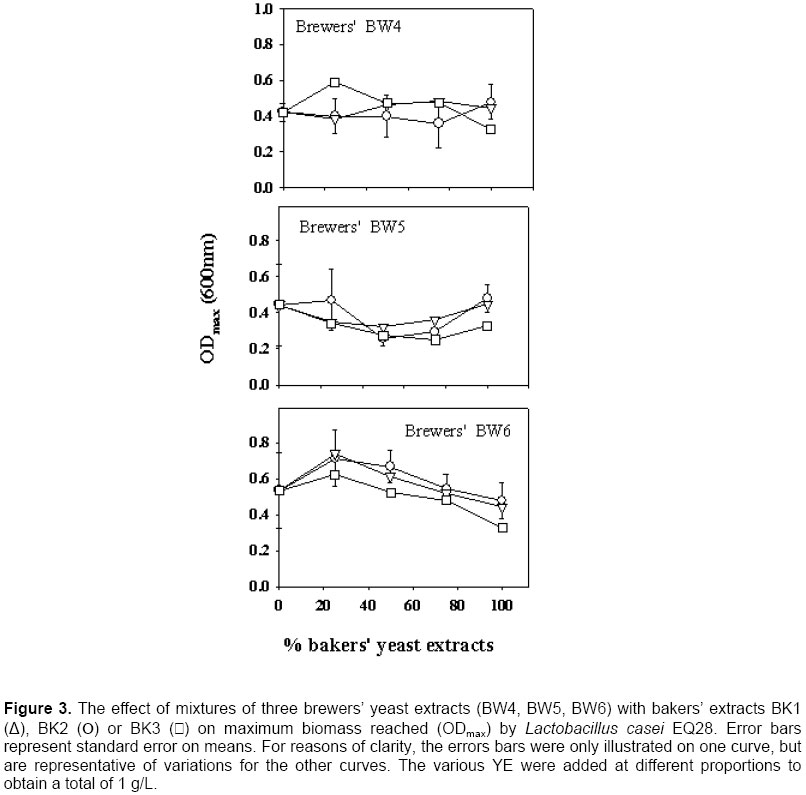
A preliminary study had shown that lactic cultures preferred bakers’ YE over brewers’ YE (Gaudreau et al. 1999). The best overall product in this study was bakers’ BK2, which lends some support to this observation. However, a systematic preference of bakers’ YE over brewers’ YE was only encountered with Lb. casei EQ85 (Figure 2). Therefore, results from this study show that this statement cannot be generalized, and that LAB reacts differently to the source of YE. It was examined if the growth of the LAB was related to nitrogen contents. There was little correlation between TN or α-AN and ODmax data for Lb. casei EQ28 and Pc. acidilactici 18/5M (R2 < 0.4 in all cases). With Lb. casei EQ85, ODmax increased as a function of both TN (R2 = 0.95) and α-AN (R2 = 0.70). A relationship was also found between ODmax and TN or α-AN with Lb. acidophilus EQ57, as correlations were respectively of 0.41 and 0.73. A previous study had revealed a link between biomass and the nitrogen content of YE (Gaudreau et al. 1999). These data show that such relationships do occur, but that they are not systematic. Replacement of bakers’ YE by brewers’ YE in media formulations Bakers’ YE tend to be more expensive than brewers’ YE, and it is thus of economic interest to use brewers’ YE in fermentation media. Generally speaking, mixing of the two sources of YE gave progressively higher growth as a function of the content of the best YE. This was systematically the case with Lb. casei EQ85 (Figure 2) and Pc. acidilactici 17/5M (Figure 4). There were several instances, however, where a mixture of 75% brewers’ YE with 25% bakers’ YE gave biomass levels higher than those obtained with the pure products. A notable example is brewers’ BW6 with all three bakers’ YE for Lb. casei EQ28 (Figure 3). This suggests that the YE complements each other with respect to the essential amino acid, vitamin or mineral growth factors required by this particular strain. Statistical analyses showed interactions between the YE source and its concentration with respect to its effect on the ODmax values (Table 3) except for Lb. casei EQ28. An example of such an interaction is found with brewers’ BW4 on Lb. acidophilus EQ57 (Figure 1). Thus, the 75:25 ratio of brewers’ BW4 with bakers’ BK3 or BK2 was beneficial to growth of Lb. acidophilus EQ57, while higher contents of bakers’ BK3 and BK2 were detrimental to growth, and the opposite was observed when bakers’ BK1 was used. An interaction between bakers’ YE source and its concentration effect was also observed with the µmax curves (Figure 1). Industrially speaking, these results show that producers of LAB or of other microbial cultures could find it worthwhile to not only examine the replacement of bakers’ YE by brewers’ YE, but also to consider mixtures of the two sources. Such an examination of mixtures of various sources is very tedious if a laboratory can only rely on fermentation equipment, and the AS technique can provide a useful tool in this aim, as was shown previously (Potvin et al. 1997; Champagne et al. 1999) as well as in this study. Scientists who work with fastidious strains and who must enrich existing commercial media or formulate their own culture media could also adopt this strategy. Effect of incubation temperature and solids content on autolysis yields The observation that some mixtures of bakers’ and brewers’ YE gave better growth than the pure products prompted us to examine the effect of generating the brewers’/baker’ YE by co‑autolysis. Therefore, a series of autolyses were conducted with mixtures of the two sources of yeast, and it was examined if the YE obtained differed from those obtained by autolysis of the individual yeast cultures. To ensure that both yeasts had autolysis conditions that were appropriate, it was first determined how temperature, and solids content affected yeast solubilization yields. Autolysis yields of the two types of yeasts at 45, 48 and 51ºC were not significantly different, so a range of 45 to 51ºC could be used for the autolysis procedure (Table 4). With our strains, bakers’ yeasts tended to prefer a higher temperature than the brewers’ yeast (Table 4). This is in agreement with the literature, since a temperature of 45ºC was shown to be optimal for the autolysis of brewers’ yeasts (Suzzi, 1990; Wangchaoren et al. 1994). At 54ºC, a significant decrease of autolysis yield appeared for the two types of yeasts. The lower yield at 54ºC could be related to enzyme denaturation, or to the fact that enzymes participating in yeast autolysis at 40ºC are not the same as at 50ºC (Behalova and Beran, 1986). In light of these data, it was decided to use 48ºC as the co-autolysis temperature.
Bakers’ yeast was obtained in a more concentrated form (28% solids) than those of brewers’ yeast (14% solids). It was thus examined how dilution of the bakers’ yeast solids would affect the final autolysis yields. Reducing initial yeast cream solids significantly increased the efficiency of the autolysis procedure (Table 5). Previous studies on the optimal concentration of yeast biomass have shown an effect of yeast strain. In a range of 8 to 11% solids, Orban et al. 1994 found 10% solids to be best for K. fragilis. However, Wangchaoren et al. 1994 found a 15% optimal concentration of yeast biomass in a range of 5 to 25% dry matter. The autolysis products may be inhibitors of the autolytic enzymes. Addition of decarboxylic amino acids and some peptides fractions isolated from yeast cells after 5 hrs autolysis period have been shown to inhibit significantly the autolysis of yeast biomass (Neklyudov et al. 1993). Lowering the yeast solids could thus be used to increase autolysis yields. However, the cost associated with drying of yeast autolysates increases as a function of water content. For this reason, it was decided to dilute the yeast suspensions to 14% dry matter.
Bakers’ and brewers’ yeasts co-autolysis Various mixtures of the bakers’ and brewers’ yeast were incubated at 48ºC with 14% initial solids content and autolysis results are presented in Table 6.
Brewers’ YE had higher turbidity than bakers’ YE, and the more there were brewers’ yeasts in the mixture, the more turbid were the YE obtained from the co-autolysis (Table 6). Turbidity is an important characteristic of YE solutions, and could be a problem when clear microbiological media need to be prepared. Similar yields (approximately 49%) were obtained for the autolysis of pure bakers’ or brewers’ yeasts. Mixing the two yeasts was beneficial for subsequent autolysis yields, and the maximum yield was obtained with the co-autolysis of a combination of 60% bakers’ yeasts and 40% brewers’ yeasts (Table 6). The yields obtained are in accordance with results stated by Peppler, 1982 and Kelly, 1973, but higher than those of Lee et al. 1993 who obtained 35% yields for brewers’ yeasts with a conventional autolysis method. Pure bakers’ YE had higher TN and α-AN contents than pure brewers’ YE (Table 6), and the proportions of α-AN in TN are in line with those observed by Peppler, 1979 and the commercial products analysed (Table 2). Co-autolysis was beneficial to protein hydrolysis, since the α-AN proportion of TN was highest for the 60% bakers’ 40% brewers’ yeasts mix. A synergistic effect of enzyme activities from the two types of yeasts may exist, particularly for the peptidases. Industrially speaking, this data shows that producers of YE could improve autolysis yields and α-AN content of their extracts by blending bakers’ and brewer’ yeast and conducting a co‑autolysis. Growth promoting properties of YE produced by co-autolysis Growth of Lactobacillus acidophilus EQ57 in AS assays was shown to be influenced by YE source, and was sensitive to interactions between YE sources and their concentrations. For this reason, this strain was used to evaluate the biological properties of the YE obtained by co‑autolysis. The AS assays were conducted with a higher content of YE in the medium (5 g/L), which explains why OD values were higher in the assays with YE obtained by co-autolysis (Table 7) than those with the commercial YE (Figure 1).
Growth of Lb. acidophilus EQ57 was best in terms of both ODmax and µmax in the presence of 100% brewers’ YE (Table 7). This occurred in spite of the higher TN and α-AN contents of YE produced when bakers’ yeast was used (Table 6). In contrast, from the data on blends of commercial brewers’ and bakers’ YE (Table 2 and Figure 1), a correlation (R2 = 0.73) was found between ODmax and α-AN. Evidently, yeast strains differed, and the nitrogen fraction of the YE obtained by co-autolysis with these strains was not the limiting essential growth fraction in the YE. Nevertheless, the data from the co-autolysis YE (Table 7) are in line with those obtained with the brewers’ BW6 extract. Indeed, in this instance, the strain had preferred the brewers’ YE over the three bakers’ YE (Figure 1). This suggests that the essential amino acids or peptides were not the limiting growth factors in the YE obtained by co-autolysis. The data on mixtures of commercial YE (Figures 1, Figure 2, Figure 3 and Figure 4) shows that the source of the yeast does have an effect on the growth-promoting properties of YE blends. This would presumably also be the case for mixtures of bakers’ and brewers’ yeast for a co-autolysis. From an industrial perspective, these results indicate that producers of YE could increase yields and protein hydrolysis by conducting co-autolyses. In some cases this could also improve the biological value of the YE, particularly with strains having a preference for amino acids over peptides. However, the growth-promoting value of such novel YE would still need to be tested with each target strain, as is the case with mixtures of bakers’ and brewers’ YE. Thanks are expressed to Nancy Gardner and Richard Degré for technical and scientific support. Note: Electronic Journal of Biotechnology is not responsible if on-line references cited on manuscripts are not available any more after the date of publication. Supported by UNESCO / MIRCEN network © 2003 by Pontificia Universidad Católica de Valparaíso -- Chile The following images related to this document are available:Photo images[ej03023f2.jpg] [ej03023f1.jpg] [ej03023f4.jpg] [ej03023f3.jpg] |
| |||||||||
