 |
| About Bioline | All Journals | Testimonials | Membership | News |
|
||||||
|
||||||
Electronic Journal of Biotechnology, Vol. 7 No. 1, April 15, 2004 Quantitative real-time PCR method to detect changes in specific transcript and total RNA amountsKwang-Hyun Baek1, Daniel Z. Skinner*2 1Department of Crop and Soil Sciences,
210 Johnson Hall,
Washington State University,
Pullman, WA 99164-6420 USA
Tel: 01 509 335 3632
Fax: 1 509 335 2553
E-mail: kwanghyunbaek@wsu.edu Financial support: USDA-Agricultural Research Service. Received October 13, 2003 / Code Number: ej04007 Abstract Quantitative real-time PCR (qRT-PCR), used in conjunction with reverse transcriptase, has been applied to the determination of the number of copies of a transcript per unit mass of RNA, but did not indicate any change in the amount of total RNA per mass of tissue. In the present work, we described a simple method to use qRT-PCR to estimate the change in the amount of total RNA per unit mass of wheat (Triticum aestivum L.) tissue in response to cold temperature. Three qRT-PCR templates, i.e. control, cold-exposed, and one of RNA extracted from a sample consisting of equal masses of control and cold-exposed tissue, were analyzed. The number of copies of target transcript per unit mass of RNA was estimated from the three samples using standard qRT-PCR techniques. Equations describing the number of copies of the target sequence in each of the tissue samples were solved simultaneously to describe the relative proportion of the target sequence that originated from each tissue sample in the mixture, thereby providing an estimate of relative amounts of total RNA in the two tissues. Keywords: cold treatment, quantitative real-time PCR, total RNA, wheat. Abbreviations: RNA: ribonucleic acid In tissue exposed to a given treatment, the level of expression of several genes may change significantly, possibly altering the total amount of RNA in the tissue. In studies to determine the change in the level of expression of a given gene of interest, methods such as Northern blots, microarray interrogation, or quantitative real-time PCR typically are used to estimate the number of copies of a transcript of interest in an aliquot of total RNA extracted from tissue samples before and after treatment (Xu et al. 2000; Maguireet al. 2002). This determination is influenced by the amount of total RNA in the tissue. For example, if total RNA increased 2-fold, and the occurrence of the target transcript increased 10-fold, estimating the number of transcript copies in an aliquot of RNA would indicate only a five-fold increase in the target transcript, while a 10-fold increase had actually occurred in each cell. Here, we suggest a simple method using qRT-PCR to estimate the relative proportions of total RNA and a specific RNA transcript in two tissue samples. Materials and Methods Near isogenic wheat (Triticum aestivum L.) lines 442 and 443, differing only in the region of chromosome 5A carrying gene(s) conditioning winter wheat vs. spring wheat growth habit (Storlie et al. 1998) were used. Line 443 exhibits spring wheat growth habit and 442 exhibits winter wheat growth habit. Plants were grown under 16 hrs light at 20ºC for 14d, then were transferred to a chamber with the same light conditions at 2ºC. The second leaves (of three) to open on the plants were collected at the time of transfer (control) and after 7d growth at 2ºC (cold-exposed treatment). To determine the amount of water in the plant samples, second leaves from each of the treatments were weighed, dried for 24 hrs at 80ºC, and then weighed again. Water content was determined by subtraction. All moisture determinations and PCR analyses were replicated three times using independent plants. Three types of samples were processed; (i) tissue from control plant; (ii) tissue from cold-exposed plant; (iii) a sample consisting of equal amounts of tissue from control and treated plants. The same mass of tissue from each plant was pulverized in a mortar and pestle in liquid nitrogen. Trizol reagent (Invitrogen, San Diego, CA) was added to the mortar and total RNA was extracted according to the manufacturers directions. The final RNA pellet was dissolved in DEPC-treated water and quantified with UV spectrophotometry. Quantitative real-time PCR was carried out on a RotorGene 2000 (Corbett Research, Sydney, Australia) using a SYBR green detection protocol (Karsai et al. 2002). The primers used were specific for wheat manganese-superoxide dismutase (forward: 5' - CAGAGGGTGCTGCTTTACAA and reverse: 5' - GGTCACAAGAGGGTCCTGAT) or wheat phospholipase D (forward: 5' - AACCGTGTGTTGGAAGCAT and reverse: 5' - ATCAATGCCTCCCTGAAAAC). Synthesis of cDNA and PCR amplification was carried out with the Superscript One-step RT-PCR Platinum Taq kit (Invitrogen). The amplification protocol consisted of two steps, cDNA construction for 15 min at 50ºC followed by a PCR profile of a 3 min denaturation at 95ºC, then 32 cycles of 15 s at 95ºC, 20 s at 54ºC, and 17 s at 72ºC. The amount of product was determined at the end of each cycle by the RotorGene software. The reaction mixture provided in the Superscript kit was adjusted to 2mM MgCl2, 100nM primers, 1:40,000 SYBR Green (Molecular Probes, Eugene, OR), and 125 ng total RNA in 20 µl reactions. A cloned wheat MnSOD gene was used as template in amplification reactions to develop a standard curve for quantification of the products of MnSOD and PLD from each replication. The template for qRT-PCR consisted of six mixtures of RNA from the control and cold-exposed plants (Table 1). A seventh preparation was made up of RNA extracted from combined equal amounts of plant tissue from the two temperature regimes.
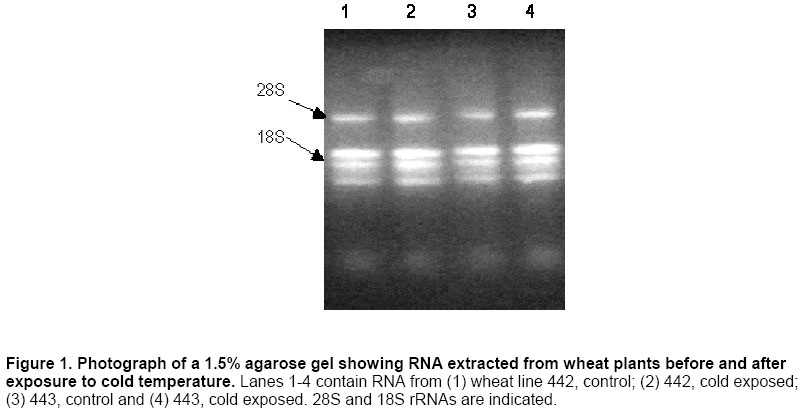
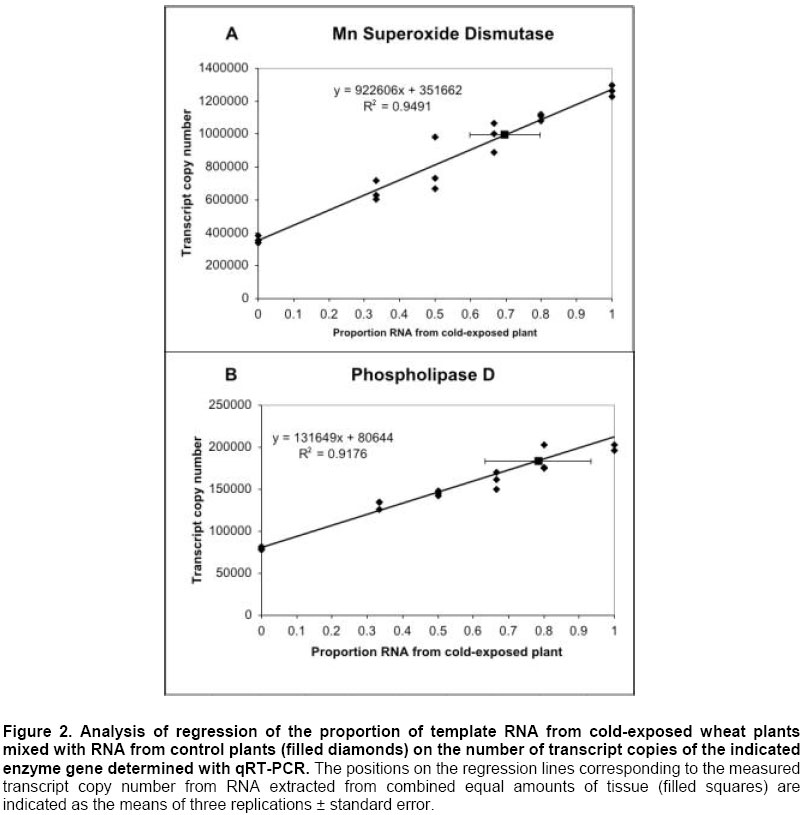
Results Recovered RNA had clearly distinguishable rRNAs, indicating large RNA fragments had been recovered (Figure 1). Transcript copy number data are summarized in Table 1. Regression of copy number on the proportion of RNA from the cold-treated plant indicated that combining RNA from the control and cold-exposed plants resulted in a linear, additive, determination of copy number (r2 for linear regression >0.9, Figure 2). Therefore, if the amounts of total RNA per unit mass of tissue were the same in the cold-exposed and control plants, the number of copies of transcript extracted from the tissue sample comprised of equal masses of the two plants would be equal to the number of copies of transcript observed in the 0.5:0.5 mixture of RNAs extracted from the two plants individually. However, the qRT-PCR result from the RNA extracted from the combined plant tissues indicated a value significantly greater than the 0.5:0.5 mixtures with both MnSOD and PLD (Table 1). Therefore, the plant with the higher number of copies of transcript per nanogram RNA, the cold-treated plants in this case (Table 1), also contributed more RNA to the reaction template from the combined tissues, i.e. contained more RNA per unit mass of tissue. The ratio of the amount of RNA in the cold-treated to control plants may be calculated from the qRT-PCR results from the control, cold treated, and mixed tissue samples as follows. In one replication of the MnSOD determination from wheat line 443, the number of copies of MnSOD transcript in 125ng RNA from the control plant was 339875; from the cold-treated plant the number was 1297629; and from the RNA extracted from the combined plant tissues the number was 983264. From this information the proportion of the total RNA extracted from the combined tissue samples that originated from the control plant, and the proportion that originated from the cold-treated plant, can be calculated as: Let: T=nanograms RNA from the cold-treated plant and C=nanograms RNA from the control plant. The average number of copies of MnSOD transcript per nanogram of RNA from the control plant was 339875/125=2719, the average number of copies of transcript per nanogram of RNA from the cold-treated plant was 1297629/125=10381, and the number of copies of transcript in 125ng RNA extracted from the combined tissues was 983264. Thus: (Cng)(2719 copies/ng) + (Tng)(10381 copies/ng) = 983264 copies, or: 2719C + 10381T=983264 copies (equation 1) and: T+C = 125ng (equation 2). From equation (2), T=125-C, thus, equation (1) can be re-written: 2719 C+ 10381(125-C) = 983264, which is solved for C=41.0, leading to: T = 125-C = 125-41.0 = 84.0. Therefore, in the combined tissue sample, 2.05 times (84/41) the amount of total RNA originated from the cold-treated plant as compared to the control plant. This calculation was repeated for each of three replications, the means and standard errors of the results are shown in Table 2. These results were compared to the result of the linear regression equation developed from mixing RNAs from the control and from the cold-exposed wheat plants (Figure 2). The mean copy numbers of MnSOD from the total RNA of mixed plant tissue (Table 1), corresponded to a proportion of 0.697 RNA originating from the cold-treated plant, calculated from the regression equation in Figure 2A. Hence, 1-0.697=0.303 originated from the control plants, indicating a 0.697/0.303 = 2.30 fold increase of total RNA in the cold-exposed plants, identical to the mean of the results (Table 2) of three replications of the calculations demonstrated above, suggesting the simpler, calculation-based method provides a reliable estimate of the total RNA fold change.
Comparison of the average number of MnSOD transcript copies per nanogram RNA from the control and cold-treated plants (358447 vs. 1263288, respectively, Table 1) indicated a 3.5-fold increase in the cold-treated over the control. Taken together, these two results indicated that the cold treatment resulted in an increase in total RNA per unit mass of plant tissue of 2.3-fold, and a 3.5-fold increase in the measured concentration of MnSOD transcript per unit mass of RNA, resulting in a total increase of (2.3)(3.5) = 8.1-fold increase of MnSOD transcripts per unit mass of plant tissue. Similar calculations (means shown in Table 1) with the PLD transcript copy number data also indicated a 2.3 fold increase of total RNA per unit mass of tissue, and a 2.7 fold increase of PLD transcript per unit mass of RNA, suggesting in a 6.2 fold increase of PLD expression per unit mass of tissue in response to exposure to cold. Others have reported that the expression of MnSOD increases more rapidly in spring wheat, compared to winter wheat, after exposure to cold temperature (Wu et al. 1999). A comparison of the fold increase of MnSOD expression in 442 and 443 (7.4-fold vs. 4.1-fold, Table 2) supports that observation, and suggests that most of the relative increase seen in 443, compared to 442, was due to an increase in the number of copies per unit mass of RNA, with about the same amount of increase of total RNA per unit mass of tissue seen in 442 and 443 (Table 2). Determinations of water content revealed that the plants exposed to cold temperatures contained an average of 4% less water than the control plants. This difference was statistically significant, but there was no significant difference between plant sources (statistical separation not shown). Assuming that this 4% difference in water content resulted in a 4% increase in the number of cells per unit mass of tissue, the samples consisting of equal masses of plant tissue from the two temperature treatments would actually contain more cells of the cold treated tissue than the control tissue, resulting in an inflated estimate of RNA content in the cold-treated tissue. Therefore, calculated values of cold-treated RNA content were corrected for the 4% water content difference by substituting 1.04T for T in the equations above. The corrected values are more conservative than the uncorrected values, and are presented in Table 2. Discussion Using this qRT-PCR method, we calculated an average increase of total RNA, including the spring and winter wheat lines, of 2.3-fold (1.9-fold when corrected for change in water content) after seven days of cold acclimation (Table 2). To our knowledge, this method of using qRT-PCR with RNA extracted from equal masses of control and treated tissues is the first attempt to quantify changes in the amount of total RNA with qRT-PCR. Sarhan and D’Aoust, 1975, using a method of extraction and quantification of nucleic acids, first measured RNA change after 11 days of cold acclimation and estimated an average increase of total RNA, including spring and winter wheat, of 2.1-fold; water content apparently was not measured in that study. Our finding of an average 2.3-fold increase in total RNA and the 2.1 fold increase found by Sarhan and D’Aoust, 1975 were within one standard deviation unit of our data, and therefore were not considered significantly different, suggesting the qRT-PCR method we propose here provides a rapid and reliable method of estimating changes in total RNA content in response to treatments. References
Note: Electronic Journal of Biotechnology is not responsible if on-line references cited on manuscripts are not available any more after the date of publication. Supported by UNESCO / MIRCEN network © 2004 by Pontificia Universidad Católica de Valparaíso -- Chile The following images related to this document are available:Photo images[ej04007f2.jpg] [ej04007f1.jpg] | |||||||||||||||||||||||||||||||||||||||||||||||||||||||||||||||||||||||||||||||||||||||||||
| |||||||||
