 |
| About Bioline | All Journals | Testimonials | Membership | News |
|
||||||
|
||||||
Electronic Journal of Biotechnology, Vol. 7, No.3, December, 2004, pp. 287-294 RESEARCH ARTICLE Preliminary results
of using ESR to examine biofilms
Neil Evan Whitehead*#1, Tani
Atushi2, Kazue Tazaki3, Motoji Ikeya4 Code Number: ej04033 ABSTRACTThis preliminary work shows
ESR (Electron Spin Resonance) can be used to detect biofilms, particularly
from Fe-metabolising bacteria. A film was detected by ESR as early as 1
day, hence possibly more sensitively than by fluorescent methods. Films
can probably be detected as early as one hour. Spectra contain a very broad
peak at g=2.13, probably due to ferrihydrite. Results of field experiments
from streams and ponds in Keywords: Biofilms, ESR, ferrihydrite, hematite, magnetite. ARTICLEBiofilms
form everywhere in rivers and lakes. In the Peaks in ESR (which have an alternating-current shape) are described using “g-values” which are a measure of the magnetic fields at which they occur (i.e. cross the baseline). Thus a single peak actually has a positive and negative “peak”. As reported (Swartz et al. 1972) many biota except biofilms, have been examined via ESR. Usually present are Fe3+, Mn2+ and organic radicals, the latter often due to lipid peroxidation in air, giving a signal at g=2.0055. Bacteria give an additional signal at g=2.0035, also due to bacterial membrane decay. This work
tried to examine some of the potential and limitations of the method using
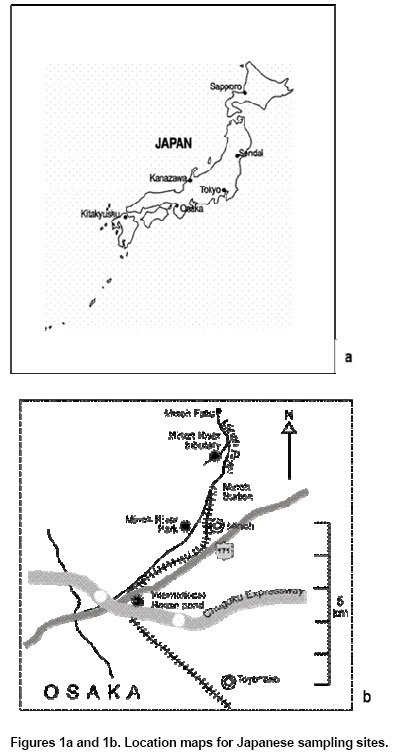
biofilms from streams and ponds in Samples
were mostly collected 2002-2003, either autumn or spring. The first samples
were from streams in Lower Hutt, near
There
were three In the The third The Research on biofilms and corrosion frequently involves metal surfaces but macro amounts of metal interfere with the ESR measurement so metal substrates were avoided. Rate of
growth of biofilm depends on the underlying substrate (Taylor
et al. 1997). Tests in the Plastic
film was a better choice: it was cheap and flexible, and had been used by
others (Morikawa, 1988), but in some studies ( In contrast, Teflon (Polytetrafluorethylene) tape is extremely hydrophobic (though it also has a very low ESR background) and we compared growth rates of biofilms on polypropylene and Teflon in test locations, expecting much less biofilm growth on the Teflon. Plastic strips were suspended from plastic-coated wire frames in local streams or ponds, by iron bulldog-type clips for up to several weeks. Samples were cut off the plastic at appropriate times and dried in air at ambient temperature overnight. Strips 1.5 x 4 cm were rolled into a small cylinder, fastened with PTFE tape, and put vertically into the 7mm i.d. ESR silica sample tube. Spectra
were taken with a conventional X-band ESR spectrometer (JEOL JES-RE1X) at
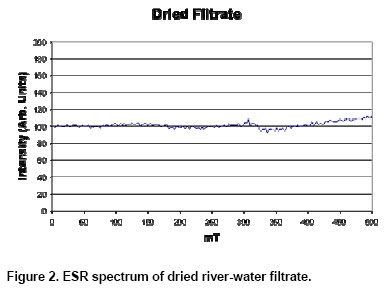
room temperature (or with a LN2 cooled accessory as low as Five litres of NZ stream water were filtered with a paper filter to remove coarse debris. The solids in the filtrate were dried at room temperature and put in the ESR silica sample tube. This sample should represent bacteria floating in the river rather than attached biofilm. Gamma
irradiation often creates new informative ESR peaks in samples. For this
we used the 60Co facility of the The dried filtrate material gave almost no ESR spectrum even at highest sensitivity (Figure 2). This was probably because ESR particularly detects iron compounds rather than the bacteria directly and the iron compounds had not had time to accumulate on the free-floating bacteria. The first
biofilm samples taken in A comparison of analyses for total Fe and Fe detectable by ESR suggested only about 15% was being detected by ESR. This meant the undetected majority of Fe was in amorphous chemical sites. We identify the peak as Fe-associated because firstly there is generally thirty times as much iron as manganese in most environmental niches such as river water, both being almost entirely attached to particulate matter (Reid et al. 1999), so the peak is probably Fe rather than Mn. Secondly the correlation of peaks at g=4.3 and g=2.13 argues for an identification as Fe. Thirdly the iron support clips for the plastic sheet rusted surprisingly fast underwater to ferrihydrite and created a localised yellow-brown rust stain whose most prominent ESR peak (in an intense ESR spectrum) was similarly at g=2.12 and showed the peak at g=4.3 in the usual proportion, and the usual intensity of the organic radical. Rust is a mixture of compounds in the hydrated ferric oxide-hydroxide range: goethite, ferrihydrite and lepidocrocite, and is conveniently called “ferrihydrite”. An alternative name for the same class of compounds is “limonite”. We provisionally call the peak at g=2.13 “ferrihydrite” and that at g=4.3 “hematite” without completely excluding other possibilities, though they seem unlikely. Powdered specimens of magnetite and hematite gave ESR peaks similar to those in the biofilm spectra. Although
at this preliminary stage detailed identification of the bacteria/algae/fungi
comprising the film was not attempted, the bacteria probably contain significant
amounts of Fe-oxidising bacteria capable of converting Fe+2 to
Fe+3. These were a minority in the majority Flavobacteria of
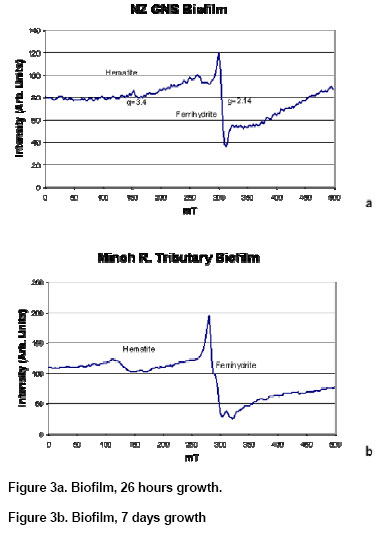
the Good ESR spectra (Figure 3a) were obtained from biofilms which were only 1 day old, unweighably light, and invisible to the eye. A sharper component overlays a broader one and a trace of hematite at g=4.3 is visible in spite of spectral noise. The sharp ferrihydrite peak is much more intense than the noise and argues that ESR could detect considerably smaller biofilm amounts than those present at 1 day. No consistent
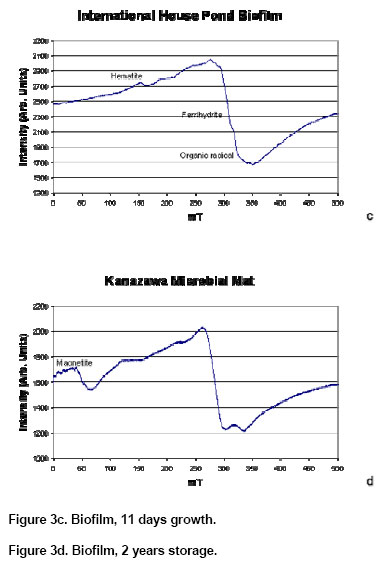
differences were noted between In Figure 3b, the ferrihydrite peak is much sharper than in films allowed to accumulate longer (Figure 3c). This probably means that initially there are few chemical environments for the Fe, but as the film becomes more complex the number of environments multiplies. The Figure 3a, Figure 3b and Figure 3c, Figure 3d are fairly typical of the evolution of ESR biofilm spectra with time. The substrate (polypropylene or PTFE) seemed to make little consistent difference to spectrum shape or intensity. For three comparison sets of films from Tributary, Minoh R., International House Pond, and Park, Minoh R, the PP/PTFE ratio was 1.5±1.5 and consistent with being 1.0, i.e. there was no difference. It therefore seemed there had been little point in finding slightly hydrophilic plastic surfaces, however they may have discouraged exfoliation. All spectra showed a small organic radical peak at about g=2.004 to g=2.005, which corresponds to the already known common bacterial decay products at 2.0037 and 2.0055 (Swartz et al. 1972). This was consistently observed, after airmail and after 18 months storage in the laboratory. In earlier films it tended to be more prominent relative to the “ferrihydrite”. As the biofilm accumulated over days, it became slowly visible on the plastic as a grey layer, (light brown when scraped off) but the colour was only obviously rusty on specimens allowed to accumulate growing biofilm for several months. Ferrihydrite is rust coloured so the amounts in young biofilms must be very small and calculation by comparison with a Mn+2 standard shows they must be fractions of a microgram, not more than a few percent of total dry weight. This shows that the method is very sensitive for Fe detection. Biofilm
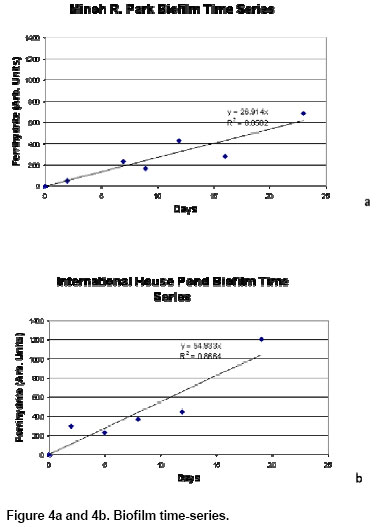
time series were run in a The top points in Figure 4a and Figure 4b corresponded to dry-weight accumulations of 0.12 mg/cm2 and 0.49 mg/cm2 of plastic surface (on one side only) for the time periods shown. This 1:4 ratio is total biomass plus products, not solely ferrihydrite. However the corresponding ratio of ferrihydrite for the top points in the two figures is about 1:2, which is significantly less, and shows change in the relative biotic composition at the two sites. There is significant scatter in Figure 4a and Figure 4b and not enough points are available for a good statistical comparison of rates, which just fail to reach the statistical significance to show differences. However comparing total ferrihydrite for the longest accumulation period, the clear-water GNS site (not shown) was very similar to the Minoh R. Park site sample. This shows that ESR can detect differences in ferrihydrite accumulation rates through comparison of the highest points on the figures. Better time series results would require more data points. A specimen of mature biofilm scraped from a rock gave an ESR spectrum quite similar to that of a mature biofilm on plastic. This means the natural Fe-metabolising bacteria are not greatly disturbed by differences in substrate, and are common in many biofilms. Gamma irradiation did not change biofilm spectra, though it commonly creates new ESR peaks in solid samples. From previous work (Bartoll and Tani, 1998) changes in hematite and magnetite should not occur during gamma irradiation, and are unlikely in near-amorphous ferrihydrite. The results were therefore about what we expected. Low temperatures
(to This work
raised the question how far Fe-bacteria contribute to rusting processes in
air, rather than under water. ESR Examination of rust flakes showed in one
case peaks at g=2.0 and 4.3 and in a second, 4.3 only, consistent with known
aerial weathering processes (Brown et al. 1998) but in neither
case organic radicals. This suggests that at The ESR technique cannot be used for biofilms directly on metal, which is a limitation. Using fluorescent methods involving acridine orange one can detect the presence of a biofilm within 2 hrs (Personal Comm. Morikawa). Via ESR, biofilms were detected after an exposure of one day, but the true sensitivity is much better. The film area used in the spectrometer could be easily increased by several times, and the one-day spectrum in Figure 3a is a strong signal; a much weaker one could be easily detected. This depends on the accumulation being linear as figures 4a and 4b suggest. Therefore ESR is at least competitive in sensitivity with fluorescent methods. Calculation suggests that detection of 0.5% of a single cell weight in the form of Fe could be detectable. This would need special signal processing, but single-cell sensitivity seems possible. It is not clear how sensitive the method is for biofilms in general. The bacterial decay signal at g=2.004 to g=2.005 was much smaller than the ferrihydrite signal, but if it corresponds to a general presence of bacteria, not just Fe-metabolising bacteria, 0.1 mg cm-2 of bacterial dry mass or less can be detected. A calculation similar to that in the last paragraph suggests that a few tens of cells could be detectable. The detection of Fe-metabolising bacteria by ESR relies chiefly on the detection of the iron compounds they excrete. These accumulate and increase outside the bacteria, even when the number of bacteria is constant, which is why the method is sensitive, but the quantity of iron compounds is a measure of the integrated metabolic activity rather than the biomass. Thus if a single cell produces oxidised iron compounds for a few days it could be detected easier than producing iron compounds at the same rate for only a few hours. In both cases only a single cell would be metabolising. The literature on Fe-metabolising bacteria mainly deals with species which reduce Fe3+ to Fe2+ (Coates et al. 2001) but species which oxidise Fe+2 are well known (Tazaki et al. 2002). In some cases both have been reported on opposite sides of the same film (Brown et al. 1994). The predominant compound detected in the present films was ferrihydrite, which is an oxidised form of Fe. In a survey
of local Fe-bacteria products it was noted that hematite was rare except
for samples which had been heated for a long time (Tazaki et
al. 2002). The peak interpreted in our samples as hematite is usually
found not in aqueous biota, but in drier conditions and higher temperatures
(after fires, Bartoll and Tani, 1998). It is also an oxidised
form of Fe, without water, unlike ferrihydrite, and is common in our biofilms. Hematite
is bacterially produced by oxidation of Fe2+ but only at The previously referenced survey (Tazaki et al. 2002) did not note any magnetite, and again ESR probably detected it only because of its high sensitivity. The magnetite peak in the ESR spectrum was small and obscure and only seen in one sample, but is normally only found in hot spring samples (Zhang et al. 1998). Some Fe2+ as well as Fe3+ is incorporated in magnetite which means it is probably formed from previously oxidised Fe by further reduction which seems inefficient. Perhaps this sample, enclosed for two years, exhausted its oxic environment and Fe-reducing bacteria were able to multiply and produce magnetite. Some studies have shown that the application of an electric charge to metal inserted in water can strongly improve the biofilm formation and this could be useful in future studies. We mentioned earlier the difficulty of using metal films in ESR studies, however it could be possible to use a very thin film of carbon deposited on a plastic film. Preliminary work in this laboratory suggests that any ESR interferences from the film are small. Anti-static electronic bags may also be worth investigating. Plastic electrets are an attractive idea, but the permanent electric field is likely to interfere with ESR analysis. Another material found to contribute very low ESR background was fibreglass “wire”. This physically strong material could be used directly suspended across a stream and analysed piece by piece afterwards, to give the rates of accumulation simultaneously at many different points, which should be inversely proportional to water current velocity. In no spectrum was Mn+2 observed. This corresponds to other work (Robbins et al. 1999) who using orthotoluidine as a test, found not reduced, but oxidised Mn (manganese dioxide) associated with all components of biofilms including the orange Fe oxyhydroxide zone. CONCLUDING REMARKSThis method seems very good to analyse biofilms containing Fe-bacteria. However the processes in biofilms from the environment are complex and laboratory studies under carefully controlled conditions may give results which are simpler to interpret. The results in this study seemed mainly to correspond with the activity of Fe-oxidizing bacteria. Because of the high sensitivity, it is possible that some of the results obtained correspond only to quite minor metabolic pathways. This method should be very sensitive for Mn bacteria in biofilms under reducing conditions and the characteristic Mn+2 ESR sextet signal would be prominent. There should be no interference from Fe provided the conditions reduce Fe3+ to Fe2+. Probably a sample would show peaks due to Mn2+ or Fe2+ but seldom both at the same time. In oxidising conditions, the ESR peaks of Mn4+ and Fe3+ could interfere when there was an unusual amount of Mn present. ACKNOWLEDGMENTSWe thank
Professor Morikawa for helpful discussions. N.E.W. wishes to thank the Japanese
Society for the Promotion of Science for a Senior Fellowship, and acknowledge
remarkable hospitality from Prof. M. Ikeya, all in his department, and those
at
Note: Electronic Journal of Biotechnology is not responsible if on-line references cited on manuscripts are not available any more after the date of publication. Copyright 2004 by Universidad Católica de Valparaíso -- Chile The following images related to this document are available:Photo images[ej04033f4a-b.jpg] [ej04033f3a-b.jpg] [ej04033f2.jpg] [ej04033f3c-d.jpg] [ej04033f1a-b.jpg] |
| |||||||||
