
|
Electronic Journal of Biotechnology
Universidad Católica de Valparaíso
ISSN: 0717-3458
Vol. 8, Num. 2, 2005, pp. 146-161
|
Electronic Journal of Biotechnology, Vol. 8, No.2, August 15, 2005, pg.
146-161
RESEARCH ARTICLE
Continuous citric acid secretion by a high specific pH dependent
active transport system in yeast Candida oleophila ATCC 20177
Savas Anastassiadis*#1, Hans-Jürgen Rehm2
1Department of Environmental Engineering,
School of Engineering,
Democritus University of Thrace,
67100 Xanthi, Greece,
E-mail: sanasta@env.duth.gr
2Institute of Microbiology,
University of Münster, Corrensstr.
3, 48149 Münster, Germany,
(retired Professor) Website: http://www.greekbiotechnologycenter.gr
*Corresponding author
Present address: #Research in Biotechnology, Co., Vat. #:
108851559. Avgi/Sohos, 57002 Thessaloniki, Greece;
Tel. +30-2395-051324; +30-6973-801395 (cellular); Tel./Fax. +30-2395-051470,
E-mail: sanastassiadis@netscape.net.
Financial support: Part of the work that
has been carried out at the Institute of Biotechnology 2 of Research Centre
Jülich (Germany) was financed by Haarmann
and Reimer, a daughter company of the company Bayer, Leverkusen, Germany.
Received November 22, 2004 /
Accepted March 28, 2005
Code Number: ej05017
Abstract
The pH influence on continuous citric acid secretion was
investigated in Candida oleophila ATCC 20177 (var.) under NH4+ limiting
state steady conditions, using glucose. Highest citric acid concentration
of 57.8 g/l, citrate/isocitrate ratio of 15.6, space-time yield of 0.96 g/(l
x hr) and biomass specific productivity of 0.041 g/(g x hr) were obtained
at pH 5 and 60 hrs residence time. Only 22.8 g/l (39.4%) and a ratio of 9.9
were achieved at pH 6 pH and 12.4 g/l (21.5%) and a ratio of 3.7 at pH 3.
Under non producing conditions, in excess of nitrogen, biomass concentration
increased at raising pH. An iron concentration of 200 ppm was determined
in biomass of C. oleophila at pH 5, compared with only 26 ppm found
at pH 3 (factor 7.7). Intra- and extracellular concentrations of citrates
and glucose confirmed the existence of a high specific, pH dependent active
transport system for citrate secretion, while isocitrate isn’t a high-affine
substrate, displaying a strong correlation with ATP/ADP ratio. Differences
between extra- and intracellular concentration of citrate higher than 1 and
up to about 60 were determined. The active transport systemfor citrate excretion
appears to be the main speed-determining factor in citrate overproduction
by yeasts.
Keywords: active citrate export, citric acid fermentation,
energy consuming citric acid secretion, specific active transport system.
Although citric acid production using mutant strains of A. niger or
yeast strains has almost been extensively optimised, there is still no comprehensive
explanation for citrate overproduction, and many aspects related to citrate
accumulation and secretion remain unclear. There are many similarities between A. niger and
yeast strains in mechanism of citric acid synthesis, however, differences still
exist in terms of triggering out and regulation of citrate overproduction.
Many models have been developed describing the biochemistry of citrate synthesis,
using glucose and other carbon sources, however a complete picture of formation
pathway, regulation and secretion has not been described.
Overproduction of citric acid in moulds and yeast has been
reported to be triggered out by limitations of certain elements, like N, P,
Mn, Fe or Zn, essential for citrate accumulation in A. niger (Shu
and Johnson, 1948a; Shu and Johnson, 1948b; Noguchi
and Johnson, 1961; Kisser et al. 1980; Kubicek
and Röhr, 1980; Kapoor et al. 1982; Kristiansen
et al. 1982; Crueger and Crueger, 1989; Dawson
and Maddox, 1989; Grewal and Kalra, 1995), as well as
N, P, S and Mg in yeasts Yarrowia lipolytica and Candida oleophila (Lozinov
et al. 1974; Behrens et al. 1987; Stottmeister
and Hoppe, 1991; Anastassiadis, 1994; Anastassiadis
et al. 2001; Anastassiadis et al. 2002; Anastassiadis
et al. 2004). The yeasts can use various carbon sources for the formation
of citric acid (Ikeno et al. 1975; Stottmeister
and Hoppe, 1991; Grewal and Kalra, 1995; Mansfeld
et al. 1995; Crolla and Kennedy, 2001; Crolla
and Kennedy, 2004; Venter et al. 2004) or lipid production
(Papanikolaou and Aggelis, 2002). Intracellular nitrogen
limitation and low intracellular nitrogen content (Briffaud and
Engasser, 1979; Moresi, 1994; Anastassiadis
et al. 2002; Anastassiadis et al. 2004), occurring after
extracellular nitrogen exhaustion and entering a transition phase, and the
increase in intracellular NH4+ concentration, possibly
caused by proteolysis, are the most important factors influencing and triggering
out citric acid formation and secretion in yeasts (Anastassiadis
et al. 1993; Anastassiadis 1994; Anastassiadis
et al. 1994; Anastassiadis et al. 2001; Anastassiadis
et al. 2002; Anastassiadis et al. 2004). Intracellular
accumulation of NH4+ found in cytoplasm of A. niger (Röhr
and Kubicek, 1981; Habison et al. 1983) and in Candida oleophila (Anastassiadis
et al. 2002), possibly caused by a disturbances in protein or nucleic acid
turn over, uncouples citrate feed back inhibitory effect on phosphofructokinase,
enabling an unlimited flow through glycolysis. A further increase of glycolysis
flow is obtained by the stimulation of pyruvate kinase through fructose bi-phosphate
(Habison et al. 1979; Kubicek and Röhr, 1980; Habison
et al. 1983; Kubicek et al. 1984; Milson
and Meers, 1985). A negative effect on pyruvate kinase isn’t known, so
there is no need for any kind of control at this point (Meixner-Monori
et al. 1984).
Utilizing glucose as carbon source, the basic principle, extensively
investigated in A. niger, of oxaloacetate formation by anaplerotic sequences, e.g. by
the key enzyme pyruvate carboxylase for citric acid production, (Kapoor
et al. 1982; Milson, 1987; Peksel et al.
2002) and phosphoenol carboxykinase (Crueger and Crueger,
1989), the flux delay and inhibition of TCA cycle (α-oxoglutarate
dehydrogenase inhibition) and high activity of citrate synthase, is also valid
for yeast strains. Glyoxylate cycle is involved in citric acid synthesis in
case that acetate, other C2 sources or aliphatic compounds are used
as carbon sources. A positive control of phosphofructokinase by ammonium ions,
enabling supply of citrate synthase by acetyl-Co A and oxaloacetate, even a
possible repression of α-ketoglutarate dehydrogenase through high glucose
and ammonium concentration (Kubicek and Röhr, 1978; Röhr
et al. 1983), or inhibition of its activity by oxaloacetate (Meixner-Monori
et al. 1985) doesn’t explain completely intracellular accumulation and
secretion of citric acid. Cis-aconitate has also been assumed to inactivate
the only irreversible reaction of tricarboxylic acid cycle (Kubicek
and Röhr 1986). The increasing concentration of α-ketoglutarate caused
by oxaloacetate inhibition, inhibits isocitrate dehydrogenase and thus a further α-ketoglutarate
formation. As a result, increasing citrate concentration inhibits isocitrate
dehydrogenase and reaching a critical level it stops its further metabolism
(Agrawal et al. 1983; Meixner-Monori et al.
1985; Grewal and Kalra, 1995), causing a complete block
of TCA cycle. An additional block of citrate cycle occurs at succinate dehydrogenase
level by oxaloacetate.
Significant cytological, morphological and physiological changes
(e.g. cell wall composition, cell compartmentalization, pellet formation,
vacuolization and formation of storage compounds and polyols) take place in
both microbial systems and clear variations are occurring in terms of electron
transport and energy coupling (Kisser et al. 1980; Honecker
et al. 1989; Papagianni et al. 1999; Paul
et al. 1999; Pera and Callieri, 1999; Anastassiadis
et al. 2002; Haq et al. 2002). Alternative respiration
chains with a higher oxygen demand, functioning without yielding of ATP has
also been reported to be involved in citrate accumulation (Kubicek
et al. 1980; Zehentgruber et al. 1980; Röhr
et al. 1983; Wallrath et al. 1991), leading to higher
glucolysis rate and substrate phosphorylation (Wallrath et al.
1991). Byproducts (e.g. polyols) are produced in late fermentation
phases that can be reconsumed forming citric acid.
The overall success of citric acid production depends to a
large extent on the regulation of the TCA cycle. However, the excretion mechanism
in A. niger remained
unclear (Grewal and Kalra, 1995).A little information is
found in literature regarding the mechanism of citric acid secretion in yeasts
and fungi. Whereas transportation of citrate from mitochondria into cytoplasm
by citrate malate translocase is well known, excretion mechanism of citrate
from cytoplasm into the medium still remained unknown. Marchal
et al.(1980) found almost equal concentrations of citrate and isocitrate
in the cells of C. lipolytica and in fermentation medium, suggesting
a passive diffusion of citrate and isocitrate over cell membrane. McKayet al.(cited
in Gutierrez and Maddox, 1993) assumed a passive diffusion
of citrate and isocitrate over the cell membrane, in which the extracellular
ratio between citrate and isocitrate corresponds to the intracellular ratio.
Intracellular accumulation of citric acid and citrate secretion are obviously
two different phenomena. A specific active transport system for citric acid
secretion preferring citrate over isocitrate was found for the first time in Candida
oleophila, based on simultaneous extra- and intracellular measurements
of citrates and glucose acting as speed determining factor, well explaining
overproduction of citric acid against a very high concentration gradient between
the cell and fermentation medium (Anastassiadis et al. 1993; Anastassiadis,
1994; Anastassiadis et al. 1994; Anastassiadis
et al. 2001; Anastassiadis et al. 2002). Netik
et al. (1997) reported later about a ΔpH-driven H+-symport
dependent system for citric acid export in manganese-deficient cells of A. niger,
also claiming that only a passive diffusion through plasma membrane had been
before reported for citrate excretion in yeasts.
The central aspect of present work was to investigate the
influence of pH on continuous citric acid secretion by a specific active transport
system, as well as on the elemental biomass composition in free growing chemostat
cultures of Candida oleophila ATCC 20177. A mechanism for citric acid
secretion by a specific pH dependent active transport system is presented.
Materials and Methods
Microbial system
Candida oleophila ATCC 20177 var. (obtained from Dr.
Siebert, Jungbunzlauer Co. and later H and R, Bayer, Germany)
was used through all experiments in this present work that was selected under
many yeast strains during an extensive screening (Anastassiadis
et al. 1993; Anastassiadis, 1994; Anastassiadis
et al. 1994; Anastassiadis et al. 2001; Anastassiadis
et al. 2002). Yeast malt extract agar plates (YME) inoculated with C.
oleophila were incubated for 2-3 days and stored at 4ºC.
Cultures were refreshed every 2-3 months. Glycerine cultures (30% glycerine)
were frozen at -20 or -80ºC as
well.
Chemostat experiments
The influence of pH on continuous citric acid fermentation
and secretion was investigated in chemostat experiments carried out in 1 litter
magnetically stirred double glass fermenter (Research
Centre Jülich, RCJ, Germany) with a working volume of about 460 ml at 30ºC,
1300 rpm and a constant aeration rate of 0.145 vvm. Pure oxygen was used in
order to satisfy the low oxygen transfer in small glass fermenter. At the beginning
of experiments, the microorganism was simply transferred from a fresh agar
plate into fermenter via a shake flask supplied with silicon tubing and quick
connectors using a peristaltic pump. Temperature was controlled using a circulation
water bath (Lauda KG, Königshofen, Germany).
pH was automatically controlled by the addition of 22.5% NaOH solution (w/v)
using a pH controller (Ingold Meßtechnik GmbH, Steinbach) and a peristaltic
pump. An automatic gravimetric dosing system (Sartorius,
Göttigen, Germany)
and a peristaltic pump (Watson-Marlow
Ltd.) were used for constant medium feeding into fermenter. The residence
time (hr) that corresponds to 1/dilution rate (1/D) was calculated under steady
state conditions based on the working volume of fermenter via medium feed flux
and NaOH flux. Residence time is the time required to replace once the working
volume of fermenter. Achieving of steady state conditions was detected by monitoring
the concentration of products, substrate and biomass and optical density (OD)
on a daily basis. During entire fermentation and until achieving state conditions,
samples were frequently taken out and analysed on a daily basis. Continuous
fermentation was still carried out for a while under unchanged conditions,
also after achieving steady state conditions. Fermentation times of several
days or weeks were often required for achieving steady state conditions. During
entire duration of fermentation, medium feeding rate, NaOH consumption and
physical parameters (e.g. pH of fermentation broth was periodically
measured externally and corrected) were measured and evaluated. Fermentation
data presented here didn’t result from just only one single measurement, however
they were obtained based on long time measurements during continuous fermentation,
meaning several days or weeks, until reaching steady state conditions. They
represent an average of several measurements attained after achieving steady
state conditions during a period of several days. Chemostat cultures carried
out under controlled constant conditions are tending to reach steady state
conditions, in which all fermentation parameters are remaining constant (unchanged)
as time passes. In generally, between five and 10 generations (residence times,
RT) are necessary for getting steady state conditions, depending on process
and strain stability.
Feed medium (basic medium,
BM)
A basic fermentation medium of following composition was used
in a series of experiments for the preliminary orientation’s investigation
of pH influence on iron uptake and citrate formation (BM): 3 g/l NH4Cl,
120 g/l glucose, 0.7 g/l KH2PO4, 0.35 g/l MgSO4 x
7H2O, 0.11 g/l (0.5 mM) MnSO4 x 4H2O,
5 μM FeSO4 x 7H2O, 0.001 g/l CuSO4 x
5H2O, 0.021 g/l ZnSO4 x 7H2O, 0.004
g/l CoSO4 x 7H2O, 0.04 g/l H3BO3,
0.1 g/l CaCl2, 0.1 g/l NaCl, 0.1 mg/l potassium iodide (KJ), 2.5
g/l citric acid, 0.2 mg/l Na2MoO4 x 2H2O,
2 mg/l Thiamine-HCl, 0.25 mg/l Biotin, 0.625 mg/l Pyridoxine-HCl, 0.625 mg/l
Ca-D-Pantothenate, 0.5 mg/l Nicotinic acid.
Non producing medium
(BM with 6 g/l NH4Cl and 120 g/l glucose)
The basic medium, however with 6 g/l NH4Cl, 120
g/l glucose and 0.5 mM iron,
was used for the investigation of pH influence on biomass formation under non
producing conditions.
Production medium
In a second series of experiments, a production medium with
4.5 g/l NH4Cl, analogously increased concentrations of residual
compounds (at factor 1.5 higher than in medium with 3 g/l NH4Cl),
however with 1.125 mM manganese and without iron
supply, and with 250 g/l glucose was used for the investigation of pH influence
on citric acid secretion.
Medium composition
4.5 g/l NH4Cl, 250 g/l glucose, 1.05 g/l KH2PO4,
0.525 g/l MgSO4 x 7H2O, 0.2475 g/l (1.125 mM) MnSO4 x
4H2O, 0 μM FeSO4 x 7H2O, 0.0015
g/l CuSO4 x 5H2O, 0.0315 g/l ZnSO4 x
7H2O, 0.006 g/l CoSO4 x 7H2O, 0.06
g/l H3BO3, 0.15 g/l CaCl2, 0.15 g/l NaCl,
0.15 mg/l potassium iodide (KJ), 2.5 g/l citric acid, 0.3 mg/l Na2MoO4 x
2H2O, 2 mg/l Thiamine-HCl, 0.375 mg/l Biotin, 0.9375 mg/l Pyridoxine-HCl,
0.9375 mg/l Ca-D-Pantothenate, 0.75 mg/l Nicotinic acid.
Silicon oil or polypropylene glycol was used as antifoaming
agent. The 20 litter medium was sterilized in autoclave for 30-60 min at 121ºC. Vitamins and NH4Cl
were added separately into media following filtration through a 0.2 μm
membrane filter (Sartorius, Göttingen, Germany).
The glucose concentration and specific weight (g/ml) of each new medium and
the specific weight of each new NaOH solution were determined and considered
in all of following evaluations (e.g. determination of RT, real glucose
concentration of feeding medium, specific parameters).
Optical density (OD)
Optical density (OD) was measured at 660 nm using a spectrophotometer
(CPS-240, Shimadzu, Japan)
and it was used for daily monitoring of achieving steady state conditions in
fermenter.
Dry biomass
Dry biomass was measured using the filter method. 10 ml of
fermentation broth were quickly filtered through a 5
cm diameter filter with 0.2 μm pores. The biomass
was washed 3 to 4 times with 0.9% NaCl solution and distilled water and dried
for 10 min in a microwave oven at a low power between 200 and 400 watt in order
to prevent burning of biomass. After stabilizing of weight in a desiccator
for 15 min, dry biomass was determined by the difference of weight before and
after filtration and drying of filter.
Qualitative and quantitative analysis
Organic acids, glucose, ammonia nitrogen and intracellular
concentrations were analysed as described in Anastassiadis, 1993; Anastassiadis
et al. 1993; Anastassiadis, 1994; Anastassiadis
et al. 2001 and Anastassiadis et al. 2002.
A new HPLC application was developed for the analysis
of carbonic acids that can separate the chemically related citric and isocitric
acid (Anastassiadis, 1993; Anastassiadis et al.
1993). A solvent with 5 mM TBA
(tetrabutyle ammonium hydrogen sulphate) and 2% acetonitrile was used as mobile
phase at a flow rate of 1 ml/min. The column temperature was kept at 37ºC.
An 5 C18 AB column (Macherey and
Nagel, Düren, Germany)
was used as stationary phase. A pressure of 0.4-0.5 bar was applied in the
eluent bottle using helium gas. The substances were detected by a UV detector
at 210 nm and the concentrations were evaluated by a computer program (AXXIOM).
The same method was also used by Antonucci et al. (2001) for
the separation and analysis of citric and isocitric acid (no reference to above
method). For glucose analysis, an HPLC application was developed that also
enables separation glucose from gluconic acid. A Nucleosil NH2 column
and a mobile phase with 75% acetonitrile were used at 40-45ºC and 1-1.5 mL/min flow rate
(Anastassiadis et al. 1993; Anastassiadis, 1994; Anastassiadis
et al. 1994; Anastassiadis et al. 2001; Anastassiadis
et al. 2002). The eluent was able to use for longer time, because of the
eluent’s high toxicity (no microbial growth occurred in the eluent at 75% acetonitrile).
Glucose was detected using an RI detector (S4110/S 1000, Sykam).
Intracellular measurements of citric
and isocitric acid and glucose
Intracellular concentrations of citric, isocitric acid and
glucose were precisely evaluated using the above HPLC methods after their extraction
following next procedure.
- 10 ml of fresh fermentation broth of known biomass concentration
(tubes were hold in ice) were immediately filtered using a vacuum pump
and washed 3-4 times using a cold 0.9% NaOH solution.
- Intracellular acids and glucose were extracted by placing
the filter with biomass in boiling ethanol for 5 min. Thereafter, filter
and solids were dried using a vacuum rotator and resolved in 5 ml distilled
water.
- The sample was filtered using a filter with 0.2 μm
pores and analysed. No destruction of metabolites was found in the
controls submitted to the same treatment method.
- Intracellular concentrations of various metabolites were
determined and presented in g per gram dried biomass or in mM (under
the consideration that cell volume corresponds to an average value of about
2.2 µl/mg
dry weight that was determined) based on the report of Marchal et al. (1980) for
cell volume of Saccharomycopsis lipolytica. The authors give
an average value of 0.43 ml x (g wet weight)-1. The above
value of 2.2 µl/(mg
dry weight) was calculated according to the ratio between wet and dried
weight of about 5 determined for cells of C. oleophila (used
in present work).
Similar values were determined for cell volume of C. oleophila as
well, using a method involving a radioactive polymer, which can not diffuse
into the internal volume of yeast cells (D. Brücher, RCJ). In generally, cell
volume of microorganisms arranges between 2 and 4 µl/(mg dry weight) (Knowles,
1977). Höfer et al. 1985 determined a value of 2 µl/(mg
dry weight) for the cell volume of Rhodotorula gracilis (glutinis).
ATP and ADP analysis
ATP and ADP ratio was determined at the Institute of Biotechnology
1 of Research Centre
Jülich (Jülich, Germany)
using the luciferin/luciferase method for ATP measurement. After measurement
of ATP, ADP was first transformed into ATP using PEP and pyruvate kinase and
measured as ATP (Lundin et al. 1976, modified; Schimz
et al. 1981).
Ammonium nitrogen analysis
Ammonium nitrogen was analysed as has been described in Anastassiadis
et al. (2002).
Results
The influence of pH on the growth and elemental biomass composition
of C. oleophila and citric acid secretion was investigated in different
series of chemostat experiments.
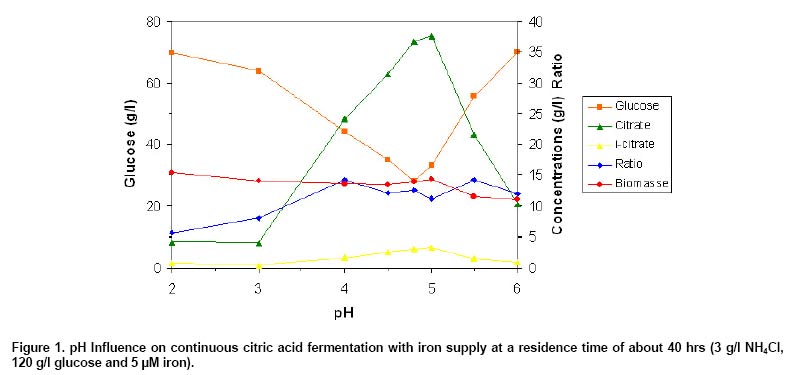
pH influence on continuous
citric acid formation (3 g/l NH4Cl and 120 g/l glucose)
The influence of pH on growth of C. oleophila and continuous
citric acid formation was investigated in a series of preliminary orientation’s
experiments, carried out in chemostat cultures at a residence time of about
40 hrs (D = 0.025 h-1) using the basic fermentation medium (BM)
with 3 g/l NH4Cl and 120 g/l glucose. Figure 1 illustrates
the course of biomass, glucose, citrate and isocitrate concentration as well
as the ratio between citrate and isocitrate as a function of pH. Citric acid
was continuously produced at a pH range between 2 and 6. Only 4.22 g/l of citric
acid were measured at pH 2 and 4.02 g/l at pH 3. Increasing the pH from 3 to
4, citric acid concentration increased continuously by a factor of about 6
reaching a steady state concentration of 24.1 g/l after several days. Isocitric
acid reached in generally a stationary steady state concentration within shorter
times compared with citrate. Highest citrate concentration of 37.6 g/l was
achieved at pH 5, compared with 24.1 g/l and only 10.2 g/l reached at pH 4
and pH 6, respectively. Isocitric acid reached concentrations between 0.5 and
3.36 g/l. A ratio between citrate and isocitrate of around 12 was determined
at most of pH values. Residual glucose concentrations between 27 g/l (pH 5)
and 70.2 g/l (pH 6) or 69.7 g/l (pH 2) were measured under steady state conditions,
corresponding to conversions (conversion means the consumed glucose/feeding
medium glucose, scale 0-1, which corresponds to 0-100%; 100% conversion corresponds
to total conversion of glucose) between 40% and about 76% (Figure
2). The decreasing of pH, resulted to continuous increase of biomass concentration,
starting with about 11 g/l biomass at pH 6 and reaching 15.3 g/l at pH 2 (factor
1.4) (Figure 1). A correlation factor between 0.27 (pH
5.5) and 0.34 (pH 2) has been determined between biomass and OD (Biomass/OD).
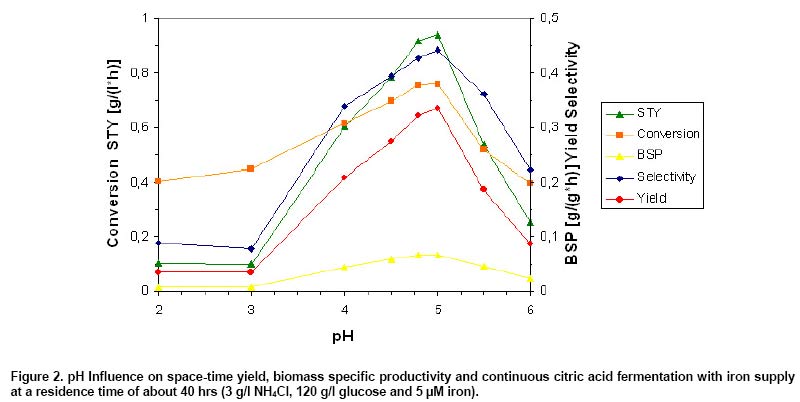
As Figure 2 shows, product concentration,
space-time yield (STY, volumetric productivity that means g product/[litter
x hr]), biomass specific productivity (BSP, it means g product/[g dry biomass
x hr]) and additional specific parameters were very poor at lower pH values
(e.g. pH 2 and 3) in opposite of higher biomass concentrations. Highest
STY of 0.94 g/(l x hr) was achieved at pH 5 and BSP of 0.067 g/(g x hr) at
pH 4.8 compared with 0.11 g/(l x hr) and 0.0069 g/(g x hr) found at pH 3. Highest
selectivity (selectivity means g of product/g of converted glucose; scale 0-1
or in %) of 44.3%, yield (yield means g of product/g of feeding glucose; scale
0-1 or in %) of 33.6% and conversion of 75.9% were determined at pH 5 as well.
About 7.7% selectivity, 3.5% yield and 45% conversion were determined at pH
3 instead (Figure 2). Similar results were observed in
further experiments with 3 g/l NH4Cl, 120 g/l glucose and without
any iron supply (data not shown here), indicating that traces of iron are present
in other media components.
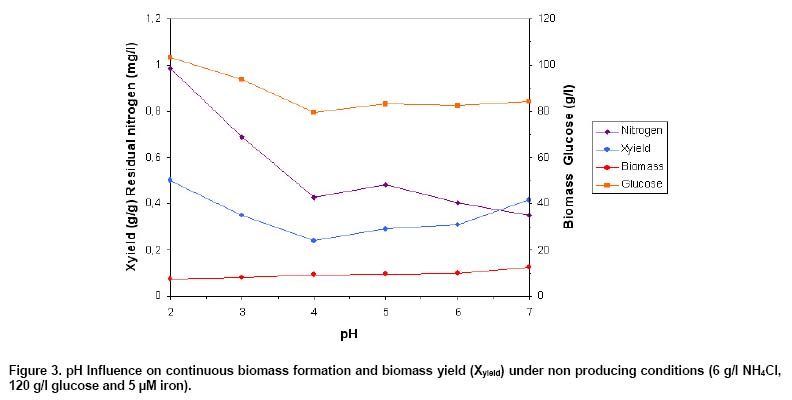
pH influence on continuous
biomass formation under non producing conditions (6 g/l NH4Cl
and 120 g/l glucose)
A series of chemostat experiments was carried out at pH between
2 and 7 for the investigation of pH influence on continuous growth of C.
oleophila, independent from citric acid production. The basic medium as
has been described in the material and methods was used, which contained an
excessive NH4Cl concentration of 6 g/l and 0.5
mM iron. Residual nitrogen was measured in all of the
experiments, which decreased from 0.99 g/l (pH 2) to 0.35 g/l (pH 7). No citric
acid was formed by C. oleophila in the presence of nitrogen in agreement
of previous reports (Anastassiadis et al. 2002; Anastassiadis
et al. 2004). The residual glucose reached values between 79.7 g/l (pH
4) and 103.3 g/l (pH 2), corresponding to glucose conversions (g of consumed
glucose/g glucose of feeding medium) between 32.6% and 12.7%, respectively.
Biomass concentration dropped continuously at raising pH between 2 and 6, from
7.4 g/l to 12.3 g/l (factor 1.67). Biomass yields (g biomass/g of consumed
glucose) between 0.24 (pH 4) and 0.5 (pH 2) were determined dependent on pH
in fermenter (Figure 3).
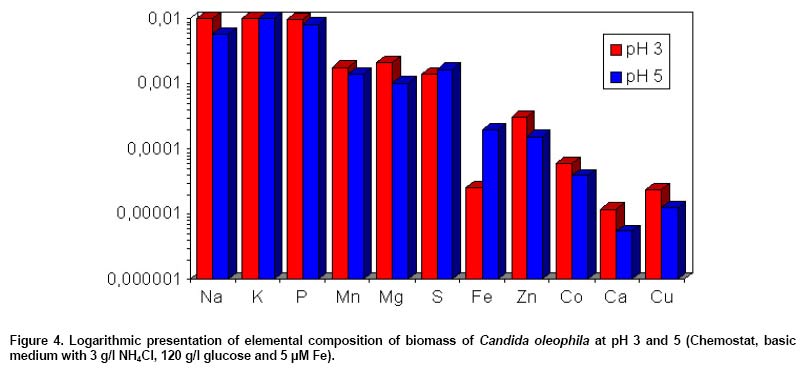
Elemental biomass composition of C.
oleophila at pH 3 and 5 (basic medium with 3 g/l NH4Cl
and 120 g/l glucose)
The elemental biomass composition in biomass of C. oleophila,
obtained from chemostat cultures grown at pH 3 and pH 5, was analysed by the
Analytical Chemistry Department of RCJ (Jülich, Germany). Figure
4 shows the elemental composition at pH 3 and 5, which is presented
as the logarithm of element concentration. No significant differences were
found in the content of macroelements (P, S) between pH 3 and pH 5. However,
a higher content of the trace elements zinc, cobalt, calcium and copper (excess
factors, needed at higher concentrations than the biomass contains for optimum
production) was found in biomass of C. oleophila at pH 3. Slightly higher
are the concentrations of sodium, magnesium and manganese at pH 3. The iron
content of 200 ppm found in biomass of C. oleophila at pH 5 was at about
factor 8 higher than at pH 3 (26 ppm), indicating a facilitating iron uptake
in Candida oleophila at higher pH.
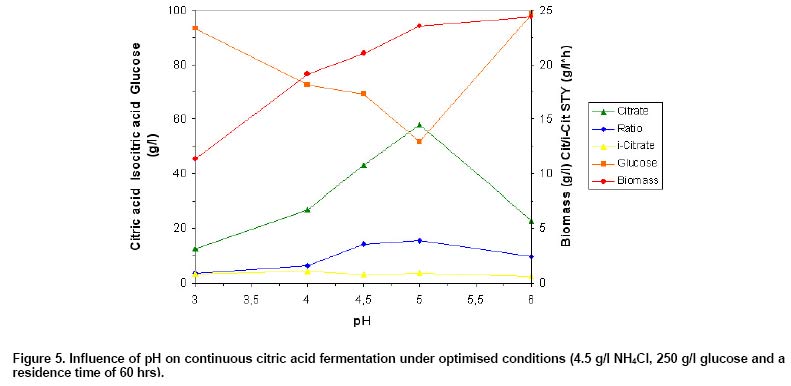
pH influence on continuous citric acid
secretion by the specific active transport system (4.5 g/l NH4Cl
and 250 g/l glucose)
In a new series of chemostat experiments, the pH influence
on intracellular concentrations of citrates and glucose and on citric acid
secretion was investigated at a residence time of about 60 hrs (corresponds
to a dilution rate of about D=~0.017 h-1), using an optimised production
medium with 4.5 g/l NH4Cl, 250 g/l glucose, 1.125 mM of manganese and without
iron supply (traces of iron are present in other chemical compounds). The addition
of iron has been found to enhance biomass formation and to affect continuous
citric acid production significantly. As Figure 5 shows,
a maximum citric acid concentration of 57.8 g/l was achieved at pH 5, compared
with 43.1 and only 22.8 g/l reached at pH 4.5 (factor 1.34 or 74.6%) and pH
6 (factor 2.54 or 39.5%), respectively. Only 12.4 g/l were obtained at pH 3
(factor 4.7 or 21.5%). The highest ratio between citrate and isocitrate of
15.6 was also found at pH 5, compared with only 3.7 or 9.9 identified at pH
3 and 6, respectively. Highest isocitric acid concentration of 4.2 g/l was
measured at pH 4 instead. Biomass concentration increased steadily with raising
pH and achieved 23.54 g/l at pH 5 and 24.42 g/l at pH 6, corresponding to a
factor of 2.16 between pH 6 and pH 3 (11.3 g/l).
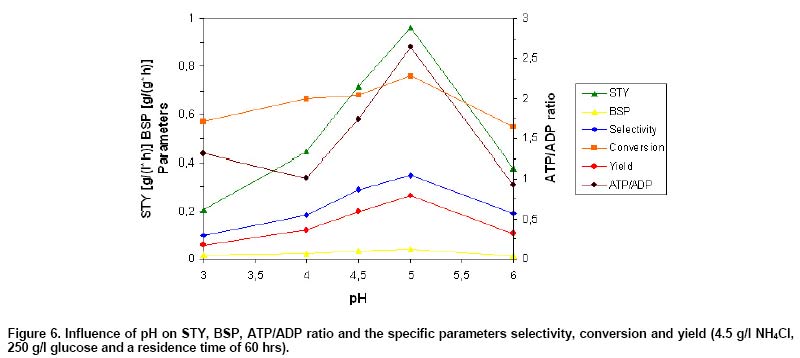
Figure 6 shows space-time yield (STY),
biomass-specific productivity (BSP), the ratio between ATP and ADP and the
specific parameters product selectivity, conversion and product yield as a
function of pH. Highest STY of 0.96 g/(l x hr) was obtained at optimum pH 5,
compared with only 0.21 g/(l x hr) or 0.38 g/(l x hr) reached at pH 3 (21.5%)
and pH 6 (39.5%). Highest BSP of 0.041 g/(g x hr) was also found at pH 5, in comparison to only 0.018 g/(g x
hr), 0.0156 g/(g x hr) or 0.034 g/(g x hr), achieved at pH 3 (44.7%), pH 6
(38%) and pH 4.5 (83.3%), respectively. Highest product selectivity of 35%,
conversion of 76%, yield (yield = selectivity x conversion) of 26.6% and ratio
between ATP and ADP of 2.65 were determined at optimum pH 5 as well. In comparison,
a selectivity of only 10%, conversion of 57%, yield of 5.7% and an ATP/ADP
ratio of 1.31 were determined at pH 3 (Figure 6). The
ratio between ATP and ADP correlated very strongly with the extracellular citrate
concentration and the ratio between citrate and isocitrate, displaying a maximum
at optimum pH 5, whereas isocitric acid showed a flat course, indicating a
very strong connection between overproduction of citrate and energy state of
yeast cells. Optimisation attempts running in chemostat experiments are favourably
carried out at conversions lower than 80%, because the complete conversion
wouldn’t enable the identification of complex and interacting effects occurring
during an optimisation approach.
The existence of an active transport system for citric acid
secretion in C. oleophila became obvious, based on citric acid transport
over the cell membrane against a very high concentration gradient between intra-
and extracellular citrate concentration. The active transport system was influenced
by various parameters such as air saturation, temperature, medium composition
and growth state of chemostat cells (residence time, growth or dilution rate).
It showed a very high specificity for citrate over isocitrate (specificity
factor of 33). Furthermore, the highest intracellular concentrations of citrate,
isocitrate and glucose and simultaneously the lowest extracellular citric acid
concentrations were determined under none or low producing conditions. In contrary,
maximum extracellular citric acid concentrations were reached under conditions,
where the lowest intracellular concentrations of citrate and isocitrate appeared.
Intracellular isocitric acid concentration exceeded citric acid concentration
significantly. Under producing conditions, isocitrate was drawn out from aconitase
equilibrium towards citrate, resulting to a higher glycolysis rate and to lowering
of intracellular concentration of glucose and isocitric acid (Anastassiadis
et al. 1993; Anastassiadis, 1994; Anastassiadis
et al. 1994; Anastassiadis et al. 2001). Based on intracellular
measurements of glucose, citrate, isocitrate as well as of ATP and ADP (ATP/ADP
ratio) has been investigated, whether there would be a pH dependency for citric
acid secretion by active transport system.
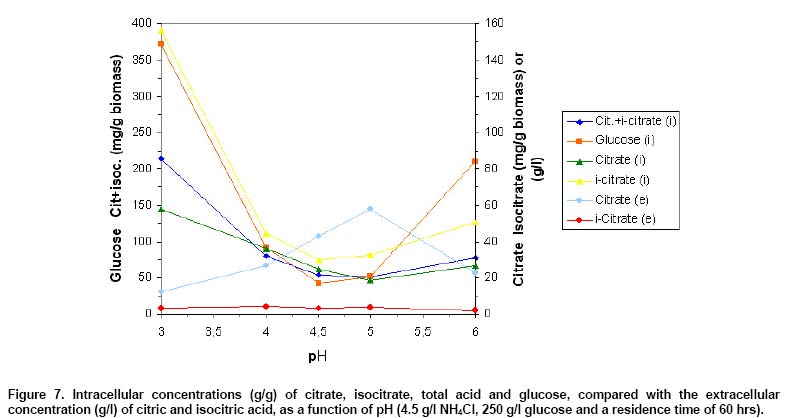
As Figure 7 shows, the highest
intracellular glucose concentration of 372 mg/g dried biomass, citrate concentration
of 57.6 mg/g (~136,3 mM, under the consideration that the cell volume of C.
oleophila corresponds to 2.2 µl/mg dry weight, calculated from the cell
volume for wet weight; Marchal et al. 1980, under the condition
that 1 g dried biomass
of C. oleophila corresponds to about 5 g wet weight) and isocitrate concentration
of 156.4 mg/g (370.1 mM)
were measured at non producing pH 3. However, the lowest intracellular citrate
concentration of only 18.6 mg/g dried biomass (~44.1 mM) and total acid concentration
(citrate + isocitrate) of 51.3 mg/g dried biomass (~121.4 mM) were found at
optimum pH 5. The lowest intracellular isocitrate concentration of 30.2 mg/g
dried biomass (32.7 mg/g biomass at pH 5) and glucose concentration of 43 mg/g
biomass (52 mg/g biomass at pH 5) were determined at pH 4.5 instead (Figure
7). Present results are a very strong confirmation, that not the intracellular
citrate accumulation alone, however the active secretion of citrate over plasma
membrane is the speed determining factor for citric acid excretion, displaying
an optimum at pH 5. Highest extracellular citrate concentration was found under
conditions, where the lowest total acid and glucose concentration occurred,
as a result of intensive citrate secretion. A higher glucose uptake and glycolysis
rate is proposed at optimum pH 5.
Discussion
Many reports exist related to the influence of initial or
operating pH and other fermentation parameters on citric acid fermentation.
Basically, most investigations were carried out in batch experiments running
in stirrer fermenter or shake flasks (Nubel et al. 1971; Briffaud
and Engasser, 1979; Kozlova et al. 1981; Lozinov
and Finogenowa, 1982; Enzminger and Asenjo, 1986; Behrens
et al. 1987; Rane and Sims, 1993; Antonucci
et al. 2001; Crolla and Kennedy, 2001). However, no information
was found about the influence of pH on the continuous citric acid secretion
and a little is known regarding the real pH effect on citrate formation. Kinetic
data obtained in chemostat cultures give essential information for sophisticated
process design, process development and scale up. This type of information
for continuous citric acid fermentation is rather rare in literature. For instance,
looking in the internet about 15,200 results was found as compared with 89
for chemostat (Anastassiadis et al. 2004). Tisnadjaja
et al. (1996) reported about a higher productivity of citric acid using C.
guilliermondii in continuous culture compared with the batch process. About
a four stage process for continuous production of citric acid using A. niger has
been reported by Wieczorek and Brauer (1998).
The active citric acid export found for the first time in
yeasts has been shown in present work to be a strongly pH dependent process.
The pH had a remarkable effect on the growth, the elemental biomass composition
and the secretion of citric acid in C. oleophila, displaying a production
optimum and higher biomass iron content at pH 5. Already very low iron (cofactor
of aconitase) concentrations (<20 µM) affect dramatically citric acid formation
and ratio between citrate and isocitrate. On the other side, Crolla
and Kennedy (2001) reached highest citrate production in C. lipolytica using
10 mg/l ferric nitrate. Iron is essential for yeast growth, however a little
is known about the mechanism of its assimilation. Shavloskii
et al. (1988) identified an active iron uptake system in Pichia quilliermondii with
an optimum at pH 5.3 and 37ºC,
whereas small pH alterations caused a dramatic lost of its uptake activity
(90%). Kamzolova et al. (2003) reported about the dependency
of oxygen requirements for the growth of Y. lipolytica and of citric
acid synthesis on iron concentration. Oexle et al. (1999) reported
about the modulation of the expression of the critical citric acid cycle enzyme
aconitase via a translational mechanism involving iron regulatory proteins
in human cell lines and the iron effect on other citric acid cycle enzymes.
Most of published works regarding citric acid production by
yeasts were performed at pH between 4.5 and 5.5 (Briffaud and
Engasser, 1979: pH 4.7; Enzminger and Asenjo, 1986: pH
5.0; Klasson et al. 1989: pH 5.5; Grewal and
Kalra, 1995: pH >5.5; Anastassiadis et al. 2004). Nubel
et al. (1971) reported on the other side about citric acid production in Candida (Yarrowia) lipolytica ATCC
20228, occurring even at lower pH. The yeast process differs from Aspergillus niger in
terms of optimum pH operation, where pH lower than 2 is necessary for optimum
citric acid production (Rehm, 1980; Grewal
and Kalra, 1995; Netik et al. 1997). An optimum pH of
1.7 has been reported for continuous citric acid fermentation by A. niger (Kristiansen
and Charley, 1981). On the other side, Roukas and Harvey
(1988) claimed an optimum pH of 4 for continuous citric acid production
in A. niger.
A sharp maximum around pH 3.4 has been found for continuous citric acid fermentation
by A. foetidus (Kristiansen and Sinclair, 1979). Alternatively, Penicillium strains
are producing citric acid at pH between 4 and 7 (Schinner and
Burgstaller, 1989; Franz et al. 1991). Some variations
in intracellular compartmentalization, pH topographies and differentiations
in pH gradient (inside/outside) or regulation mechanisms may provide the explanation
for those differences between various microbial systems. Roos
and Slavik (1987) found two separate layers in cytoplasm of P. cyclopium (citrate
producer), a thin outer layer with a pH of 5 and a greater core layer with
approximate neutral pH.
The lower citric acid production occurring at lower pH in
yeasts could be theoretically attributed to reduced intracellular citrate formation
or/and inhibition of citrate transport over the mitochondrial or cytoplasm
membrane. Furthermore, citric acid secretion in yeasts has been reported to
occur only as a result of passive diffusion of the undissociated acid through
plasma membrane (Marchal et al. 1980; Netik
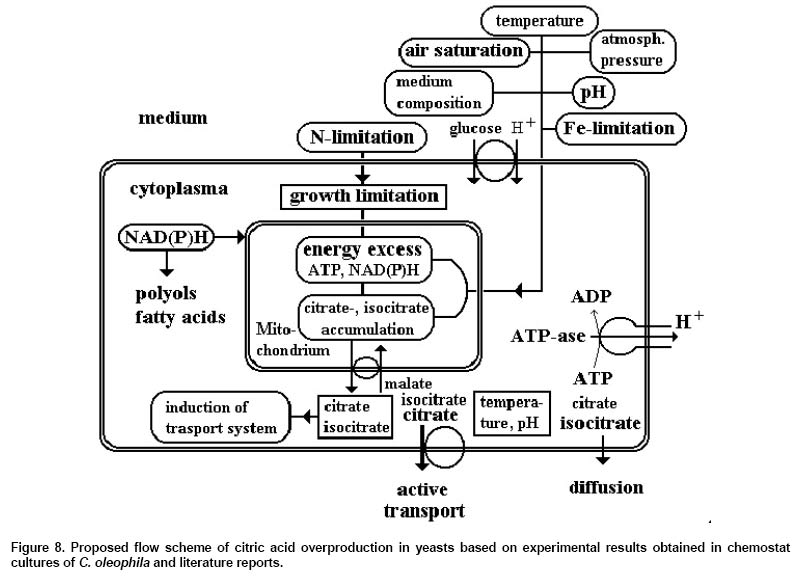
et al. 1997). However, present results showed clearly that citrate secretion
by the specific pH dependent active transport systemand not intracellular citrate
accumulation alone is the crucial speed determining factor for overproduction
in yeasts (Figure 8). The highest extra-/intracellular
ratio of 6.8 for citrate and of 0.24 for isocitrate that have been determined
at optimum pH 5 revealed the high specificity of transport system for citrate
over isocitrate. The difference between extra- and intracellular isocitrate
concentration is lower than 1, indicating that it doesn’t seem to be an affine
substrate for the active transport system and a diffusive excretion of isocitrate
into medium may also take place, forced by gradient imbalances. Netik
et al. (1997) reported about an active secretion of citric acid in A. niger,
explained by small gradient differences of slightly above 2 (42% in cells of A. niger)
found between extra- and intracellular concentrations of citric acid. A very
high difference between extra- and intracellular citric acid concentration
of about 60 has been calculated at citric acid concentration of 250 g/l that
has been achieved using C. oleophila and Y. lipolytica.
Intracellular accumulation and secretion of citrates are obviously
two totally different phenomena, influencing each other, every time in a different
way based on varying environmental conditions. Highest extracellular citrate
concentrations were identified under optimised conditions (e.g. optimum
air saturation, optimum temperature, optimum pH, optimum concentrations of
important trace elements), where under also the lowest intracellular concentrations
of citrates were identified (Anastassiadis et al. 1993; Anastassiadis,
1994). Thus, the active transport system seems to be induced by other factors,
either than by the intracellular accumulation of citric acid. However, a certain
critical intracellular level of citrate (~20 mM), determined at optimum air
saturation of 20%, was found to be necessary for functioning of active transport
system (Anastassiadis et al. 1993; Anastassiadis,
1994; Anastassiadis et al. 1994; Anastassiadis
et al. 2001). Higher intracellular concentrations of citrates were also
found in chemostat cultures of C. oleophila under non producing conditions
at lower residence times, compared with higher producing residence times, confirming
once again that citrate secretion by the specific energy consuming active transport
system is the main speed determining event in citric acid overproduction (Anastassiadis
et al. 1993; Anastassiadis, 1994), rather than intracellular
citrate accumulation alone, as has been broadly thought before in international
scientific community. Such transport systems are generally carrier proteins
(Krämer and Sprenger, 1993).
Isocitric acid is taken out from aconitase equilibrium towards
citric acid, followed up by citrate’s secretion, resulting under optimum fermentation
conditions to lowest intracellular concentrations of citric and isocitric acid.
The lower biomass iron content found at pH 3 would mean a lower aconitase activity.
However, lower aconitase activity caused by iron deficiency wouldn’t explain
the 3-fold intracellular isocitrate concentration compared with citrate at
pH 3. In order
to understand citric acid production as an event of ‘‘over flow metabolism’’,
it is essential to consider citric acid overproduction as a whole complex biological
system, starting at the initial growth and ending with the active product secretion.
Passive diffusion of citric acids at lower pH-values seems hardly to be possible
(citrate pK1 = 3.13, pK2 = 4.76 and pK3 =
6.40; isocitrate pK1 = 3.29, pK2 = 4.71 and pK3 =
6.40). Because the pKs values of citrate and isocitrate are almost
identical, only the involvement of a transport system for citrate could explain
the specificity of citrate over isocitrate. Cassio and Leao (1991) identified
a low- (facilitated diffusion) and a high-affinity transport system (presumably
a proton-citrate symport) for citrate uptake in yeast Candida utilis.
Isocitrate competitively inhibited citrate uptake by the high-affinity system,
suggesting that both of tricarboxylic acids used the same system (Cassio
and Leao, 1991). An inducible uptake system for lactate with a pH optimum
around 5 has been identified in Candida utilis by Leao
and Van Uden (1986) as well.
The mechanism of citrate accumulation in yeasts has been studied
for several years (Marchal et al. 1980; Gutierrez
and Maddox, 1993; Anastassiadis, 1994; Netik
et al. 1997; Anastassiadis et al. 2002). While transport
of mitochondrial citrate and isocitrate into cytoplasm is well known, a little
was known about excretion of citrate into culture medium. Vacuolisation of
cytoplasm has also been discussed in connection with citrate production in C.
lipolytica (Kozlova et al. 1981; Behrens
et al. 1987). However, in case that citrate excretion would be mediated
by vacuoles, specificity between excretion of citrate and isocitrate would
be attributed to aconitase equilibrium. An argument against this hypothesis
is the lower intracellular iron concentration that indicates lower aconitase
activity and in the mean time the higher intracellular isocitrate concentration
found in present work at pH 3.
Marchal et al. (1980) and McKay et al. (cited
in: Gutierrez and Maddox, 1993) proposed a passive diffusion
of citrate and isocitrate over yeast plasma membrane into fermentation medium,
in a ratio reflecting their intracellular equilibrium, and the existence of
a selective transport of mitochondrial isocitrate to cytoplasm, based on intra-
and extracellular concentrations of citrate found in experiments using C.
lipolytica and paraffins as sole C-source. The higher intracellular isocitrate
concentrations indicate a high aconitase activity and in accordance to Marchal
et al. (1980) a selective accumulation of isocitrate in cytoplasm. Citric
acid production by yeasts seems to be a paradox, because cell accumulation
of citric acid occurs under high ratio between ATP and ADP (Anastassiadis,
1994), although the process is considered to be non-growth related, triggered
out by nitrogen limitation. The strong correlation found between ATP/ADP ratio
and citric acid accumulation varying the pH can be considered as a consequence
of a high glycolytic flow under nitrogen limitation and intracellular NH4+ accumulation.
A relatively high intracellular NH4+ concentration of
about 1.2 mg/g biomass (~37.4 mM) was found in C. oleophila during the
production phase (Anastassiadis, 1994; Anastassiadis
et al. 2002). The pH dependent specific active transport is providing the
explanation for citrate overproduction in yeasts. Active transport seems to
be a way for regenerating reduction equivalents and converting excessive ATP,
gained by intensive glycolysis under growth limiting conditions.
Yeasts are divided in two categories, namely the lipogenous
and non-lipogenous citric acid accumulating strains, which can also include
strains of the same genera. Under nitrogen limitation, yeasts belonging to
the first category predominantly form fatty acids from intracellular citric
acid by ATP:citrate lyase (located in cytosol), whereas yeasts belonging to
the latter category produce citric acid (Evans and Ratledge,
1985). Thus, fatty acid synthesis and citric acid secretion by active transport
system can be considered as a means to cut down energy overload and surplus
amount of NAD(P)H2. It seems also useful to consider polyol formation
under the aspect of regulation, because polyol formation is discussed in relation
to regeneration of reduced pyridine nucleotides in yeasts (Lozinov
and Finogenova, 1982) as well as in Aspergillus niger (Röhr
et al. 1987; Honecker et al. 1989; Wallrath
et al. 1991).
The overproduction of precursors for di- and polysaccharide
formation (e.g. trehalose, glycogen and pullulan) under various nutrient
limitations by certain yeasts and moulds may be regulated by feedback control
of an elevated cytosolic pool of citrate (Evans and Ratledge,
1985; Anastassiadis, 1994). The existence of active transport
system for citrate secretion and the strong correlation between ATP/ADP ratio
and citrate overproduction, found in C. oleophila, goes well together
with reports of Lozinov and Finogenova (1982) about a non
phosphorylating alternative oxidase, identified in yeasts, that completes electron
flow without ATP regeneration, competing citrate production. Active citric
acid producing strains showed lower alternative oxidase activity instead. Whether
the energy charge is the driving force of citrate excretion in A. niger is
still unclear. In contrast to yeasts an active non-phosphorylating alternative
oxidase is discussed in relation to overproduction of citric acid in A. niger (Wallrath
et al. 1991). In this case, reduction equivalents are regenerated by the
alternative oxidase, rather than by ATP formation. Meyrath (1967) has
discussed on the other side the energy demand for growth and citrate excretion
in relation to citrate overproduction with not growing cells of A. niger.
A significant amount of energy is required since the acid is excreted against
a concentration gradient. Kristiansen and Sinclair (1979) proposed
an other option explaining citrate production in A. niger under
consideration of cytoplasm streaming.
Concluding Remarks
Citric acid production is obviously a very complicated process,
whereby numerous events such as growth limitations, enzyme activities, energy
gain and energy state, intracellular acid accumulation, as well as uptake and
transport systems display different optima and regulation mechanisms, which
are however somehow interconnected and interrelated in a synergistic mode.
Essentially higher intracellular isocitrate concentrations found in producing
cells of C. oleophila in comparison to citrate indicate a high aconitase
activity. However, isocitrate doesn’t seem to be a high-affine substrate for
active transport system. Thus, the specific active transport of citrate is
resulting to decreasing intracellular whole acid and cytoplasmatic isocitrate
concentration under optimum fermentation conditions. This phenomenon is a further
evidence for the existence of a specific active transport system for citrate
secretion in yeasts, well explaining the overproduction of citric acid against
a very strong concentration gradient. Figure 8 resumes
most crucial evens influencing citric acid overproduction in yeasts.
Acknowledgments
We thank Professor Dr. U. Stottmeister (UFZ Ctr. Envtl. Res. Leipzig-Halle, Germany),
Prof. Dr. R. Krämer (Research Centre Jülich RCJ, Germany)
and Prof. Dr. Christian Wandrey (Research Centre Jülich RCJ, Germany)
for their helpful advices and support.
References
-
AGRAWAL, P.K.; BHATT, C.S. and VISWANATHAN, L. Studies on
some enzymes relevant to citric acid accumulation by Aspergillus niger. Enzyme
and Microbial Technology, 1983, vol. 5, no. 5, p. 369-372.
-
ANASTASSIADIS, Savas, WANDREY, Christian
and REHM, Hans-Jürgen.
Continuous citric acid fermentation by Candida oleophila under nitrogen
limitation at constant C/N ratio. World Journal of Microbiology and Biotechnology (in
press), 2005.
-
ANASTASSIADIS, Savas; AIVASIDIS, Alexander and WANDREY,
Christian. Citric acid production by Candida strains under intracellular
nitrogen limitation. Applied Microbiology Biotechnology, 2002, vol.
60, no. 1-2, p. 81-87.
-
ANASTASSIADIS, Savas; AIVASIDIS, Alexander and WANDREY,
Christian. Process for the continuous production of citric acid by fermentation. US
Patent No. 08/208,123, August 3 1994, 2001.
-
ANASTASSIADIS, Savas. Zymotiki methodos gia tin sinechi
paragogi tou kitrikou oxeos; Process for the continuous production of citric
acid by fermentation. Greek Patent No. 940100098, February 24
1994, 1994.
-
ANASTASSIADIS, Savas. Determination of organic acids, especially
citric acid and isocitric acid, in fermentation solutions and fruit juices.
In: HPLC Applications, MACHEREY-NAGEL GmbH & Co. KG, Düren, Germany.
1993, Application no. 8, p. 4.
-
ANASTASSIADIS, Savas; AIVASIDIS, Alexander and WANDREY,
Christian. Fermentationsverfahren zur kontinuierlichen Citronensäuregewinnung(Process
for the continuous production of citric acid by fermentation), German
Patent No. P 43 17 488.4-09, March 181993, 1993.
-
ANASTASSIADIS, Savas; AIVASIDIS, Alexander and WANDREY,
Christian. Fermentationsverfahren zur kontinuierlichen Citronensäuregewinnung.
( Process for the continuous production of citric acid by fermentation). Austrian
Patent No. 473/94, July 3 1994, 1994.
-
ANTONUCCI, S.; BRAVI, M.; BUBBICO R.; Di MICHELE, A. and
VERDONE, N. Selectivity in citric acid production by Yarrowia lipolytica. Enzyme
and Microbial Technology, 2001, vol. 28, no. 2-3, p. 189-195.
-
BEHRENS, U.; THIERSCH, A.; WEISSBRODT, E. and STOTTMEISTER,
U. Particularities in the kinetics of growth and citric acid accumulation
by Saccharomycopsis lipolytica. Acta Biotechnologica, 1987,
vol. 7, no. 2, p. 179-183.
-
BRIFFAUD, J. and ENGASSER, M. Citric acid production from
glucose. I. Growth and excretion kinetics in a stirred fermentor. Biotechnology
and Bioengineering, 1979, vol. 21, no. 11, p. 2082-2092.
-
CASSIO, F. and LEAO, C. Low- and high-affinity transport
system for citric acid in the yeast Candida utilis. Applied
and Environmental Microbiology, 1991, vol. 57, no. 12, p. 3623-3628.
-
CROLLA, A. and KENNEDY, K.J. Fed-batch production of citric
acid by Candida lipolytica grown on n-paraffins. Journal
of Biotechnology, 2004, vol. 110, no. 1, p. 73-84.
-
CROLLA, A. and KENNEDY, K.J. Optimization of citric acid
production from Candida lipolytica Y-1095 using n-paraffin. Journal
of Biotechnology, 2001, vol. 89, no. 1, p. 27-40.
-
CRUEGER, W. and CRUEGER, A. Organische
Säuren . In: Biotechnologie,
Lehrbuch der angewandten Mikrobiologie, Oldenbourg Verlag GmbH, München,
Wien, 1989, chapter 8, p. 127-141. ISBN 3-486-28403-7.
-
DAWSON, M.W. and MADDOX, I.S. Evidence
for nitrogen catabolite repression during citric acid production by Aspergillus niger under
phosphate-limited growth. Biotechnology and Bioengineering, 1989,
vol. 33, no. 11, p. 1500-1504.
-
GREWAL, H.S and KALRA K.L. Fungal production of citric
acid. Biotechnology Advances, 1995, vol. 13, no. 2, p. 209-234.
-
GUTIERREZ, N.A. and MADDOX, I.S. Evidence that impaired
citrate transport into the cell is a contributory factor to extracellular
citrate accumulation by a strain of Candida quilliermondii. Applied
Microbiology and Biotechnology, 1993, vol. 39, no. 4-5, p. 604-608.
-
ENZMINGER, J.D. and ASENJO, J.A. Use of cell recycle in
the aerobic fermentative production of citric acid by yeast. Biotechnology
Letters, 1986, vol. 8, no. 1, p. 7-12.
-
EVANS, C.T. and RATLEDGE, C. The physiological significance
of citric acid in the control of metabolism in lipid-accumulating yeasts. Biotechnology
and Genetic Engineering Reviews (Hants), 1985, vol. 3, p. 349-375.
-
FRANZ, A.; BURGSTALLER, W. and SCHINNER F. Leaching with Penicillium simplissimum:
Influence of metals and buffers on proton extrusion and citric acid production. Applied
and Environmental Microbiology, 1991, vol. 57, no. 3, p. 769-774.
-
HABISON, A.; KUBICEK, C.P. and RÖHR,
M. Partial purification and regulatory properties of phosphofructokinase
from Aspergillus niger. Biochemical
Journal, 1983, vol. 209, no. 3, p. 669-676.
-
HABISON, A.; KUBICEK, C.P. and RÖHR,
M. Phosphofructokinase as a regulatory enzyme in citric acid producing Aspergillus niger. FEMS
Microbiology Letters, 1979, vol. 5, no. 1, p. 39-42.
-
HAQ, I.-U.; ALI, S.; QADEER, M.A. and IQBAL, J. Effect
of copper ions on mould morphology and citric acid productivity by Aspergillus
niger using molasses based media. Process Biochemistry, 2002,
vol. 37, no. 10. p. 1085-1090.
-
HÖFER, M.; NICOLAY, K. and ROBILLARD,
G. The electrochemical H +-Gradient in the yeast Rhodotorula glutinis. Journal
of Bioenenergetics and Biomembranes, 1985, vol. 17, no. 3, p. 175-182.
-
HONECKER, S.; BISPING, B.; YANG, Z. and REHM, H.-J. Influence
of sucrose concentration and phosphate limitation on citric acid production
by immobilized cells of Aspergillus niger. Applied
Microbiology and Biotechnology, 1989, vol. 31, p.17-24.
-
IKENO, Y.; MASUDA, M.; TANNO, K.; OOMORI, I. and
TAKAHASHI, N. Citric acid production from various raw materials by yeasts. Journal
of Fermentation Technology, 1975, vol. 53, no. 10, p. 752-756.
-
KAMZOLOVA, S.V.; SHISHKANOVA, N.V.; MORGUNOV, I.G.
and FINOGENOVA, T.V. Oxygen requirements for growth and citric acid production
of Yarrowia lipolytica. FEMS Yeast Research, 2003, vol.
3, no. 2, p. 217-222.
-
KAPOOR, K.K.; CHAUDHARY, K. and TAURO, P. Citric acid.
In: REED, Gerald ed. Prescott and
Dunn's Industrial Microbiology. 4 th ed., 1982, p. 709-742.
-
KISSER, M.; KUBICEK, C.P. and RÖHR,
M. Influence of manganese on morphology and cell wall composition of Aspergillus niger during
citric acid fermentation. Archives of Microbiology, 1980, vol. 128,
no. 1, p. 26-33.
-
KLASSON, T.K.; CLAUSEN, E.C. and GADDY, J.C. Continuous
fermentation for the production of citric acid from glucose. Applied Biochemistry
and Biotechnology, 1989, vol. 20/21, p. 491-505.
-
KNOWLES, C.J. Microbial metabolic regulation by adenine
nucleotide pools. In: HADDOCK, B.A. and HAMILTON, W.A. eds. Microbial
Energetics. Cambridge University Press, Cambridge, 1977, p. 241-283.
-
KOZLOVA, T.M.; MEDVEDEVA, G.A.; GLAZUNOVA, L.M. and FINOGENOVA,
T.V. Structural changes in the cells of Candida lipolylica in the
biosynthesis of citric acid. Mikrobiologiya, 1981, vol. 50, no. 3,
p. 508-514.
-
KRÄMER, R. and SPRENGER, G. Metabolism.
In: SAHM, H. ed. BiotechnologyVol
I; 2 nd REHM, H-J.; REED, G.; PÜHLER, A. and STADLER, P. eds.
Weinheim, New York, Basel, Cambridge, Tokyo, 1993, pp. 641, ISBN 3-527-28311-0.
-
KRISTIANSEN, B.; CHARLEY, R.C.; SEVIOUR, B.; HARVEY, L.;
HABEEB, S. and SMITH, J.E. Overproduction of metabolites by filamentous fungi.
In: KRUMPHANZL, V.; SIKYTA, B. and VANEK, Z. eds. Overproduction of microbial
products. Academic press, London, New
York, Paris, San Diego, San Francisco, Sao
Paulo, Sydney, Tokyo, Toronto,
1982, p. 195-210.
-
KRISTIANSEN, B. and CHARLEY, R.C. Continuous process for
production of citric acid. Advances in Biotechnology, 1981, vol. 1,
p. 221-227.
-
KRISTIANSEN, B. and SINCLAIR, C.G. Production of citric
acid in continuous culture. Biotechnology and Bioengineering, 1979,
vol. 21, no. 2, p. 297-315.
-
KUBICEK, C.P. and RÖHR, M. Citric acid fermentation. Critical
Reviews in Biotechnology, 1986, vol. 3, no. 4, p. 331-373.
-
KUBICEK, C.P.; RÖHR, M. and ΜA, Η.
Influence of manganese deficiency on nucleic acid and protein synthesis
in Aspergillus niger during
citric acid accumulation. Third European Congress on Biotechnology vol. 2,
Verlag Chemie, Munich, 1984,
p. 23-28.
-
KUBICEK, C.P. and RÖHR, M.
Regulation of citrate synthase from the citric acid accumulating fungus, Aspergillus niger. Biochimica
et Biophysica ACTA/General Subjects (Amsterdam),
1980, vol. 615, no. 2, p. 449-457.
-
KUBICEK, C.P.; ZEHENNTGRUBER, O.; El-KALAK,
H. and RÖHR,
M. Regulation of citric acid production by oxygen: Effect of dissolved
oxygen tension on adenylate levels and respiration. European Journal of Applied
Microbiology and Biotechnology, 1980, vol. 9, p. 101-117.
-
KUBICEK, C.P. and RÖHR, M.The role
of tricarboxylic acid cycle in citric acid accumulation by Aspergillus niger. European
Journal of Applied Microbiology and Biotechnology, 1978, vol. 5, no.
3, p. 263-271.
-
LEAO, C. and Van UDEN, N. Transport of lactate and other
short-chain monocarboxylates in the yeast Candida utilis. Applied
Microbiology and Biotechnology, 1986, vol. 23, no. 5, p. 389-393.
-
LOZINOV, A.B. and FINOGENOVA, T.V.
Einfluß der Limitation
des Wachstums von Hefen auf den oxidativen Stoffwechsel und die Produktsynthese. Acta
Biotechnologica, 1982, vol. 2, no. 4, p. 317-324.
-
LOZINOV, A.B.; FINOGENOVA T.V. and GLAZUNOVA L.M. Limitation
of the growth of Candida lipolytica and some metabolites oversynthesis. Mikrobiologia,
1974, vol. 43, no. 5, p. 786-789.
-
LUNDIN, A.; RICKARDSON, A. and THORE, A. Continuous monitoring
of ATP-converting reactions by purified firelly luciferase. Analytical
Biochemistry, 1976, vol. 75, no. 2, p. 611-620.
-
MANSFELD, Johanna; FÖRSTER, Michael;
HOFFMANN Torsten; SCHELLENBERGER Alfred and DAUTZENBERG, Horst. Coimmobilization
of Yarrowia
lipolytica cells and invertase in polyelectrolyte complex microcapsules. Enzyme
and Microbial Technology, 1995, vol. 17, no. 1, p. 11-17.
-
MARCHAL, R.; METCHE, M. and VANDECASTEELE, J.P. Intracellular
concentrations of citric and isocitric acids in cultures of the citric acid-excreting
yeast Saccharomycopsis lipolytica grown on alkanes. Journal of
General Microbiology, 1980, vol. 116, no. 2, p. 535-538.
-
MEIXNER-MONORI, B.; KUBICEK, C.P.;
HABISON, A.; KUBICEK-PRANZ, E.M. and RÖHR, M. Presence and regulation of the α-Ketoglutarate-Dehydrogenase
multienzyme complex in the filamentous fungus Aspergillus niger. Journal
of Bacteriology, 1985, vol. 161, no. 1, p. 265-271.
-
MEIXNER-MONORI, B.; KUBICEK,
C.P. and RÖHR, M.
Pyruvat-Kinase from Aspergillus niger. A
regulatory enzyme in glycolysis? Canadian Journal of Microbiology,
1984, vol. 30, no. 1, p. 16-22.
-
MEYRATH, J. Citric acid production. Process Biochemistry,
1967, vol. 2, no. 56, p. 25-27.
-
MILSON, P.E. Organic acid fermentation, especially citric
acid. Food Biotechnology, 1987, vol. 1, p. 273-307.
-
MILSON, P.E. and MEERS, J.L. Citric acid. The practice
of biotechnology: Current commodity products. In: BLANCH, H.W.; DREW, S.
and WANG, D.I.C. eds. Comprehensive Biotechnology vol. 3, Pergamon
Press, Oxford, New York, Toronto, Sydney, Frankfurt, 1985, p. 665-680.
-
MORESI, M. Effect of glucose concentration on citric acid
production by Yarrowia lipolytica. Journal of Chemical Technology
and Biotechnology, 1994, vol. 60, no. 4, p. 387-395.
-
NETIK, A.; TORRES, N.V.; RIOL, J.-M. and KUBICEK, C.P.
Uptake and export of citric acid by Aspergillus niger is
reciprocally regulated by manganese ions. Biochimica et Biophysica Acta
(BBA) – Biomembranes, 1997, vol. 132, no. 2, p. 287-294.
-
NOGUCHI, Y. and JOHNSON, M.J. Citric acid fermentation
with sugarpurified chelating resin. Journal of Bacteriology, 1961,
vol. 82, p. 538-541.
-
NUBEL, R.C.; FITTS, R.A. and FINDLAY,
C.B. Verfahren zur Herstellung von Citronensäure. German Patent 2.050.361, Auslegeschrift
2 050 361, 1971, Phizer Inc., New York.
-
OEXLE, H.; GNAIGER, E. and WEISS, G. Iron-dependent changes
in cellular energy metabolism: influence on citric acid cycle and oxidative
phosphorylation. Biochimica et Biophysica Acta, 1999, vol. 1413, no.
3, p. 99-107.
-
PAPAGIANNI, M.; MATTEY, M. and KRISTIANSEN, B. Hyphal vacuolation
and fragmentation in batch and fed-batch cultures of Aspergillus niger and
its relation to citric acid production. Process Biochemistry, 1999,
vol. 35, no. 3-4, p. 359-366.
-
PAPANIKOLAOU, S. and AGGELIS, G. Lipid production by Yarrowia
lipolytica growing on industrial glycerol in a single-stage continuous
culture. Bioresource Technology, 2002, vol. 82, no. 1, p. 43-49.
-
PAUL, G.C.; PRIEDE, M.A. and THOMAS, C.R. Relationship
between morphology and citric acid production in submerged Aspergillus niger fermentations. Biochemical
Engineering Journal, 1999, vol. 3, no. 2, p.121-129.
-
PEKSEL, A.; TORRES, N.V.; LIU, J.; JUNEAU,
G. and KUBICEK, C.P. 13C-NMR analysis of glucose metabolism during
citric acid production by Aspergillus niger. Applied
Microbiology and Biotechnology, 2002, vol. 58, no. 2, p. 157-163.
-
PERA, L.M. and CALLIERI, D.A. Influence of calcium on fungal
growth and citric acid production during fermentation of a sugarcane molasses-based
medium by a strain of Aspergillus niger. World
Journal of Microbiology and Biotechnology, 1999, vol. 15, no. 5, p. 647-649.
-
RANE, Kishore D. and SIMS, KEVIN A. Production of citric
acid by Candida lipolytica Y1095: Effect of glucose concentration
on yield and productivity. Enyzme and Microbial Technology, 1993,
vol. 15, no. 8, p. 646-651.
-
REHM, H.-J. Industrielle Mikrobiologie, 2. Aufl., Springer
Verlag, Berlin, Heidelberg, New York, 1980.
-
RÖHR, M.; KUBICEK, C.P.; ZEHENNTGRUBER,
O. and ORTHOFER, R. Accumulation and partial reconsumption of polyols during
citric acid fermentation
by Aspergillus niger. Applied
Microbiology and Biotechnology, 1987, vol. 27, p. 235-239.
-
RÖHR, M.; KUBICEK C.P. and KOMINEK,
J. Citric acid. In: REHM H-J.; REED, G. and DELWEG, G. eds. Biotechnology vol. 3, Verlag
Chemie, Weinheim, Deerfield Beach/Florida, Basel,
1983, p. 419-454.
-
RÖHR, M. and KUBICEK, C.P. Regulatory
aspects of citric acid fermentation by Aspergillus niger. Process
Biochemistry, 1981, vol. 6-7, p. 34-37.
-
ROOS, W. and SLAVIK, J. Intracellular pH topography of Penicillium
cyclopium protoplasts. Maintenance of ΔpH by both passive
and active mechanisms. Biochimica et Biophysica ACTA/General Subjects,
1987, vol. 899, no. 1, p. 67-75.
-
ROUKAS, T. and HARVEY, L. The effect of pH on production
of citric and gluconic acid from beet molasses using continuous culture. Biotechnology
Letters, 1988, vol. 10, no. 4, p. 289-294.
-
SCHIMZ, K.L.; RÜTTEN, B. and TRETTER,
M. Determination of adenosine nucleotides with luciferin/luciferase from
crude firelly lantern
extract on a bioluminescence analyser. Advances in Biotechnology,
1981, vol. 1, p. 457-462.
-
SCHINNER, W. and BURGSTALLER, W. Extraction of zinc from
industrial waste by a Penicillium sp. Applied and Environmental
Microbiology, 1989, vol 55, no 5, p. 1153-1156.
-
SHAVLOSKII, G.M.; FEDOROVICH, D.V. and NAZARUK, M.I. Some
properties of the iron transport system and regulation of its synthesis in Pichia
quilliermondii. Mikrobiologiya, 1988, vol. 57, no. 1, p. 15-20.
-
SHU, P. and JOHNSON, M.J. Citric acid production by submerged
fermentation with Aspergillus niger. Industrial
and Engineering Chemistry, 1948a, vol. 40, p. 1202-1204.
-
SHU, P. and JOHNSON, M.J. The interdependence of medium
constituents in citric acid production by submerged fermentation. Journal
of Bacteriology, 1948b, vol. 56, p. 577-585.
-
STOTTMEISTER, U. and HOPPE, K. Organische
Genußsäuren.
In: RUTTLOFF, H. ed. Lebensmittelbiotechnologie, Entwicklungen
und Aspekte, 1. Aufl., Akademie Verlag, 1991, p. 516-547.
-
TISNADJAJA, Djadjat; GUTIERREZ, Noemi, A. and MADDOX, Ian
S. Citric acid production in a bubble-column reactor using cells of the yeast Candida
guilliermondii immobilized by adsorption onto sawdust. Enzyme and
Microbial Technology, 1996, vol. 19, no. 5, p. 343-347.
-
VENTER, T.; KOCK, J.L.F.; BOTES, P.J.; SMIT, M.S.;
HUGO, A. and JOSEPH, M. Acetate enhances citric acid production by Yarrowia
lipolytica when grown on sunflower oil. Systematic and Applied Microbiology,
2004, vol. 27, no. 2, p. 135-138.
-
WALLRATH, J.; SCHMIDT, M. and WEISS, H. Concomitant loss
of respiratory chain NADH:Ubiquinone reductase (complex I) and citric acid
accumulation in Aspergillus niger. Applied
Microbiology and Biotechnology, 1991, vol. 36, no. 1, p. 76-81.
-
WIECZOREK, S. and BRAUER H. Continuous production
of citric acid with recirculation of the fermentation broth after product
recovery, Part 2: Product recovery and recirculation of the fermentation
broth. Bioprocess Engineering, 1998, vol. 18, no. 2, p. 75-77.
-
ZEHENTGRUBER, O.; KUBICEK, C.P. and
RÖHR, M. Alternative
respiration of Aspergillus niger. FEMS
Microbiology Letters, 1980, vol. 8, no. 2, p. 71-74.
Declaration
The experiments of the present manuscript comply with the currant laws of
the country Germany (Institute of
Biotechnology 2 of Research Centre Jülich 2, RCJ; formerly known as Nuclear
Research Centre Jülich, KFA) and Greece (Research
in Biotechnology Co., Avgi/Sohos, 57002 Thessaloniki),
where the experiments were performed.
Note: Electronic Journal of Biotechnology is not responsible
if on-line references cited on manuscripts are not available any more after
the date of publication.
Supported by UNESCO / MIRCEN network
© 2005 by Pontificia Universidad Católica de Valparaíso -- Chile
The following images related to this document are available:
Photo images
[ej05017f5.jpg]
[ej05017f8.jpg]
[ej05017f7.jpg]
[ej05017f2.jpg]
[ej05017f6.jpg]
[ej05017f4.jpg]
[ej05017f1.jpg]
[ej05017f3.jpg]
|
