 |
| About Bioline | All Journals | Testimonials | Membership | News |
|
||||||
|
||||||
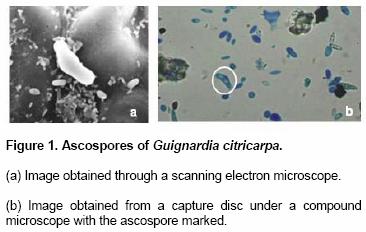
Comparison of shape analysis methods for Guinardia citricarpa ascospore characterization Mário Augusto Pazoti1, Rogério Eduardo Garcia2,
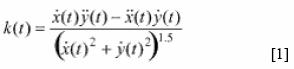
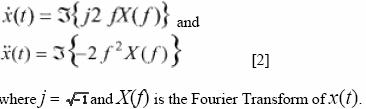
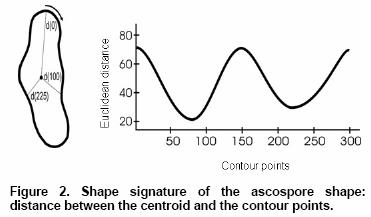
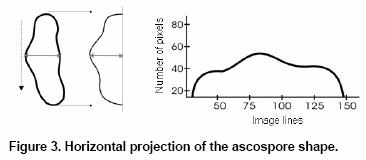
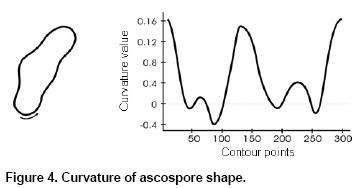
José Dalton Cruz Pessoa3, Odemir Martinez Bruno*4 Code Number: ej05030 Among the diseases affecting the commercial citrus production, the citrus black spot (CBS) is considered to cause substantial losses. The analyses of particles in suspension in the orchards and collected into a disc have been applied as a preventive action trying to identify the presence of fungus spores before symptom appearance. In this paper, we show the results of several shape analysis methods applied to the fungus, the first step to the aimed computer aided vision system, capable to assist the identification process. Experiments and comparative results among the methods are presented in this paper, showing that better results were obtained applying the curvature method. Keywords: computer vision, curvature, pattern recognition, shape analysis, shape signature and projection. The productivity of citrus can be affected by several factors, such as pest and disease management, not irrigated orchards, narrow genetic base and lack of technological support. The chemical control is quite difficult to be made due to the systemic characteristics of several diseases, their etiology and their easy dispersion. Some diseases, such as citrus variegated chlorosis (CVC), citrus canker, citrus leprosis, citrus tristeza, black spot (CBS), and also pests like the leprosis acari, are the most common biotic factors limiting the citrus culture. This paper focuses on the black spot disease, a fungal disease caused by Guignardia citricarpa Kiely (anamorph Phyllosticta citricarpa), which is characterized for presenting sunken lesions in the rind of fruits causing precocious maturation, accented fall and depreciation for in natura fruit market (Bonants et al. 2003). One of the main features of CBS is the delay for the symptom appearance, making the fungal presence identification necessary as soon as possible. The disease has been found in subtropical regions of the world that are subject to summer rainfall such as Argentina, eastern Australia, Brazil, China, Hong Kong, Indonesia, Japan, Kenya, Mozambique, Nigeria, Peru, Philippines, northeastern South Africa, Swaziland, Taiwan, Uruguay, Venezuela, and Zimbabwe (Baayen et al. 2002). A study developed by the Secretary of Agriculture and Supply of São Paulo State, Brazil, between 1995 and 1997, about the disease incidence and distribution shows that the area with citrus cultures was The method most frequently used for spore identification is by means of collecting at orchards suspended particles blown on discs, and analyze them under the microscope. This task takes a long time and human errors may affect the results. There are other scientific works dealing with the problem of identification shapes by imaging analysis (Vanhoutte et al. 1995; Wilkinson, 2000; Araya-Kroff, 2004; Takemura, 2004), however, this work is a first initiative to identify the fungal spore. The identification process based on shape analysis face some difficult such as the shape, colour (by special dye) and texture similarity among other species. The use of a computer aided vision system to assist the spores identification is one of the strategies to speed up this process. The first step to obtain an efficient computer aided vision system is to evaluate shape analysis methods. Considering that a specific hardware will be developed and put to work in loco (in orchard), the techniques for identifying ascospores must be implemented on it. So, some shape analysis methods have been studied and applied to this problem and a comparative study among them using spectrum analysis has been conducted. To show the results obtained, this paper is organized as follows: in Section 2 the black spot disease pathology is briefly presented, as well as a description of the Guignardia citricarpa; in Section 3 some methods based on signature, projections, curvature and Fourier spectrum analysis are briefly described; the performed experiments applying the mentioned methods are presented, as well as the adopted approach, in Section 4; in Section 5 the results obtained are presented and, finally, in Section 6, the conclusion of this paper is presented. Black spot disease pathology Black spot of citrus is a disease caused by Guignardia citricarpa, which affects leaves and fruits of citrus species: C. limonia, C. nobilis, C. poonensis, C. tankan, grapefruits (C. paradisi), lemons (C. limon), limes (C. aurantifolia), mandarins (C. reticulata), oranges (C. sinensis) (EPPO/CABI, 1997). Two types of spore can spread the fungus: the asexual (conidia), which develops in fruits and leaves fixed at the plant, and the sexual (ascospores), which develops in leaves in decomposition. Usually it infects fruits either on the same plant or on neighbouring plants. The ascospores are spread not only on short, but also on long distances: the wind can spread it, infecting orchards at kilometres of distance (Goes, 2002). Although conidia may cause infection of citrus, the ascospores are seen to be the primary source of infection where citrus is cultivated. The ascospores are unicellular, hyaline, aseptate, broader in the middle, cylindrical, 8-17.5 x 3.3-8 μm, ends obtuse with colourless terminal mucoid appendage (EPPO/CABI, 1997; Baldassari et al. 2001). Figure 1a shows the ascospore obtained through a scanning electron microscope and Figure 1b shows the image obtained from a capture disc using a compound microscope. The last one was used in the experimental analyses. Image analysis methods Several techniques for shape description and characterization have been developed, and to choose and apply them depend on the features desired to detect. The methods used in this paper are based on the shape signature, projection and curvature, including Fourier spectrum analysis, described bellow. Shape signature is a representation able to describe a two-dimensional shape by one or more one-dimensional signals (Gonzalez and Woods, 2002). An important advantage describing shape for a one-dimensional signal is the possibility to use signal-processing techniques in order to extract features. The Euclidean distance between the centroid (centre of mass) and the contour points has been applied to obtain the shape signature. The shape signature can be represented by a two-dimensional graph. Figure 2 shows the ascospore shape signature. Beside shape representation by contour, it is possible to represent it by projections. This method counts pixels of binary image on a line, which is oriented by an angle. A histogram is generated by the sum of pixels by moving this line along the overall image without modifying the angle (Jain, 1989). Figure 3 shows the signature obtained by the horizontal projection of the ascospore shape. Some features of this histogram are useful for the analysis process. An observed feature refers to the ascospore central dilatation, which appears in the horizontal projection. This is the main feature observed that can be used to differentiate the ascospore shape projections from other projections. From different projections, it is possible to extract the maximum and minimum locals, used, for example, to determine the convex hull and the bounding rectangle required for some segmentation techniques. Moreover, the projection can be used as a regenerative feature of the object (Jain, 1989). The signature obtained by projection can be submitted to signal processing techniques in order to extract descriptors for the shape characterization. The curvature is an important feature that can be extracted from the shape contour. Basically, this feature consists of the rate of change contour inclination, supplying information about concave and convex regions in the shape (Costa and Cesar, 2001). Some descriptors can be obtained by sampled curvature, statistics curvature, maxima, minima and inflection points and bending energy. The curvature can be estimated by equation 1, where There are different ways for estimating the signal derivatives of x(t) and y(t). One of them is based on the derivative property of the Fourier Transform (Brigham, 1988), which allows estimating the derivatives of signal, as shown in the following equations:
where j = After the derivative process, the curvature is estimated by replacing the signals derived in equation 1. Consequently, the curvature estimation is based on numerical differentiation and the influence of the noises contained in the original signal tends to increase (Cesar and Costa, 1996). That is why a Gaussian low-pass filter is applied to attenuate high-frequency noise. The curvature estimated by this process is defined in equation 3, using the convolution property of Fourier Transform (Brigham, 1988), where parameter s determines the Gaussian standard deviation. Figure 4 shows the curvature ascospore, considering the counter-clockwise contour sense.
Fourier spectrum analysis is well explored in pattern recognition problems to extract features. In this sense, Fourier descriptors are the most famous method that consists in the choice of coefficients (U(f)) obtained from the Fourier transform of a one or two-dimensional signal. Only the magnitude of the Fourier coefficients is used as a feature (Costa and Cesar, 2001). The magnitude function, shown in equation (4), is called spectrum frequency. The power spectrum function also can be considered as a feature. Also known as spectral density, it consists in the square of the magnitude spectrum, as shown in equation (5).
The chosen descriptors are generally low-frequency coefficients because they contain the global shape information. The high-frequency descriptors are ignored because they are responsible for the detail information and noises contained in the signals (Gonzalez and Woods, 2002). An important advantage of the Fourier descriptors, when applied in pattern recognition, is robustness against noises. Experiments To collect the samples a device that blows particles on a disc was strategically positioned to cover the entire orchard. Each device takes 24 hrs to complete a disc with samples. A special dye was applied on disc to colour the hyalines structures. The images of discs were acquired using a digital camera connected to a conventional microscopy with lens 40 x 5, with resolution around 640 x 512 pixels. Experiments were performed applying three different methods simultaneously with the power spectrum analysis. Before applying shape analysis techniques, the segmentation and contour extraction were applied as follows. The segmentation process was performed applying the threshold method in the acquired image, automatically determined using the iterative selection method (Parker, 1997). However, noises appeared and, to circumvent this, a morphologic filter was applied for noise removal and contour smoothing. This filter is a combination of opening and closing morphologic operations (Gonzalez and Woods, 2002). Another fact observed during this segmentation stage was the connections among objects contained in the disc. In this case, the watershed segmentation method was applied for segregation of connected particles, using the immersion approach (Vincent and Soille, 1991). Finally, contour following algorithm (Costa and Cesar, 2001) was applied in each object. The algorithm consists in tracking the object contour given an initial point, and storing respective coordinate in a linked list. The applied methods were shape signature, horizontal projection and curvature. After applying these methods on contour particles, the power spectrum was estimated and the features were selected to compound the feature vectors. For each one, the n first and the n last coefficients were considered in the feature vector composition. The number of descriptors (n) varied for each experiment due to the signal width generated by each method, and it was defined by visual analyzing of the Fourier spectrum obtained to choose the coefficients with significant information. Alternatively, the accumulated energy function (Costa and Cesar, 2001) was computed to validate the values chosen: the values were discarded as accumulated energy stabilizes (high frequencies coefficients). The selection of the descriptors was always performed on the low-frequency coefficients, located in the spectrum extremities, using the Discrete Fourier Transform result. Considering that the Fourier Transform is applied on descriptors (i.e. signatures), the use of low frequencies aims to discard variations and details avoiding difficult to compare them. In this case, the descriptors keep their features, circumventing the signal shift problem. The ascospore identification process for these experiments was based on the distance estimate among the average vector (M), defined previously, and feature vectors that represent the particles found on discs. The Euclidian norm between Ps and M vectors, as shown in equation (6), was performed for estimating the distance between two vectors.
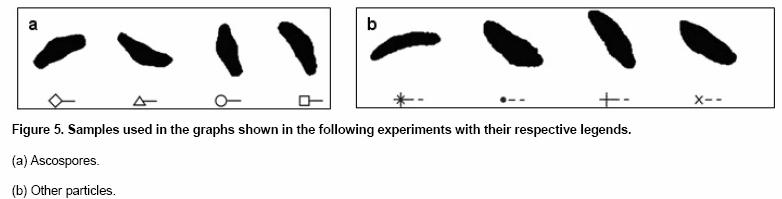
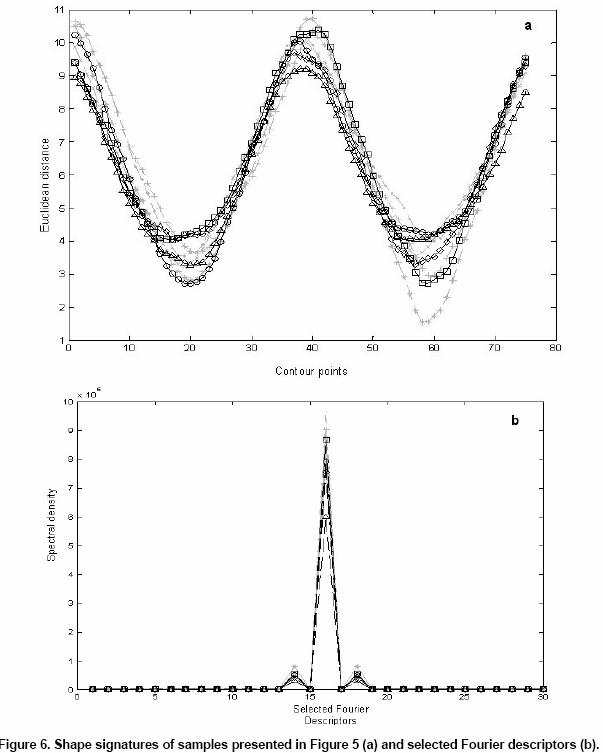
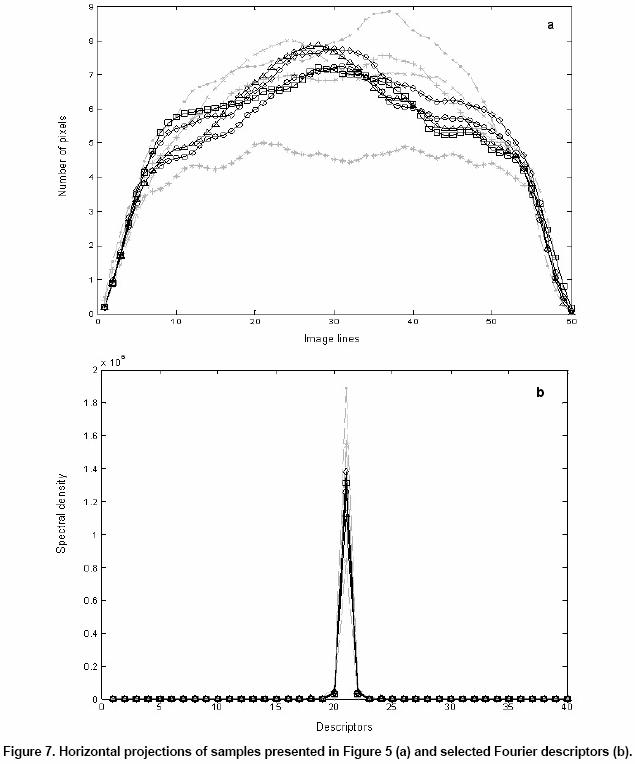
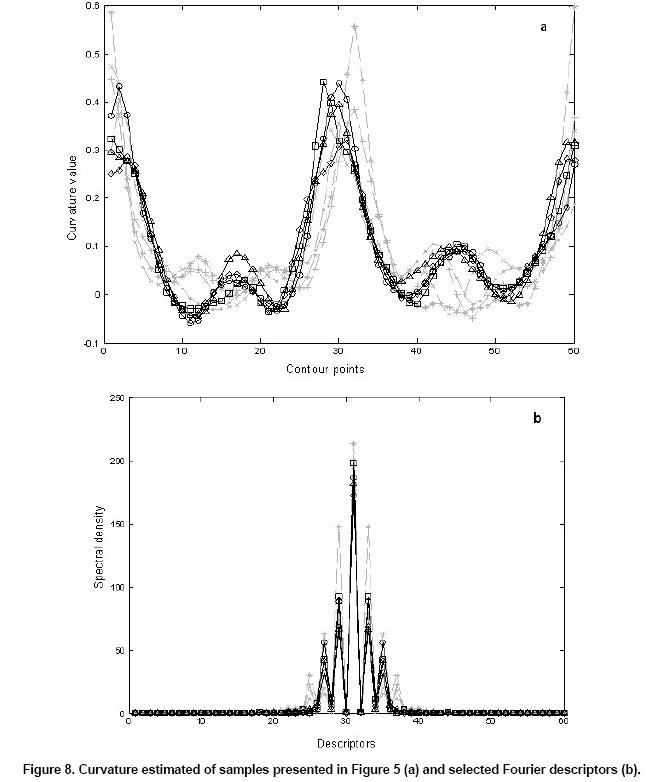
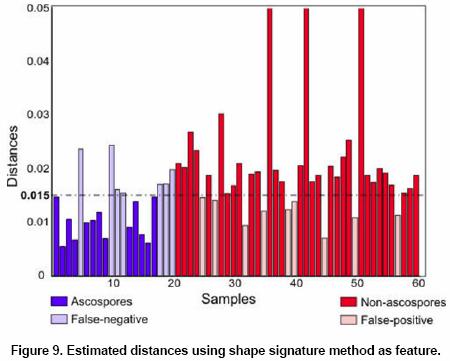
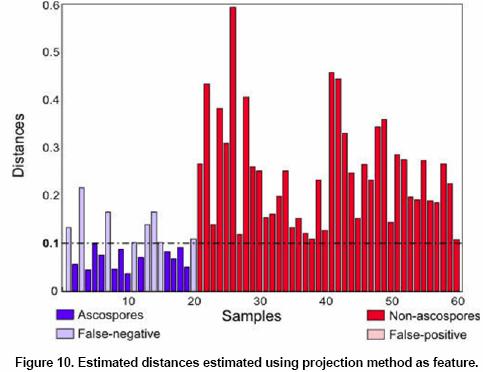
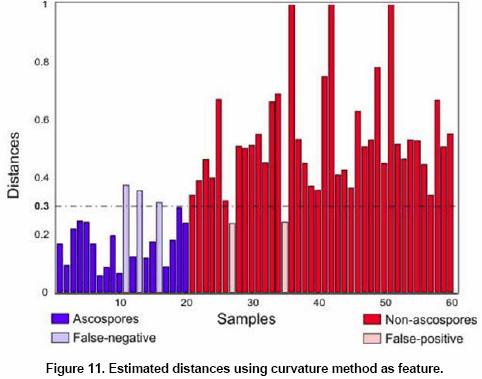
A threshold was defined for separating the particles, considering as ascospores the particles with distance less than or equal to this threshold. The threshold was defined considering the results obtained during the experiments, towards minimizing errors (non-identification and minimizing the false positive. For these experiments 60 samples were used. Figure 5 shows eight samples with their legends, which must be considered in the following graphs. The details about the performed steps in each experiment and their defined parameters are presented as follows. The shape signature was extracted for each sample and shown in Figure 6a. In this figure it is possible to observe a high similarity between the ascospore and the signals of other samples, complicating the analysis and efficiency of the identification process. Another problem occurs due to the initial point of the contour, which should be equal for samples of the same type to avoid shifting of contour signals. The solution adopted in this experiment consisted of applying the power spectrum in each extracted sample signature. The phase signal was not considered, avoiding any problem with signal shifting in the space domain. After the power spectrum had been applied, 30 descriptors were selected from each signal for compound feature vectors and the distance was calculated between the average vector and the feature vectors. Figure 6b shows the selected Fourier descriptors as a feature vector plotted in a line chart. This made a better visualization of behaviour signal possible after the power spectrum had been applied. In this graph it may be observed that there is not a good separation among the signals, and it anticipates that the signature-based approach does not ensure efficient ascospore identification. A great proximity is observed among the descriptors of the different samples. The feature extraction takes into account the 1D signal obtained with no treatment of shape variance, both rotation and translation. However, the signal obtained may suffer the shift variance, which occurs due to shape rotation. In frequency domain, the signal phase is discarded by computing the power spectrum (spectral density), resulting in normalized coefficients. In Figures 6a is shown the normalized signals obtained with samples rotated to align the main axis -one with longer distance among contour points - to the vertical position. This approach was applied to evaluate visually the similarity among original signals, and one may observe the overlap of signals indicating that the shift problem is minimized. Using the Fourier descriptors, the approach described may be avoided. In Figures 6b is shown the selected descriptors taken with no former signal treatment to shape adjustment (rotation and translation), considering only the spectral density (power spectrum). Comparing both figures it is possible to observe that shapes not too similar result in quite similar signals. The same approach adopted in the Experiment I was considered in the second one. The horizontal projection was extracted for each sample; however, samples were rotated to vertical position considering the shape diameter as the main axis. Rotation was applied to minimize the variation occasioned by different shape inclination found in acquired image. Figure 7a shows signals obtained by extracting horizontal projection from samples presented in Figure 5. The signals obtained from ascospore samples show a central peak that occurs due to the dilatation present in the centre of the ascospore. This is an important feature to differentiate the samples. Like the first experiment, the power spectrum from each signal was computed. After that, 30 descriptors were selected from each signal to compound feature vectors and the norm was calculated for each vector. Figure 7b shows the Fourier descriptors in the feature vector. In this graph it may be observed that there is a great similarity among the descriptors that means that the projection-based approach does not present a good performance to ascospore identification either. The same approach adopted previously was considered. In this experiment was extracted the curvature for each sample. Figure 8a shows the shape curvatures, considering Gaussian filter with s = As performed in former experiments, the power spectrum was applied in each signal. After that, 60 descriptors were selected for compound feature vectors, and the norm was estimated between the average vector and the feature vectors. Figure 8b shows the Fourier descriptor plotted in a line chart. In this graph it may be observed that the descriptors referring to the ascospore samples are closer than the other ones. In this case, the distance tends to be shorter for the ascospore samples, which does not occur with the other ones. A pattern in the signal presented in Figure 8b can be clearly observed, allowing a better segregation. Results and Discussion The results were obtained according to the estimated error among feature vectors and the average vector and the identification decision was given by threshold. The set used for these experiments consisted of 60 samples, where 20 were Guignardia citricarpa ascospore samples and 40 were other particles also found on the collection discs. The results and their threshold are presented as follows. In experiment I, the shape signature based method, 44 out of 60 cases were correctly identified (about 73%) considering threshold T = 0.015. There were 7 false-negative and 9 false-positive cases as shown by the bar chart - Figure For experiment II, the shape projection based method, 52 out of 60 cases were correctly identified (about 86%) considering threshold T = 0.1. There were 8 false-negative cases as shown by the bar chart in Figure 10. It was using the same strategy described to experiment I. Although there are variations among the distance values, it is smaller when compared to values of experiment I, and the results were relatively better. However, the identification is also not good because it still presents a high error rate, mainly for false negative. This fact is a problem, since about 40% ascospore samples were not identified. Using the same strategy in experiment III, the shape curvature based method identified 55 out of 60 cases correctly (about 92%), considering threshold T = 0.3. There were 3 false-negative and 2 false-positive cases as shown by the bar chart in Figure 11. This error rate is considerably small when compared to other experiments presented here. This result refers to a small difference among descriptors obtained by applying the power spectrum and curvature methods, as observed in the graph shown in Figure 8b. The estimated distance makes better ascospore identification possible. However, there are still some samples with small differences in relation to the average vector identified as ascospores (false-positive). The results obtained by applying each method were submitted to discriminate analyses process to define the threshold to classification. The values resulting on discriminate analyses were used as initial starting point, and by analyzing the classification results the threshold suggested were adjusted to minimize identification error. For example, the discriminate analyses result in values 0.02, 0.16 and 0.37, to the experiments I, II and II, respectively. The selection of the thresholds was performed by linear discriminate analysis evaluating the Mahalanobis distance (Seber 1984; Krzanowski and Marriot 1998). In these experiments, false-negative cases occur due to deformations in the ascospore shape caused in the collection process or in the image acquisition process. The ascospores present cylindrical shape with central dilatation and the collection disc has a transparent and adherent product on the surface. These factors lead to different perspectives of spores depending on the angle that it adheres on the disc. Other factors, such as microscope focus variation, may also cause deformations, which appear after the segmentation process. Besides, there are particles with the shape quite similar to the ascospores, as it may be observed in Figure 5. Consequently, this kind of mistake is also possible to occur when a specialist analyzes the disc. The great number of particles contained in a single image is another difficulty faced by specialists. Therefore, it is important to emphasize that although there are factors, which can harm the identification process, experiment III had a considerable success rate using only one shape description method - curvature. This method extracted features capable of identifying most of the samples correctly, even with shape perspective variations and deformations. This result was not obtained in former experiments through shape signature and horizontal projection applied separately, but perhaps better results can be obtained through synergy among different methods. Concluding Remarks This paper has presented the results obtained from three different methods for shape analyses applied to identify ascospore particles: shape signature, horizontal projection and curvature. The power spectrum has also been applied to resultant signal obtained from these methods and coefficients have been selected as descriptors to compound the feature vectors from results. The distances have been estimated for each one of the vectors in order to identify ascospore samples by defined threshold. The curvature method has presented a better result compared to the other two methods. An important issue observed in these experiments has been the result obtained only through the curvature and the power spectrum methods. As further work, other experiments will be performed applying the same feature vectors presented, obtained by this approach, using artificial neural network (ANN) trying to improve the ascospore identification process. This is the first step to develop equipment for analyzing the images in real-time obtained in loco. References
|
