
|
Electronic Journal of Biotechnology
Universidad Católica de Valparaíso
ISSN: 0717-3458
Vol. 9, Num. 5, 2006, pp. 467-481
|
Electronic Journal of Biotechnology, Vol. 9, No. 5, October, 2006, pg. 467-481
RESEARCH ARTICLE
Agronomic and molecular analyses for the characterisation of accessions in Tunisian olive germplasm collections
Wael Taamalli1, Filippo
Geuna2 , Riccardo
Banfi3 , Daniele
Bassi4 , Douja
Daoud5 , Mokhtar
Zarrouk*6
1Laboratoire
Caractérisation et Qualité de l’Huile d’Olive,
Centre de Biotechnologie,
Technopole de Borj Cedria,
BP 901, 2050, Hammam-Lif, Tunisia,
Tel: 216 71 855430,
Fax: 216 71 855934,
E-mail: taamalli.wael@cbbc.rnrt.tn
2Dipartimento di Produzione Vegetale,
Università degli Studi di Milano,
Via Celoria 2, 20133, Milano, Italy ,
Tel: 39 02 50316550,
Fax: 39 02 50316553
E-mail: filippo.geuna@unimi.it
3Dipartimento di Produzione Vegetale,
Università degli Studi di Milano,
Via Celoria 2, 20133, Milano, Italy
Tel: 39 02 50316550
Fax: 39 02 50316553
E-mail: riccardo.anfi@unimi.it
4Dipartimento di Produzione Vegetale,
Università degli Studi di Milano,
Via Celoria 2, 20133, Milano, Italy,
Tel: 39 02 50316550,
Fax: 39 02 50316553
E-mail: daniele.bassi@unimi.it
5Laboratoire Caractérisation et Qualité de l’Huile d’Olive,
Centre de Biotechnologie,
Technopole de Borj Cedria,
BP 901, 2050, Hammam-Lif, Tunisia,
Tel: 216 71 855430
Fax: 216 71 855934
E-mail: douja.daoud@cbbc.rnrt.tn
6Laboratoire Caractérisation et Qualité de l’Huile d’Olive,
Centre de Biotechnologie,
Technopole de Borj Cedria,
BP 901, 2050, Hammam-Lif, Tunisia,
Tel: 216 71 855430
Fax: 216 71 855934
E-mail: mokhtar.zarrouk@cbbc.rnrt.tn
*Corresponding
author
Financial
support: The present work has been done
in the framework of a research programme (2002-2005) funded by the
Tunisian Ministry of Science Research, Technology and Competency
Development.
Code Number: ej06066
Abstract
In
this study, a total of 14 agronomic traits, five AFLP primer combinations
and ten SSR loci were used to describe and to classify a group of
Tunisian olive genotypes into groups based on molecular profiles and
agronomic traits. The analysis of variance of the agronomical data
revealed significant differences among accessions for all measured
traits. The mean phenotypic dissimilarity (0.34 with a range of 0.08-0.6)
was low in comparison to dissimilarity calculated using AFLP (0.50
with a range of 0.16-0.70) and SSR markers (0.76 with a range 0.35-0.94). The
correlation between the agronomical dissimilarity matrix and the matrices
of genetic dissimilarity based on SSR and AFLP markers was very weak:
0.156 (p = 0.05) and 0.185 (p = 0.05), respectively. The SSR-AFLP
dendrogram based on unweighted pair-group cluster analysis using Jaccard’s
index revealed that the genetic diversity was predominantly structured
according to fruit size. A trend of clustering together of accessions
originating from the same or adjacent regions was also observed. The
data obtained can be used for the varietal survey and construction
of a database of all olive varieties grown in Tunisia and providing
also additional information that could form the basis for the rational
design of breeding programs.
Keywords: agronomic traits, AFLP, Olea europaea, SSR.
Abbreviations: |
AFLP:
amplified fragment length polymorphisms
ISSR: intermicrosatellites
PCA: perform principal component
PCoA: principal coordinates analysis
SSR: microsatellites
UPGMA: unweighted pair group method based on arithmetic averages |
The
olive tree (Olea europaea L.) is a subtropical species typical
of the Mediterranean basin where it represents the most important
oil-producing crop. It is a diploid, out crossing species with a very
wide genetic patrimony. Since the beginning of its domestication,
olive has been propagated vegetatively to exploit the best combination
of genes which arose by random crosses or mutations (Carriero
et al. 2002). As a result, a great number of varieties are present
in all the countries where this species is cultivated, raising several
problems for germplasm management and preservation (Carriero
et al. 2002). Evaluation and characterisation of olive genetic
resources is therefore crucial, since identification of olive cultivars
is complicated by the large number of varietal synonyms and homonyms,
the intensive exchange of plant material, the presence of varietal
clones, and problems of varietal certification in nurseries (Bandelj
et al. 2002).
Morphological
and biological characters have been widely used for descriptive purposes
and are commonly used to distinguish olive cultivars (Cantini
et al. 1999). Agronomic characterization also allowed the classification
of different olive cultivars (Barranco and Rallo, 2000).
In order to supplement and refine the initial phenotypical based descriptions,
different genetic markers such as randomly amplified polymorphic DNA
(RAPD) markers (Fabbri et al. 1995; Wiesman
et al. 1998; Belaj et al. 2001; Besnard
et al. 2001b; Sanz-Cortés et al. 2001; Nikoloudakis
et al. 2003), amplified fragment length polymorphisms (AFLP) (Angiolillo
et al. 1999; Rotondi et al. 2003; Sanz-Cortés
et al. 2003; Sensi et al. 2003), microsatellites
(SSR) (Carriero et al. 2002; Cipriani
et al. 2002) and intermicrosatellites (ISSR) (Hess
et al. 2000) have been applied to identify and characterize different
cultivars or genotypes and in order to provide information on olive
origin and dispersal.
Tunisia
occupies the fourth place on world scale in terms of olive oil production.
Tunisian olive plantations count about 63 million trees covering 1.6
million of hectares and estimated to include more than 50 cultivars.
Despite this economic importance, little is known about the olive
germplasm of this country and about the genetic relationships among
them. In fact Tunisian olive tree is dominated by the variety-population
‘Chemlali’ that occupies more than 2/3 of the total olive growing
area. It is a cultivar for oil production, well adapted to arid and
semiarid zones but its oil shows physico-chemical drawbacks (high
saturated-fatty acids content, notably the palmitic acid, a high level
of linoleic acid and a low level of oleic acid). Whereas a wide range
of minor cultivars are cultivated around their presumed areas of origin
and have a limited diffusion outside these areas. The study of these
less-common cultivars appears of particular interest because they
may have agronomic characteristics which can be relevant to olive
growers. The objectives of this paper are: to describe relationships
among Tunisian olive cultivars using agronomic and molecular markers,
to assess the correlation between distance estimates based on agronomic
characterisation and AFLP and SSR molecular markers, and to classify
the cultivars into groups based on molecular profiles and agronomic
traits.
Materials
and Methods
Plant
material
Agronomic
and molecular analyses were performed on 26 olive (Olea europaea L.) accessions: 25 accessions belonging to 25 cultivars and one accession
without denomination. These were obtained from four collections maintained
in experimental orchards at the ‘Institut de l’Olivier’ (IO), ‘Institut
National des Sciences Appliquées et de
la
Technologie
’ (INSAT), ‘Centre de Biotechnologie de
Borj Cedria’ (CBBJ) and Sbitla (Kasserine). Denominations of genotypes
are provided in Table 1.
Table
1. List of accessions studied. |
Accession |
Use |
Collection |
Geographic
origin |
Meski |
Table |
Chott
Meriem |
North |
Gerboui |
Oil
and Table |
Chott
Meriem |
North |
Marsaline |
Oil
and Table |
Chott
Meriem |
North |
Chétoui |
Oil |
Chott
Meriem |
North |
Sayali |
Oil
and Table |
Chott
Meriem |
North |
Zarrazi |
Oil
and Table |
Chott
Meriem |
South |
Chemlali |
Oil |
Chott
Meriem |
South |
Neb
Djemel |
Oil |
Chott
Meriem |
North |
Rakhami |
Oil |
Chott
Meriem |
North |
Chemchali |
Oil
and Table |
Chott
Meriem |
South |
El
Hor |
Oil |
Sbeitla |
Centre |
Oueslati |
Oil |
Sbeitla, |
Centre |
Mongar
Ragma |
Oil
and Table |
Sbeitla |
- |
Swabaa
Algia |
Table |
Sbeitla |
- |
Semni |
Oil |
Sbeitla |
South |
Kbiret
Louzir |
Oil |
Borj
Cedria |
South |
Jdallou |
Oil |
Borj
Cedria |
South |
Kchinnet
Sig |
Oil |
Borj
Cedria |
South |
Injassi |
Table |
Borj
Cedria |
South |
Dhokkar |
Oil |
Borj
Cedria |
South |
Toffahi |
Oil
and Table |
Borj
Cedria |
South |
Jemri
Dhokkar |
Oil |
Borj
Cedria |
South |
Regregui |
Oil
and Table |
Borj
Cedria |
North |
Ain
Jarbouaa |
Oil
and Table |
Borj
Cedria |
North |
Unknown |
Oil |
Borj
Cedria |
South |
Besbassi |
Table |
Borj
Cedria |
North |
Agronomic
and chemical characters
Some
agronomic and biochemical characteristics were measured or analyzed
as mean of 2003 and 2004 (Table 2). At the mature stage, 200
olives (3 replicates per genotype) were picked randomly and then split
in two samples, one put in oven to dry, the other used for fresh fruit
and pit analysis and fatty acids determination. Average fruit weight
was determined and, after removing and cleaning the stones, flesh
and stone weights were also recorded. Oil content was determined by
extracting the dry material with 40–60°C petroleum ether using a Soxhlet
apparatus. Olive oil used for the qualitative analysis was extracted
from fresh material using methanol-chloroform (1:1, v/v) according
to Allen and Good (1971). Fatty acids were determined,
as methyl ester, by gas chromatography. Methylesters were released
by transesterefication with BF3/methanol after saponification with
methanolic KOH. The fatty acid pattern was assessed with a HP 4890
D (Agilent Technologies) equipped with a split-splitless injector,
a FID detector and a
30 m
X
0.25 mm
fused silica capillary column
coated with a 0.25 µm film (HP Innowax). The temperatures of the injector,
detector and oven were 230, 250 and
210ºC
respectively. The carrier
gas was nitrogen, with a flow through the column of 1 ml/min. The
data resulting from the two-year study were averaged and used for
statistical analysis.
Table
2. Agronomic parameters used in multivariate analysis. |
|
Fruit
Fresh Wt (g) |
Fruit
Dry Wt (g) |
Stone
Fresh Wt (g) |
Flesh
Fresh Wt (g) |
Flesh
/ stone |
Oil
contenta (%) |
Oil
contentb (%) |
Palmitic
acid (%) |
Palmetoleic
acid (%) |
Stearic
acid (%) |
Oleic
acid (%) |
Linoleic
acid (%) |
Linolenic
acid (%) |
Arachidic
acid (%) |
Meski |
6,57 |
2,92 |
0,68 |
5,89 |
8,66 |
20,23 |
45,46 |
12,00 |
0,89 |
3,16 |
66,01 |
16,77 |
0,78 |
0,41 |
Sayali |
2,70 |
1,28 |
0,35 |
2,35 |
6,71 |
24,40 |
51,27 |
11,00 |
0,60 |
2,00 |
81,70 |
3,70 |
0,60 |
0,40 |
Chemlali |
1,05 |
0,46 |
0,17 |
0,88 |
5,18 |
18,50 |
42,00 |
17,90 |
2,30 |
2,20 |
61,30 |
15,10 |
0,70 |
0,40 |
Gerboui |
2,43 |
1,23 |
0,42 |
2,01 |
4,79 |
24,00 |
47,41 |
13,90 |
0,70 |
2,90 |
58,80 |
22,50 |
0,80 |
0,40 |
Marsaline |
4,95 |
2,11 |
0,70 |
4,25 |
6,07 |
20,00 |
46,88 |
9,35 |
0,87 |
4,91 |
76,87 |
6,90 |
0,64 |
0,45 |
Chétoui |
2,27 |
1,08 |
0,41 |
1,86 |
4,54 |
24,15 |
50,60 |
12,40 |
0,70 |
3,00 |
63,10 |
19,00 |
0,60 |
0,40 |
Besbassi |
9,22 |
3,65 |
1,06 |
8,16 |
7,70 |
18,00 |
45,43 |
14,16 |
0,83 |
2,70 |
64,60 |
16,70 |
0,59 |
0,56 |
Kchinnet
Sig |
1,54 |
0,70 |
0,25 |
1,29 |
5,16 |
19,45 |
42,79 |
19,90 |
2,30 |
2,20 |
57,30 |
17,10 |
0,70 |
0,40 |
Neb
Djemel |
2,88 |
1,01 |
0,53 |
2,35 |
4,43 |
17,01 |
48,45 |
13,55 |
0,94 |
2,23 |
59,78 |
21,68 |
1,32 |
0,49 |
El
Hor |
1,10 |
0,58 |
0,24 |
0,86 |
3,58 |
21,40 |
40,94 |
16,10 |
2,10 |
2,13 |
68,45 |
10,11 |
0,71 |
0,40 |
Oueslati |
1,55 |
0,73 |
0,23 |
1,32 |
5,74 |
26,56 |
56,39 |
11,20 |
0,60 |
2,70 |
69,90 |
14,60 |
0,60 |
0,40 |
Mongar
Ragma |
3,01 |
1,10 |
0,47 |
2,54 |
5,40 |
19,00 |
51,99 |
11,86 |
0,76 |
1,86 |
73,53 |
10,71 |
0,86 |
0,42 |
Swabaa
Algia |
3,10 |
1,45 |
0,53 |
2,57 |
4,85 |
19,20 |
41,04 |
14,95 |
1,01 |
3,49 |
63,67 |
15,36 |
0,87 |
0,59 |
Semni |
1,29 |
0,53 |
0,22 |
1,08 |
5,00 |
25,34 |
61,68 |
15,45 |
1,02 |
1,81 |
62,27 |
18,45 |
0,60 |
0,39 |
Kbiret
Louzir |
1,33 |
0,61 |
0,20 |
1,13 |
5,65 |
21,45 |
46,77 |
15,90 |
2,10 |
2,20 |
63,30 |
15,10 |
0,70 |
0,40 |
Jdallou |
1,39 |
0,68 |
0,34 |
1,05 |
3,09 |
20,56 |
42,03 |
16,34 |
2,23 |
2,78 |
62,68 |
14,78 |
0,70 |
0,43 |
Injassi |
5,32 |
2,21 |
0,77 |
4,55 |
5,91 |
16,50 |
39,72 |
15,00 |
0,90 |
2,70 |
69,10 |
11,30 |
0,50 |
0,50 |
Chemchali |
3,01 |
1,09 |
0,32 |
2,69 |
8,41 |
19,62 |
54,18 |
14,00 |
0,90 |
2,70 |
71,10 |
10,30 |
0,50 |
0,50 |
Toffahi |
3,12 |
1,67 |
0,44 |
2,68 |
6,09 |
33,40 |
62,40 |
12,00 |
2,00 |
2,01 |
70,20 |
12,70 |
0,55 |
0,33 |
Zarrazi |
3,65 |
1,78 |
0,47 |
3,18 |
6,77 |
29,55 |
60,48 |
8,84 |
0,47 |
3,35 |
73,75 |
12,50 |
0,60 |
0,48 |
Dhokkar |
2,01 |
1,12 |
0,30 |
1,71 |
5,70 |
27,00 |
48,46 |
12,90 |
0,70 |
2,90 |
60,80 |
21,50 |
0,80 |
0,40 |
Ain
Jarbouaa |
4,02 |
1,50 |
0,51 |
3,51 |
6,88 |
20,95 |
56,15 |
11,55 |
1,13 |
2,86 |
73,37 |
10,25 |
0,83 |
0,41 |
Jemri
Dhokkar |
1,30 |
0,77 |
0,27 |
1,03 |
3,81 |
23,30 |
39,27 |
20,86 |
2,19 |
3,52 |
55,28 |
16,89 |
0,67 |
0,60 |
Unknown |
0,95 |
0,41 |
0,11 |
0,84 |
7,33 |
23,95 |
55,49 |
9,60 |
0,40 |
3,79 |
68,77 |
15,15 |
0,69 |
0,69 |
Rakhami |
1,98 |
0,88 |
0,47 |
1,51 |
3,21 |
21,02 |
47,45 |
8,33 |
0,49 |
3,46 |
70,67 |
15,74 |
0,89 |
0,41 |
Regregui |
2,83 |
1,26 |
0,33 |
2,50 |
7,58 |
18,95 |
42,56 |
10,11 |
1,06 |
2,25 |
72,19 |
13,30 |
0,65 |
0,42 |
aFruit
Fresh weight basis
bFruit
dry weight basis |
DNA
extraction
Five
hundred milligrams of young leaves were collected, rinsed with tap
water, frozen in liquid nitrogen, ground to a fine powder in a reciprocal
grinding apparatus (Mixer Mill MM300, Retsch,
Haan, Germany) and kept at
-80ºC
until DNA isolation. Genomic DNA was extracted from the ground tissue
according to Geuna et al. (2003). DNA yield and
quality were assessed by gel electrophoresis using standards.
Microsatellite
assay
Ten
developed primer pairs for olive microsatellite loci (Sefc
et al. 2000) were selected for their polymorphism and the clarity
of their electrophoretic profiles. The loci amplified by these primer
pairs were designated as: ssrOeUA-DCA1, ssrOeUA-DCA3, ssrOeUA-DCA4,
ssrOeUA-DCA7, ssrOeUA-DCA9, ssrOeUA-DCA11 ssrOeUA-DCA13, ssrOeUA-DCA15,
ssrOeUA-DCA16 and ssrOeUADCA18. PCR reactions were performed in a
total volume of 20 µL containing
100 mM
Tris-HCl (pH 9.0),
50 mM
KCl,
1.5 mM
MgCl2,
0.2 mM
each dNTP, 0.125 µM each primer,
0.2 U of Taq DNA Polymerase (Platinum Taq DNA Polymerase, Invitrogen) and 10 ng of template DNA. To
enable the detection and sizing of PCR fragments, the forward primer
was labelled with γ-33P-ATP (Perkin-Elmer).
PCR products were mixed with an equal volume of loading buffer (95%
formamide, 200 µM EDTA, 0.1% bromophenol blue and 0.1% xylene cyanol)
and denatured at
95ºC
for 5 min. Then, 5 µL of each
sample was loaded on a 6% denaturating polyacrylamide gel. The gel
was run in 1 X TBE buffer (
0.089
M
Tris–borate,
0.002
M
EDTA, pH 8.3) at constant power of 60 W for
1-2 hrs. After electrophoresis, the gel was fixed for 25 min in 10%
acetic acid, rinsed with water three times for 2 min each, dried and
exposed to autoradiographic film (Hyperfilm MP, Amersham)
for 3 to 5 days. The fragments amplified by microsatellite primers
were scored as alleles on the basis of size in comparison with a molecular
weight marker (10 bp DNA Ladder, Invitrogen).
AFLP
assay
The
AFLP protocol was performed according to the procedure described by Vos et al. (1995). 500 ng of genomic DNA was double
digested with EcoRI and MseI enzymes (2.5 U each) and linked to adapters
(50 and 5 pmols of MseI and EcoRI adapters, respectively). Restricted
and ligated DNA (25 ng) was then pre-amplified using EcoRI and MseI
primers (25 ng) with one selective nucleotide. PCR pre-amplifications
were prepared in a total volume of 25 μl and amplification was
carried out in a PTC-100 thermal cycler (MJ Research Inc., Watertown,
MA, USA), using 20 cycles of
92ºC
for 30 sec,
60ºC
for 30 sec and
72ºC
for 60 sec. The pre-amplification
products, diluted 1:10, were used as template for selective amplifications
using a total of five primer combinations (15 ng of each) with three
selective nucleotides (EcoRI-AAC/MseI-CAA, EcoRI-AAC/MseI-CAC, EcoRIAAG/MseI-CAA,
EcoRI-ACT/MseI-CAA, EcoRI-AAC/MseI-CTT). EcoRI primers were end-labeled
with γ-33P-ATP (Perkin-Elmer), and selective amplification
was carried out in a 10 µL volume using the following temperature
profile: 12 cycles of
94ºC
for 30 sec,
65ºC
for 30 sec with a decrease of annealing temperature of
0.7ºC
per cycle, and
72ºC
for 1 min, followed by 24 cycles
at the annealing temperature of
56ºC
. PCR products were resolved
on a 6% polyacrylamide denaturating gel, visualised by autoradiography
and manually scored for the presence or absence of bands. The reproducibility
of the AFLP fingerprints was assessed on two DNA samples by replicating
the entire procedure starting from the original DNA for all the primer
combinations. No unstable bands were detected.
Data
analysis
Analysis
of variance was performed for all measured traits in order to test
the significance of variation among accessions. The standardized traits
mean values (mean of each trait was subtracted from the data values
and the result divided by the standard deviation) were used to perform
principal component (PCA) and cluster analyses using XLSTAT software.
To group the accessions based on agronomical dissimilarity, cluster
analysis was conducted on the Euclidean distance matrix with the unweighted
pair group method based on arithmetic averages (UPGMA).
For
molecular diversity analysis, AFLP and microsatellite results were
scored for presence (1) or absence (0) of amplified markers. Genetic
distance was calculated on the basis of Jaccard’s coefficient method
(Jaccard, 1908). The combined SSR-AFLP similarity
matrix was subjected to cluster analysis by UPGMA. The individual
SSR-AFLP genotypes scores were plotted in a bidimensional space using
principal coordinates analysis (PCoA) by computing the genetic distance
matrix using the GENSTAT software, 8th edition. The relationships
between the Euclidean distance matrix based on agronomic traits and
genetic distance matrices obtained with SSR and AFLP markers were
analyzed according to Mantel (1967).
Results
Phenotypic
variability
The
analysis of variance revealed significant differences among accessions
for all of the studied traits (Table 3). The
average fruit fresh and dry weights, flesh and pit fresh weights and
palmitoleic acid percentage showed wide variation, while fruit oil
content on dry weight basis and oleic acid percentage showed a narrower
range of phenotypic variation. The 14 studied variables were analysed
by PCA (data not shown). The eigenvalues obtained by PCA on the agronomic
data indicate that two to three components provide a good summary
of the data. In particular, the first two components (PC1 and PC2)
accounted for 56.7% of total variance, and three components explained
68.8%. The other components contribute less than 10% each. Variables
such as fruit fresh and dry weights, flesh and pit fresh weights (on
PC1), palmitic and oleic acids percentages and fruit oil content on
fresh and dry weight basis (on PC2) explained the largest portion
of the variance. In the third PC, which explained 12.1% of total variation,
the predominating traits were fatty acid percentages (excluding oleic
acid).
Table
3. Descriptive statistics analysis of agronomic traits. |
|
Minimum |
Maximum |
Mean |
Standard
Deviation |
Coefficient
of Variation (%) |
Fruit
Fresh Wt (g) |
0.950 |
9.220 |
2.868 |
1.915 |
66.780 |
Fruit
Dry Wt (g) |
0.410 |
3.650 |
1.262 |
0.772 |
61.158 |
Pit
Fresh Wt (g) |
0.110 |
1.060 |
0.415 |
0.212 |
51.194 |
Flesh
Fresh Wt (g) |
0.840 |
8.160 |
2.453 |
1.717 |
69.970 |
Flesh
to pit ratio (Fresh Wt basis) |
3.090 |
8.660 |
5.702 |
1.509 |
26.465 |
Oil
content (Fruit Fresh Wt basis) (%) |
16.500 |
33.400 |
22.057 |
3.987 |
18.074 |
Oil
content (Fruit Dry Wt basis) (%) |
39.270 |
62.400 |
48.742 |
6.896 |
14.147 |
Palmitic
acid (%) |
8.330 |
20.860 |
13.429 |
3.227 |
24.034 |
Palmetoleic
acid (%) |
0.400 |
2.300 |
1.161 |
0.654 |
56.355 |
Stearic
acid (%) |
1.810 |
4.910 |
2.762 |
0.711 |
25.750 |
Oleic
acid (%) |
55.280 |
81.700 |
66.865 |
6.440 |
9.631 |
Linoleic
acid (%) |
3.700 |
22.500 |
14.546 |
4.423 |
30.405 |
Linolenic
acid (%) |
0.500 |
1.320 |
0.710 |
0.166 |
23.373 |
Arachidic
acid (%) |
0.330 |
0.690 |
0.449 |
0.082 |
18.182 |
Molecular
analysis
The
two molecular approaches used in this study could uniquely fingerprint
each of the 26 olive accessions. The 5 primer combinations used to
perform the AFLP analysis yielded a total of 418 bands with a percentage
of polymorphism of 56.46% (Table 4). Only 129
well-defined bands were analysed in the whole set of data. A typical
AFLP band pattern for the 26 accessions is shown in Figure
1a. Microsatellites were successfully amplified in all the analysed
accessions with the ten primer pairs used. Patterns generated by primer
pair ssrOeUA-DCA18 in accessions are shown in Figure
1b. All ten microsatellite markers were polymorphic across the
screened genotypes, revealing a total of 86 alleles. The number of
alleles for each locus varied from four at locus ssrOeUA-DCA15 to
fourteen at locus ssrOeUA-DCA4, with an average of 8.6 (Table
5).
Table
4. Primer combinations and level of polymorphism obtained by AFLP. |
Primer
pair combination |
Number
of polymorphic fragments |
Total
number of amplified fragments |
Polymorphisms
(%) |
Scored
bands |
EcoRI-AAC/MseI-CAA |
47 |
88 |
53.409 |
27 |
EcoRI-AAC/MseI-CAC |
54 |
85 |
63.529 |
27 |
EcoRIAAG/MseI-CAA |
46 |
77 |
59.740 |
26 |
EcoRI-ACT/MseI-CAA |
42 |
81 |
51.852 |
21 |
EcoRI-AAC/MseI-CTT |
47 |
87 |
54.023 |
28 |
Total |
236 |
418 |
56.459 |
129 |
Table
5. List of the SSR loci analysed. |
Locus |
Range
of sizes (bp) |
No.
of alleles |
ssrOeUA-DCA1 |
208–240 |
9 |
ssrOeUA-DCA3 |
232–252 |
8 |
ssrOeUA-DCA4 |
132–188 |
14 |
ssrOeUA-DCA7 |
129–169 |
9 |
ssrOeUA-DCA9 |
163–209 |
11 |
ssrOeUA-DCA11 |
129–163 |
8 |
ssrOeUA-DCA13 |
120–140 |
5 |
ssrOeUA-DCA15 |
244–268 |
4 |
ssrOeUA-DCA16 |
124–182 |
10 |
ssrOeUA-DCA18 |
170–186 |
8 |
Average |
|
8.6 |
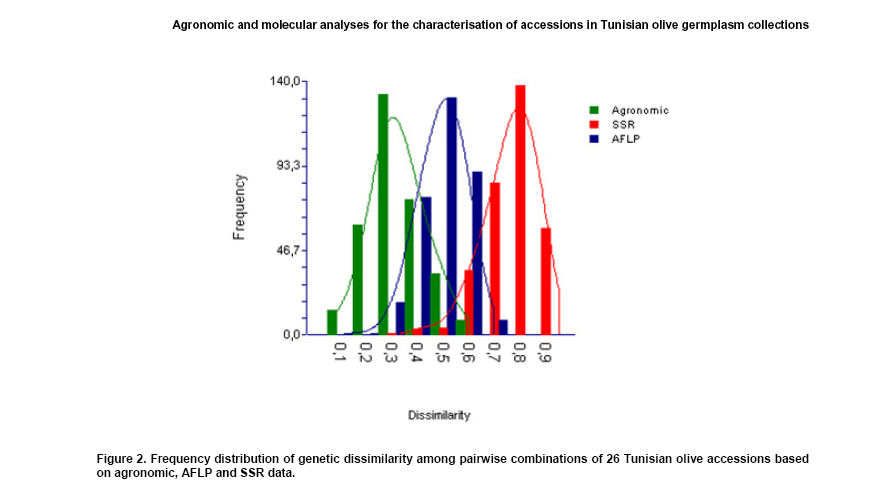
Distribution
of dissimilarity coefficients
A
histogram of pair wise dissimilarity for the 26 Tunisian olive accessions
generated from SSR, AFLP and agronomic data is presented in Figure
2. The dissimilarity coefficients based on agronomic traits ranged
from 0.08 to 0.60 with an average of 0.34. Based on SSR, these values
ranged from 0.35 to 0.94 with an overall mean of 0.76. For AFLP, it
ranged from 0.16 to 0.70 with an overall mean of 0.50.
Correlations
between dissimilarity matrices
To
compare the extent of agreement between dendrograms derived from agronomic,
AFLP and SSR data, a distance matrix was constructed for each assay
and compared using the Mantel matrix correspondence test. The estimated
correlation for the two molecular systems was significant but relatively
low (r = 0.3, p = 0.001). The AFLP and SSR data were poorly correlated
with the agronomic data (r =0.185, p = 0.05 and r = 0.156, p = 0.05,
respectively).
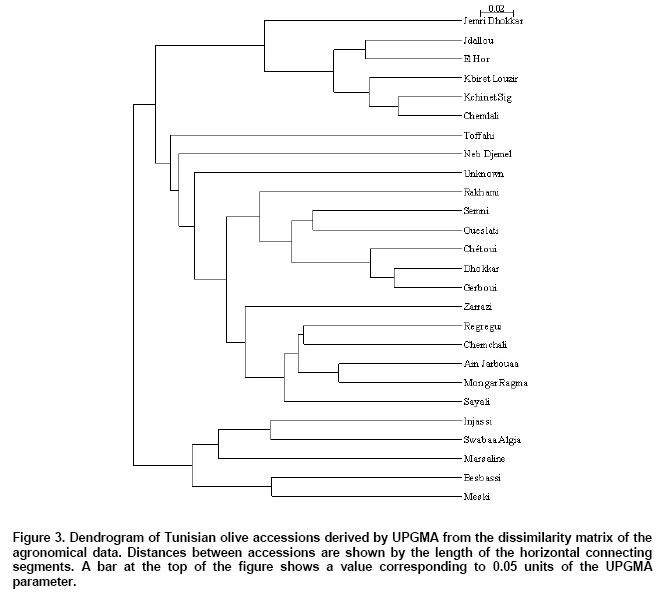
A
dendrogram generated from the standardized phenotypic data is presented
in Figure 3. The UPGMA cluster analysis revealed
three main groups. Group 1 consisted of ‘Meski’, ‘Injassi’, ‘Besbassi’
and ‘Marsaline’, four accessions featuring large-sized fruits (4.95-
9.22
g
); the first three accessions are among the
most important Tunisian table cultivars, whereas the letter is used
for both oil and canning. ‘Swabaa Algia’, a medium-sized table olive
clustered also within this group. Group 2 comprised two subgroups.
One of them comprised six accessions used for both oil and canning
(‘Ain Jarboua’, ‘Mongar Ragma’, ‘Regregui’, ‘Chemchali’, ‘Zarrazi’
and ‘Sayali’) that have medium-sized fruits (2.4-
4 g
), medium oil content (42-56%), high
oleic (70.9-81%) and low linoleic (3.7-13.3%) acids contents. Five
oil-producing accessions ‘Rakhami’, ‘Oueslati’, ‘Semni’, ‘Chétoui’
and ‘Dhokkar’, as well as the accession ‘Gerboui’, which has dual
uses (oil and table) clustered together in the second subgroup. Small
fruit size (1.3-
2.4 g
) and high linoleic acid content
(14.6-22.5%) characterized accessions in this subgroup. The accessions
‘Unknown’, ‘Neb Djemel’ and ‘Toffahi’ also branched in the second
group at a higher value of dissimilarity. Group 3 included 6 accessions,
all used for oil production, with very small fruits (1-
1.5
g
) and oils rich in palmitoleic acid (2.1-2.3%).
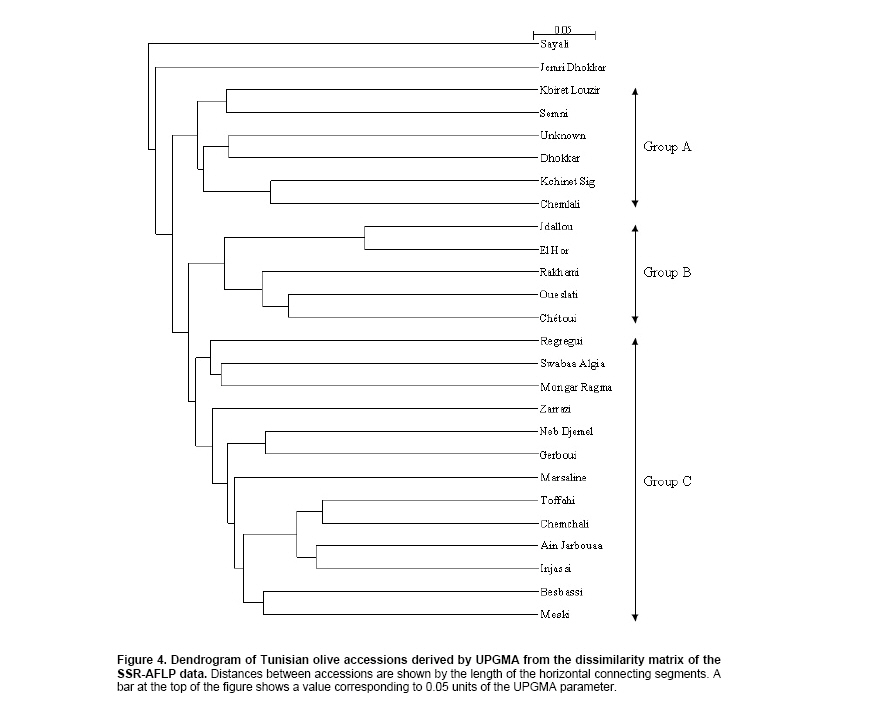
The
dendrogram generated based on a combined SSR and AFLP data set (Figure
4) showed three main groups: Group A, including 6 accessions,
Group B, including 5 accessions and Group C, with 13 accessions, while
‘Sayali’ and ‘Jemri Dhokkar’ showed the lowest similarity to all accessions
and were set apart from the three clusters. Group A consisted of six
Southern accessions originating from the arid regions of Sfax (‘Semni’,
‘Kbiret Louzir’, ‘Unknown’, ‘Chemlali’ and ‘Kchinet Sig’) and Zarzis
(‘Dhokkar’). All accessions in this cluster have small-sized fruits
and are typically used for oil production. Group B comprised five
small-fruited accessions used for oil production. Two of them originate
from the North of Tunisia (‘Chétoui’ and ‘Rakhami’); two (‘El Hor’
and ‘Oueslati’) originate from the semiarid zones of
El
Ala
and Oueslatia (Kairouan, Centre
of Tunisia), the accession ‘Jdallou’ comes from the South of the country.
Group C included 13 accessions that have either medium- or large-sized
fruits and showed two subgroups. One of them comprised three medium-fruited
accessions, ‘Mongar Ragma’ and ‘Swabaa Algia’, whose zones of origin
are uncertain, and the accession ‘Regregui’ from
Northern
Tunisia
. The accessions ‘Injassi’, ‘Chemchali’ and ‘Toffahi’
from the South (Gafsa and Tataouine) as well as the accessions ‘Meski’,
‘Besbassi’ and ‘Ain Jarbouaa’ from the North clustered together in
the second subgroup. The accessions ‘Marsaline’, ‘Zarrazi’ as well
as the pair ‘Regregui’-‘Neb Djemel’ branched also in the second subgroup
rather independently from the other accessions.
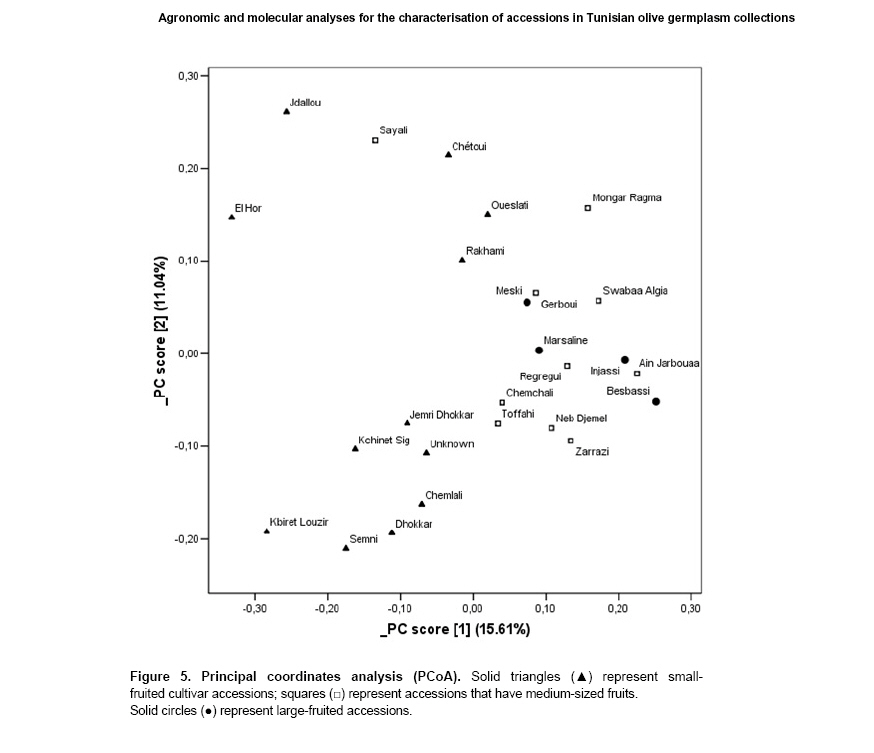
The
principal coordinates analysis (Figure 5) where
the first two principal components accounted for 33.5% of the variance,
seems to support the results obtained by cluster analysis. The pattern
shown in Figure 4 was comparable to the
clustering observed in the UPGMA dendrogram (Figure
5). With the exception of ‘Sayali’, genotypes that have either
medium or large-sized fruits were scattered separated from the small-fruited
genotypes. Again with one exception (‘Jdallou’), the PCoA separated
the Southern oil producing accessions from those originating from
the North and the Centre of Tunisia.
Discussion
In
this study, we used AFLP and SSR markers and agronomic traits to characterize
a set of 26 Tunisian olive accessions. Polymorphism was evident for
all three marker systems. This result is consistent with results from
previous studies carried out on olive cultivars (Fabbri
et al. 1995; Wiesman et al. 1998; Angiolillo
et al. 1999; Baldoni et al. 2000; Rallo
et al. 2000; Belaj et al. 2001; Besnard
et al. 2001b; Sanz-Cortés et al. 2001), thereby
confirming the great diversity within the cultivated olive germplasm.
The distribution of values for agronomic dissimilarity and genetic
dissimilarity (calculated with SSRs and AFLPs) differed markedly.
The mean agronomic dissimilarity (0.34 with a range of 0.08-0.6) was
low in comparison to dissimilarity calculated using AFLP (0.50 with
a range of 0.16-0.70) and SSR markers (0.76 with a range 0.35-0.94).
This data suggest that SSR and AFLP markers can better differentiate
pairs of accessions than agronomic traits that show a low level of
genetic variation. Comparing the two marker types, a higher level
of polymorphism was obtained for SSR than for AFLP (Table 6) which highlights the discriminating power of the former. This
result is in accordance with previous studies where SSRs were compared
to other marker systems (Powell et al. 1996; Pejic
et al. 1998; Belaj et al. 2003). The high variability
observed at SSR loci was expected because of the unique mechanism
by which this variation is generated: replication slippage is thought
to occur more frequently than single nucleotide mutations and insertion/deletion
events, which generate the polymorphisms detectable by AFLP analysis
(Powell et al. 1996; Milbourne et
al. 1997).
Table
6. Comparison of the microsatellites and AFLP data in 26 olive accessions. |
|
AFLP |
SSR |
Number
of assay units |
5 |
10 |
Number
of polymorphic bands |
236 |
86 |
Average
number of polymorphic bands/assay unit |
25.8 |
8.6 |
Number
of loci |
418 |
10 |
Number
of loci/assay unit |
83.6 |
1 |
Average
number of alleles per locus |
2 |
8.6 |
To
provide an objective comparison, we examined correlations between
distance matrices calculated on the basis of AFLP, SSR and agronomical
data using a Mantel matrix correspondence test. The estimated correlation
similarities for the two molecular systems was significant but relatively
low. The type of genetic polymorphism detected by the two markers
and the number of primers used may affect the correlations among them.
The correlation between the two molecular markers was higher than
the agronomy. When compared with DNA fingerprinting techniques, agronomic
traits are relatively less reliable and efficient for precise discrimination
of closely related accessions and analysis of their genetic relationships.
Despite this limitation, numerical analysis of olive agronomic traits
can be used as a general approach to establish from a practical viewpoint
a first order of accessions classification within germplasm collections;
it enables accession comparison and diversity conservation. Although
both marker methods did not provide exactly the same description of
relationships between the analysed accessions, there was some consistency.
The best agreement between the two methods was present for accession
pairs that were very distant (e.g. ‘Besbassi’-‘Chemlali’, ‘Besbassi’-‘Jemri
Dhokkar’, ‘Zarrazi’-‘Kchinet Sig’) or very close (e.g. ‘El Hor’- ‘Jdallou’
and, to a lesser extent, ‘Chemlali’-‘Kchinet Sig’, ‘Meski’-‘Besbassi’).
The
UPGMA clustering and the PCoA Plot obtained from the AFLP-SSR distance
matrix showed a rather high variability among the accessions examined
and that most of Tunisian olive accessions clustered according to
their fruit size. For instance small-fruited accessions clustered
in Group A and B. Accessions that have medium to large sized-fruits
clustered in Group C. Genetic differentiation based on fruit size
and use has been observed in previous studies. Grati-Kamoun
et al. (2006), in their AFLP study, obtained a clustering of olive
cultivars into two main groups according to fruit size. Interestingly,
of the 29 cultivars included in their study, ten Tunisian cultivars
are also included here. Grati-Kamoun et al. (2006) found a comparable grouping pattern among ‘Jemri Dhokkar’, ‘Chemlali’,
and ‘Oueslati’ that were grouped with the small-sized cultivars and
‘Marsaline’, ‘Meski’, and ‘Besbassi’ that were in the cluster of the
large-fruited cultivars. The same above-mentioned work showed that
‘Zarrazi’, ‘Chemchali’ and ‘Toffahi’, three medium-fruited cultivars
from Southern Tunisia, clustered with the small-sized olives originating
from the same part of the country while in our assay, these cultivars
were not well separated from those used for canning. The presence
of table olives from other Mediterranean countries in Grati-Kamoun
et al. (2006) study could change the clusters of these cultivars
in the Jaccard’s dendrogram. In a study based on RAPD markers, (Fabbri
et al. 1995) seventeen olive cultivars clustered into two main
groups according to fruit size and oil content. Using the same technique, Nikoloudakis et al. (2003) reported that most of
Greek cultivars clustered according to their fruit size or commercial
use. Another group (Loukas and Krimbas, 1983) studied
22 Greek cultivars based on allozyme markers and found clustering
according to fruit size rather than to geographic origin. Wild and
feral olives are characterized by very small fruits. The relationship
between electrophoretic profiles and the common utilisation of fruits
(oil, canning, or both uses) may be due either to a single origin
of varieties with big fruits or to their less-close proximity with
wild populations due to a stronger or longer selection towards fruit
size (Besnard et al. 2001a). A trend of clustering
of cultivars originating from the same or adjacent regions was also
detected. With the exclusion of ‘Jdallou’, Southern oil producing
cultivars clustered separated from those originating from the North
and the Centre of Tunisia. This was also the case for the pairs of
northern cultivars, ‘Gerboui’-‘Neb Djemel’ and ‘Meski’-‘Besbassi’
which feature medium- and large-sized fruits, respectively. ‘Toffahi’,
‘Chemchali’ and ‘Injassi’, three accessions originating from the South,
formed a small separate cluster, which does not include the accession
‘Zarrazi’. The three first accessions come from interior regions (Gafsa
and Tataouine) where weather conditions are different from coastal
regions such as Zarzis from where originated the accession ‘Zarrazi’.
Clustering of cultivars according to their geographic origin was also
observed in a larger geographic scale study performed by Belaj
et al. (2001) with cultivars from several countries of the
Mediterranean
Basin
. The geographic and
genetic structure was not exclusively observed among cultivars of
different countries, but also within cultivars of the same country
(Claros et al. 2000; Carriero et al.
2002). Moreover, in a specific region of
Spain
, Sanz-Cortés et al. (2001) also observed subclustering
according to the geographic origin within that region. The clustering
of the cultivars from the same or nearby region suggests a common
genetic base and an autochthonous origin for these cultivars. This
result agrees with the hypothesis of autochthonous origin of most
of the olive cultivars as well as their limited diffusion from their
centres of origin (Barranco and Rallo, 2000; Belaj
et al. 2001; Besnard et al. 2001a). Cultivar
intercrossing and crosses with wild accessions, along with local selection
of outstanding seedlings and subsequent vegetative cloning, could
have led to a large number of varieties around their possible original
areas of cultivation.
References
- ALLEN,
C. Freeman and GOOD, Pearl. Acyl lipids in photosynthetic systems. Methods in Enzymology: Photosynthesis and Nitrogen Part
A, 1971, vol. 23, p. 523-547. [CrossRef]
- ANGIOLILLO,
A.; MENCUCCINI, M. and BALDONI, L. Olive (Olea europaea L.) genetic diversity assessed by amplified fragment length polymorphisms. Theoretical and Applied Genetics, March 1999, vol. 98, no.
3-4, p. 411-421. [CrossRef]
- BALDONI,
L.; PELLEGRINI, M.; MENCUCCINI, M.; MULAS, M. and ANGIOLILLO, A.
Genetic relationships among cultivated and wild olives revealed
by AFLP markers. Acta Horticulturae, January 2000, vol. 521,
no. 11, p. 275-283.
-
BANDELJ,
Dunja; JAKŠE, Jernej and JAVORNIK, Branka. DNA fingerprinting of
olive varieties by microsatellite markers. Food Technology and
Biotechnology, July-September 2002, vol. 40, no. 3, p. 185-190.
- BARRANCO,
Diego and RALLO, Luis. Olive cultivars in
Spain
. HortTechnology, January-March 2000, vol. 10, no. 1, p. 107-110.
- BELAJ,
A.; TRUJILLO, I.; DE LA ROSA ,
R.; RALLO, L. and GIMÉNEZ, M.J. Polymorphism and discriminating
capacity of randomly amplified polymorphic markers in an olive germplasm
bank.Journal of the American Society for Horticultural Science, January 2001, vol. 126, no. 1, p. 64-71.
- BELAJ,
A.; SATOVIC, Z.; CIPRIANI, G.; BALDONI, L.; TESTOLIN, R.; RALLO,
L. and TRUJILLO, I. Comparative study of the discriminating capacity
of RAPD, AFLP and SSR markers and of their effectiveness in establishing
genetic relationships in olive. Theoretical and Applied Genetics, August 2003, vol. 107, no. 4, p. 736-744. [CrossRef]
- BESNARD,
Guillaume; BARADAT, Philippe and BERVILLE, André. Genetic relationships
in the olive (Olea europaea L.) reflect multilocal
selection of cultivars. Theoretical and Applied Genetics, February 2001a, vol. 102, no. 2-3, p. 251-258. [CrossRef]
- BESNARD,
Guillaume; BRETON, Catherine; BARADAT, Philippe; KHADARI, Bouchaib
and BERVILLE, André. Cultivar identification in olive based on RAPD
markers. Journal of the American Society for Horticultural Science,
November 2001b, vol. 126, no. 6, p. 668-675.
- CANTINI,
Claudio; CIMATO, Antonio and SANI, Graziano. Morphological evaluation
of olive germplasm present in
Tuscany
region. Euphytica, October 1999, vol. 109, no. 3, p. 173-181. [CrossRef]
- CARRIERO,
F.; FONTANAZZA, G.; CELLINI, F. and GIORIO, G. Identification of
simple sequence repeats (SSRs) in olive (Olea europaea L.) Theoretical and Applied Genetics, February 2002, vol.
104, no. 2-3, p. 301-307. [CrossRef]
- CIPRIANI,
G.; MARRAZZO, M.T.; MARCONI, R.; CIMATO, A. and TESTOLIN, R. Microsatellite
markers isolated in olive are suitable for individual fingerprinting
and reveal polymorphism within ancient cultivars (Olea europaea L.) Theoretical and Applied Genetics, February 2002, vol.
104, no. 2-3, p. 223-228. [CrossRef]
- CLAROS,
M. Gonzalo; CRESPILLO, Remedios; AGUILAR, Maria L. and CANOVAS,
Francisco M. DNA fingerprinting and classification of geographically
related genotypes of olive-tree (Olea europaea L.) Euphytica, November 2000, vol. 116, no. 2, p. 131-142. [CrossRef]
- FABBRI,
A.; HORMAZA, J.I. and POLITO, V.S. Random amplified polymorphic
DNA analysis of olive (Olea europaea L.) cultivars. Journal of the American Society for Horticultural Science, May 1995, vol. 120, no. 3, p. 538-542.
- GEUNA,
F.; TOSCHI, M. and BASSI, D. The use of AFLP markers for cultivar
identification in apricot. Plant Breeding, December 2003,
vol. 122, no. 6, p. 526-531. [CrossRef]
- GRATI-KAMOUN,
N.; MAHMOUD, F. Lamy; REBAI, A.; GARGOURI, A.; PANAUD, O. and
SAAR
,
A. Genetic diversity of Tunisian olive tree (Olea europaea L.) cultivars assessed by AFLP markers. Genetic Resources and
Crop Evolution, March 2006, vol. 53, no. 2, p. 265-275. [CrossRef]
- HESS,
J.; KADEREIT, J.W. and VARGAS, P. The colonization history of Olea europaea L. in Macaronesia based on internal transcribed
spacer 1 (ITS-1) sequences, randomly amplified polymorphic DNAs
(RAPD), and intersimple sequence repeats (ISSR) Molecular Ecology, July 2000, vol. 9, no. 7, p. 857-868. [CrossRef]
- JACCARD,
P. Nouvelle recherches sur la distribution florale. Bulletin
de
la
Société Vaudoise
des Sciences Naturelles, 1908,
vol. 44, p. 223-270.
- LOUKAS,
M. and KRIMBAS, C.B. History of olive cultivars based on their genetic
distances. Journal of Horticultural Science, 1983, vol. 58,
no. 2, p. 121-127.
- MANTEL,
N. The detection of disease clustering and a generalized regression
approach. Cancer Research, February 1967, vol. 27, no. 2,
p. 209-220.
- MILBOURNE,
Dan; MEYER, Rhonda; BRADSHAW, John E.; BAIRD, Eileen; BONAR, Nicky;
PROVAN, Jim; POWELL, Wayne and WAUGH, Robbie. Comparison of PCR-based
marker systems for the analysis of genetic relationships in cultivated
potato. Molecular Breeding, April 1997, vol.3, no. 2, p.
127-136. [CrossRef]
- NIKOLOUDAKIS,
N.; BANILAS, G.; GAZIS, F.; HATZOPOULOS, P. and METZIDAKIS, J. Discrimination
and genetic diversity among cultivated olives of
Greece
using RAPD markers. Journal of the American Society for Horticultural
Science, September 2003, vol. 128, no. 5, p. 741-746.
- PEJIC, I. ; AJMONE-MARSAN, P.; MORGANTE, M.; KOZUMPLICK,
V.; CASTIGLIONI, P.; TARAMINO, G. and MOTTO, M. Comparative analysis
of genetic similarity among maize inbred lines detected by RFLPs,
RAPDs, SSRs and AFLPs. Theoretical and Applied Genetics, December 1998, vol. 97, no. 8, p. 1248-1255. [CrossRef]
- POWELL,
Wayne
; MORGANTE, Michele;
ANDRE, Chaz; HANAFEY, Michael; VOGEL, Julie; TINGEY, Scott and RAFALSKI,
Antoni. The comparison of RFLP, RAPD, AFLP and SSR (microsatellite)
markers for germplasm analysis. Molecular Breeding, September
1996, vol. 2, no. 3, p. 225-238. [CrossRef]
- RALLO,
P.; DORADO, G. and MARTIN, A. Development of simple sequence repeats
(SSRs) in olive tree (Olea europaea L.) Theoretical
and Applied Genetics, October 2000, vol. 101, no. 5-6, p. 984-989. [CrossRef]
- ROTONDI,
A.; MAGLI, M.; RICCIOLINI, C. and BALDONI, L. Morphological and
molecular analyses for the characterization of a group of Italian
olive cultivars. Euphytica, July 2003, vol. 132, no. 2, p.
129-137. [CrossRef]
- SANZ-CORTÉS,
F.; BADENES, M.L.; PAZ, S.; IÑIGUEZ, A. and LLÁCER, G. Molecular
characterization of olive cultivars using RAPD markers. Journal
of the American Society for Horticultural Science, January 2001,
vol. 126, no.1, p. 7-12.
- SANZ-CORTÉS,
F.; PARFITT, D.E.; ROMERO, C.; STRUSS, D.; LLÁCER, G. and BADENES,
M.L. Intraspecific olive diversity assessed with AFLP. Plant
Breeding, April 2003, vol. 122, no. 2, p. 173-177. [CrossRef]
- SEFC,
K.M.; LOPES, M.S.; MENDONÇA, D.; RODRIGUES DOS SANTOS, M.; DA CAMARA
MACHADO, M. Laimer and DA CAMARA MACHADO, A. Identification of microsatellite
loci in olive (Olea europaea) and their characterisation
in Italian and Iberian olive trees. Molecular Ecology, August
2000, vol. 9, no. 8, p. 1171-1193. [CrossRef]
- SENSI,
E.; VIGNANI, R.; SCALI, M.; MASI, E. and CRESTI, M. DNA fingerprinting
and genetic relatedness among cultivated varieties of Olea europaea L. estimated by AFLP analysis. Scientia Horticulturae, February 2003,
vol. 97, no. 3-4, p. 379-388. [CrossRef]
- VOS,
Pieter; HOGERS, Rene; BLEEKER, Marjo; REIJANS, Martin; VAN DE LEE,
Theo; HORNES, Miranda; FRITERS, Adrie; POT, Jerina; PALEMAN, Johan;
KUIPER, Martin and ZABEAU, Marc. AFLP: A new technique for DNA fingerprinting. Nucleic Acids Research, January 1995, vol. 23, no. 21, p.
4407-4414.
- WIESMAN,
Z.; AVIDAN, N.; LAVEE, S. and QUEBEDEAUX, B. Molecular characterization
of common olive varieties in Israel and the West Bank using randomly
amplified polymorphic DNA (RAPD) markers. Journal of the American
Society for Horticultural Science, September 1998, vol. 123,
no. 5, p. 837-841.
Note: Electronic Journal of Biotechnology is not responsible if on-line references cited on manuscripts are not available any more after the date of publication.
Supported by UNESCO / MIRCEN network
© 2006 by Pontificia Universidad Católica de Valparaíso -- Chile
The following images related to this document are available:
Photo images
[ej06066f2.jpg]
[ej06066f5.jpg]
[ej06066f3.jpg]
[ej06066f1.jpg]
[ej06066f4.jpg]
|
