 |
| About Bioline | All Journals | Testimonials | Membership | News |
|
||||||
|
||||||
Electronic Journal of Biotechnology, Vol. 10, No. 1, Jan 15, 2007, pg. 1-11 RESEARCH ARTICLE Application of statistical experimental methods to optimize medium for exopolymer production by newly isolated Halobacterium sp. SM5 Patcharee Lungmann1 , Wanna Choorit*2, Poonsuk Prasertsan3 1Department
of Industrial Biotechnology,
Faculty of Agro-Industry,
Prince of
Songkla
University,
Hat Yai, Songkhla 90112
Thailand,
Tel: 66 44 611221
Fax: 66 44 612 858
E-mail: plungmann@yahoo.com Financial support: This research was supported by a research grant of Prince of Songkla University. Code Number: ej07001 Abstract The study investigated on medium optimization for production of exopolymer by a newly isolated bacterium, Halobacterium sp. SM5, using the mixture design and response surface method. The mixture experiment was designed by setting five parameters at the lowest and highest of concentrations: pseudo components design containing 0.15-0.25 glucose, 0.15-0.25 yeast extract, 0.35-0.45 MgSO4·7H2O, 0.1-0.2 vitamin casamino acid and 0.02-0.06 KCl. The results of the mixture design revealed that the effect of nutrients or elements on the exopolymer produced by the strain SM5 were in the order of MgSO4·7H2O > yeast extract > vitamin casamino acid > KCl > glucose, respectively. The suitable medium recipe for enhancement the exopolymer production was 7.43 g/l glucose, 12.38 g/l yeast extract, 17.33 g/l MgSO4·7H2O, 9.9 g/l vitamin casamino acid and 2.48 g/l KCl. The exopolymer to be produced by the strain SM5 was 2.25 g/l, which was higher than that obtained in the original medium (1.3 times). The yield of exopolymer was 2.13 g/l to be obtained in medium containing 7.43 g/l glucose, 11.37 g/l yeast extract, 22.28 g/l MgSO4·7H2O, 7.44 g/l vitamin casamino acid and 0.99 g/l KCl which was predicted by response surface methodology. However, under an experiment, the yield of exopolymer was 2.08 ± 0.0020 g/l. Keywords: exopolymer, halophilic bacteria, medium optimization, mixture design, response surface method.
Prokaryotes have the ability to produce exopolymer in the form of capsule or slime. The exopolymer has the rheological property in aqueous system which enhances the viscosity of the solution making it applicable as thickeners, emulsifiers, and suspending agents in food, pharmaceutical and petroleum industries (Llamas et al. 1999; Sleytr et al. 2003; Kumar et al. 2004). Most commercialized exopolymers are derived from eubacteria like, Xanthomonas campestris (xanthan) (Becker et al. 1998; Vendruscolo et al. 2005), Sphingomonas paucimobilis (gellan) (Jin et al. 2003; Lee et al. 2004), Agrobacterium (curdlan) (Saudagar and Singhal, 2004), Aureobasidium pullulans and Kluyveromyces fragilis (pullulan) (Seo et al. 2004), Acetobacter xylinum (cellulose) (Sutherland, 2001; Czaja et al. 2006) and Zymomonas mobilis (levan) (Bekers et al. 2005). Halophilic bacteria have been reported to produce industrially interesting products such as bacteriorhodopsin, enzyme, bioplastic and exopolymer (Aguilar et al. 1998; Ventosa et al. 1998; Hezayen et al. 2000; Margesin and Schinner, 2001; Birbir and Sesal, 2003). The exopolymer from an extremely halophilic bacterium, Halomonas eruihalina exhibits viscous properties at low pH values (Bejar et al. 1998). This property would make it valuable for use in the food industry as an additive in salad sauces or citric desserts, where the pH is usually acidic. Moreover, viscosity of polysaccharides from halophilic bacteria (Bacillus species) displays pseudoplastic behaviour, which is resistant to shear, salt, thermal degradation, and develops a higher viscosity at dilute concentrations (Ventosa et al. 1998; Margesin and Schinner, 2001). These findings on the properties of exopolymer from the halophilic bacteria suggest that production of exopolymers from diverse bacteria would offer a good prospect for industrial application. In the screening process for the exopolymer, one isolated halophilic bacterial strain, SM5, was found to produce an exopolymer containing protein as a major component with sugar, uronic acid, and sulphate as minor components. In addition, the exopolymer has a high molecular weight, acidic charge, is water-soluble, exhibits high viscosity and is able to form a gel in acid solution. These results suggest that the bacterium produce a glycoprotein exopolymer which has potential medical and nanotechnological applications (Margesin and Schinner, 2001). In addition, sulphate polymer can also be applied in the pharmaceutical industry as an antiviral agent (Ying et al. 2002), antitumoral agent (Geresh et al. 2002) and anticoagulant agent (Nardi et al. 2004). In general, media are traditionally optimized by the one-at-a-time strategy, i.e., varying one factor while keeping all others constant. Although this strategy is simple and easy to apply without the need for statistical analysis, it involves a relatively large number of experiments and the interaction among factors is often ignored. In contrast, mixture design, full factorial design, and fractional factorial design are more efficient approaches that can deal with a large number of variables simultaneously. Moreover, the interaction among different variables can be estimated. To date, these techniques have been used by many researchers to optimize medium components,such as astaxanthin production from Phaffia rhodozyma (Ramirez et al. 2001), xylanase from halophilic eubacterium SX15 (Wejse et al. 2003), β-glucanase production from Bacillus subtilis ZJE-1A5 (Tang et al. 2004), clavulanic acid from Streptomyces clavuligerus (Wang et al. 2005), micrococcin GO5 from Micrococcus sp. GO5 (Kim et al. 2006) and xyloketal A from Xylaria sp. 2508 (Xiaobo et al. 2006). The objective of this work was to apply a mixture design followed by a response surface methodology to investigate and optimize a medium (five variables such as glucose, yeast extract, MgSO4·7H2O, vitamin casamino and KCl) which might positively affect exopolymer production by the newly isolated Halobacterium sp. SM5. Isolation of halophilic bacterium Thai traditional fermented fish (Pla-ra), purchased from the market inSongkhla Province , Thailand , was used as a source for the isolation of a halophilic bacterium. A loopful of sample was streaked onto a KS medium (Kamekura and Seno, 1990). The plate was incubated at 37ºC for 15 days. A viscous-looking colony was picked up and purified by streaking method. The purification process was repeated several times until a pure culture was obtained. Medium and cultivation of the halophilic bacterium In order to prepare a starter culture, a loopful of the isolated strain, designated as SM5, was transferred into 100 ml of modified KS medium in a 250 ml Erlenmyer flask and incubated in an orbital shaker (New Brunswick G25-KLG) at 200 rpm at 37ºC until its growth reached the early stationary phase. To prepare the inoculum for exopolymer production, 10% of the starter culture adjusted to a cell concentration (optical density, OD660) of 0.5 was transferred into the fresh medium. Generally, nutrient compositions used for the starter culture preparation and for adjusting the concentration of inoculum were varied according to the media to be investigated (Table 1). The culture was taken every 24 hrs for growth and exopolymer measurements. Growth was determined in terms of turbidity by using a spectrophotometer (Hitachi U-2000) at a wavelength of 660 nm. Composition of the modified KS medium was the same as the KS medium with the exception of the addition of 10 g/l glucose.
After removing the cell pellet by centrifugation, 5 ml of the supernatant was precipitated with 3 volumes of cold ethanol. The precipitated exopolymer was then re-dissolved in distilled water and dialysed against distilled water overnight using the membrane with 10,000 daltons molecular cut-off. The lyophilized exopolymer obtained was measured and calculated as g/l. Medium optimization using mixture design Firstly, 5 components, 10 g/l glucose, 10 g/l yeast extract, 20 g/l MgSO4·7H2O, 7.5 g/l vitamin casamino acid and 2 g/l KCl, of the modified KS medium were selected. The total weight of these 5 components in distilled water was calculated to be 4.95% (w/v). Then each component was calculated into percent of the total (= 4.95) and displayed in decimal fraction. The lowest and highest volume fractions were designed from the calculated results ± 0.05 (Table 2). Finally, the data obtained from Table 2 were entered into the JMP version 3.2.6 program (software of SAS Institute Inc) followed by selecting an extreme vertices design. The pseudo components of five factors (A = glucose, B = yeast extract, C = MgSO4·7H2O, D = vitamin casamino acid and E = KCl) in the ranges from the lowest to highest levels of their volume fractions were obtained. These 30 pseudo components were converted to actual corresponding weights by using percent solids as shown in Table 1. After that the observed responses for the 30 pseudo components and traditional components were determined. First model. The linear model for predicting the optimal point was expressed according to the equation: Y = β1A +β2B +β3C + β4D + β5E [1] Where Y is the predicted response; β1, β2, β3, β4 and β5 are the coefficients estimate, and A, B, C, D and E are the studied factors (Hu, 1999).
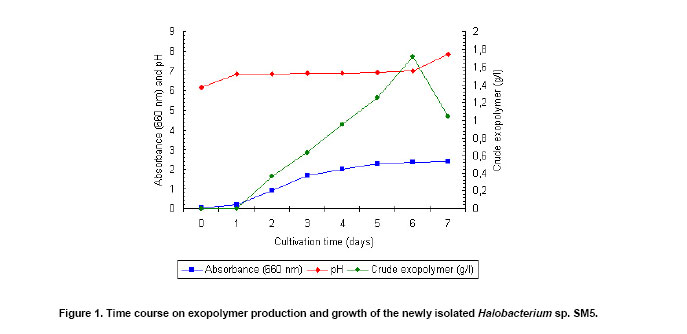
A test for significant sequential models was performed by employing a statistical methodology called an analysis of variance (ANOVA). The response surface methodology (RSM), was also utilized to predict the optimization of medium for exopolymer production. The DESIGN-EXPERT 6.0.1 software was used for the RSM. The production of growth-associated exopolymer from the newly isolated Halobacterium sp. SM5 reached maximum (1.73 g/l) after 6 days cultivation in the modified KS medium (pH 7.0) on a shaker (200 rpm) at 37ºC (Figure 1). The exopolymer obtained from this strain was nearly 6 times higher than that (0.3 g/l) produced by Haloferax mediterranei strain R4 (ATCC 33500) grown in a medium containing a mixture of 25% salts with 1% glucose (Parolis et al. 1996). The yield was similar to the exopolymer from Halomonas eruihalina (1.6 g/l) cultivated in MY medium supplemented with sea-salt solution to reach a 7.5% (w/v) salt concentration (Bejar et al. 1998). For optimization of this product, the mixture design experiment with the observed responses of the 30 formulations and the original point were determined. The results showed that the exopolymer yields varied within the range of 1.22-2.25 g/l (Table 1). The exopolymer production was highest in media formula No. 23 which contained 7.43 g/l glucose, 12.38 g/l yeast extract, 17.33 g/l MgSO4·7H2O, 9.9 g/l vitamin casamino acid and 2.48 g/l KCl while the lowest exopolymer concentration was obtained in formula No. 4 which contained 11.88 g/l glucose, 12.38 g/l yeast extract, 17.33 g/l MgSO4·7H2O, 4.95 g/l vitamin casamino acid and 2.97 g/l KCl. To select an appropriate type of model for the response exopolymer production, the DESIGN-EXPERT software was applied. Sequential F-tests are performed, starting with a linear model and adding terms (quadratic, and higher if appropriate). The F-statistic is calculated for each type of model, and the highest order model with significant terms normally would be chosen. An ANOVA table for sequential model sum of squares is shown in Table 3 . In this table, the linear model is the highest order model with significance terms (Prob > F is less than 0.05); therefore the linear terms should be included in the model whereas the quadratic model is the Prob > F of 0.9977 exceeds 0.05, the quadratic terms should not be included in the model. The linear model was high F value (34.67) as significant (Prob > F is less than 0.0001). Therefore, the linear model was appropriated for the response exopolymer production. This was confirmed by the adjusted R-Squared value (81.78%) (data not shown). The R-Squared value indicates that five components altogether would explain about 81% of the variability in the responses whereas about 19% of the variability in the responses remains unexplained. Due to the results of the ANOVA analysis, multiple linear regression analysis was employed to determine the predicted response (exopolymer yield) function. Table 4 shows the results of the analysis of the pseudo components experiment as follows: The regression coefficient estimates of glucose, yeast extract, MgSO4·7H2O, vitamin casamino acid and KCl were 0.66, 2.11, 2.18, 2.10, and 1.45, respectively. The last two columns of the tables indicated the 95% confidence interval (CI) for the coefficients. These interval ranges mean the true coefficients could be found in the corresponding estimated intervals 95 times out of 100 times of the experiments. Thus, the estimated regression equation for the pseudo components is: Y = 0.66A + 2.11B + 2.18C + 2.10D + 1.45E [2] Finally, the DESIGN-EXPERT program gave the output of the final equation in terms of actual components as follow: Y = -0.069A + 0.067B + 0.063C + 0.066D + 0.011F [3] Where the variables take their coded values, represents exopolymer yield (Y) as a function of glucose (A), yeast extract (B), MgSO4·7H2O (C), vitamin casamino acid (D) and KCl (E) concentrations. In the above equation, glucose has a negative effect on the exopolymer production. This indicates that for every one unit increase in glucose, the exopolymer production will decrease by 0.069 units when other components hold constant. In addition to Table 4, the results from DESIGN-EXPERT program revealed the adjusted components affected to the exopolymer production (Table 5). Obviously, the Prob > |t| was less than 0.01 for glucose, yeast extract, MgSO4·7H2O, and vitamin casamino acid, it can also be concluded that these four components contribute to the model. It can also conclude that KCl did not effect to the exopolymer production as can be seen that it's Prob > |t| is as big as 0.3392.
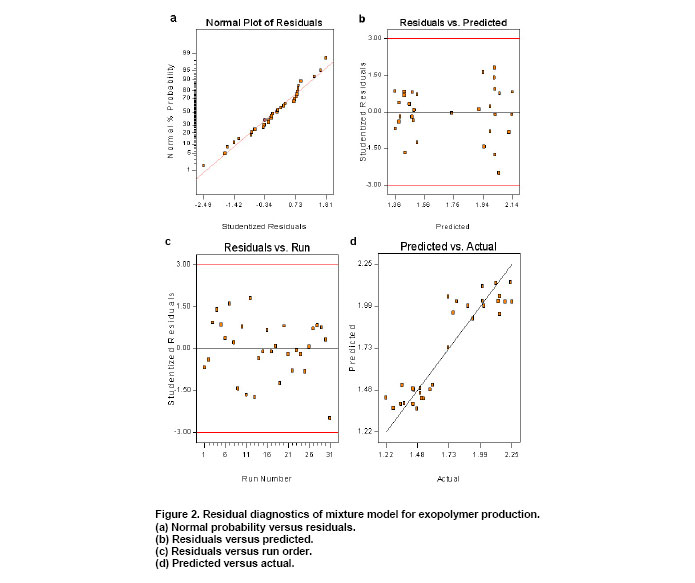
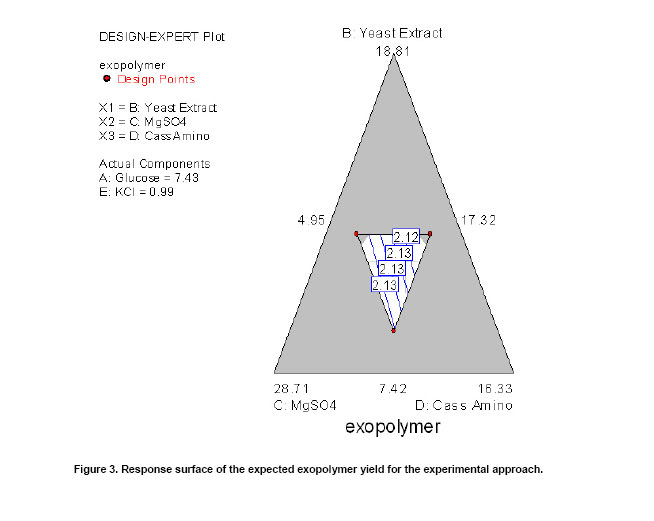
Residual analysis was used to examine the adequacy of the model as shown in Figure 2. The normal probability plot in Figure 2a, which is used to check the violation of normality assumption, revealed no serious violation (i.e. the points line approximately along a straight line). Figure 2b,2c and 2d could be used to detect the constant variance assumption. However, Figure 2c was more appropriated for the current model diagnostics since the experiment involved in the time sequence in which the data were collected (Montgomery et al. 1992). Since the plot in Figure 2c showed a horizontal band, there was no obvious model of defects. Triaxial diagrams are a common mean to express compositions usually employed for obtaining certain exopolymer product. It is a graphic representation of combinations of raw materials, rather than a predictive illustration of product. These numerical results are represented in a triangular graph (Figure 3) which shows the level curves of exopolymer yield as a function of the compositions, obtained from a linear regression. From DX6 program analysis, the 5 experimental points were performed to better identify region of interest and predict higher exopolymer yield (Table 6). It means that the combination of the three components (MgSO4·7H2O, yeast extract, and vitamin casamino acid) lead to higher yield. A high synergetic effect can be observed in the central area of this graph. This time, a constrained area inside the previous experimental region was analysed. Another series of real compositions were used, namely the lowest component for glucose and KCl, 10.01-11.37 (g/l) for yeast extract, 21.17-22.28 (g/l) for MgSO4·7H2O, 7.44-9.90 (g/l) for vitamin casamino acid correspond, approximately, to the maximum of yield. In this case, the predicted maximum value of exopolymer was around 2.13 g/l whereas the actual experiment gave the maximum exopolymer yield of about 2.08 ± 0.0020 g/l from using the medium containing 7.43 g/l glucose, 11.37 g/l yeast extract, 22.28 g/l MgSO4·7H2O, 7.44 g/l vitamin casamino acid and 0.99 g/l KCl (Table 6).
Medium composition can significantly affect the production of exopolymer as observed in this study. Xu et al. (2003) used one-factor-at-a time and orthogonal matrix method for optimizing exo-biopolymer produced by Paecilomyces tenuipes C240. The exopolymer 1.89 g/l was produced in the medium containing 3 g/l glucose, 0.4 g/l KNO3, 0.1 g/l K2HPO4, and 0.1 g/l MgSO4·7H2O in shake flask. Shih et al. (2002) used the central composite design for optimizing poly (γ-glutamic acid) (γ-PGA) produced by Bacillus licheniformis. The model predicted the highest γ-PGA of 19.80 ± 1.59 g/l obtained in the medium containing 24.50 g/l citric acid, 57.30 g/l glutamic acid and 157.11 g/l glycerol. Grothe et al. (1999) used central composite experimental design for optimizing poly (β- hydroxybutyric acid) (PHB) produced by Alcaligenes latus. The poly PHB 2.97 g/l was produced in the optimized medium containing 20 g/l sucrose and 1.5 g/l ammonium sulfate, which was 1.8 fold greater than the yield in the screening experiment. Rao et al. (2000) used 25-1 fractional central composition design for optimizing hirudin produced by Saccharomyces cerivisiae. The hirudin 65.3 mg/l was produced in the optimized medium containing 16 g/l yeast extract, which was 35% higher than the unoptimized medium. Hsieh et al. (2005) used RSM for optimizing polysaccharide produced by Cordyceps sinensis. The maximum polysaccharide of 3.17 g/l was predicted from the regression model of RSM in the medium containing 6.17% sucrose, 0.53% corn steep powder, 0.5% (NH4)2HPO4 and 0.15% KH2PO4. When applying this optimal medium, the maximum polysaccharide production was 3.05 and 3.21 g/l in a shake flask and a 2-l jar fermentor, respectively. Cui et al. (2006) used a three-level Box-Behnken factorial design for optimizing mycelial biomass and exopolymer produced by Grifola frondosa GF 9801. The model estimated that, a maximal yield of mycelia biomass (17.61 g/l) could be obtained when the concentrations of glucose, KH2PO4, peptone were set at 45.2 g/l, 2.97 g/l, 6.58 g/l, respectively; while a maximal exopolymer yield (1.326 g/l) could be achieved when setting concentrations of glucose, KH2PO4, peptone at 58.6 g/l, 4.06 g/l and 3.79 g/l, respectively. From the survey of literature, it can be seen that the application of statistical experimental design techniques in fermentation process development can result in improved product yield, reduced process variability, closer confirmation of the output response (product yield or productivity) in relation to nominal and target requirements, and reduced development time overall costs. The data obtained from our experiments demonstrated the strategies for enhancing exopolymer and analysing the factors that affected exopolymer production by Halobacterium sp. SM5. The medium No. 23 formulated by mixture design was superior to other media in terms of original compositions for enhancing exopolymer production. The results of linear model for mixture design experiments showed that the yeast extract, MgSO4·7H2O and vitamin casamino acid gave positive effect while glucose gave negative effect for exopolymer production. The KCl exhibited no effect on exopolymer production. Therefore, the yeast extract, MgSO4·7H2O and vitamin casamino acid were chosen for the response surface design to enhance yield of exopolymer.
Note: Electronic Journal of Biotechnology is not responsible if on-line references
cited on manuscripts are not available any more after the date of publication. © 2007 by Pontificia Universidad Católica de Valparaíso -- Chile The following images related to this document are available:Photo images[ej07001f1.jpg] [ej07001f3.jpg] [ej07001f2.jpg] |
| |||||||||
