 |
| About Bioline | All Journals | Testimonials | Membership | News |
|
||||||
|
||||||
Electronic Journal of Biotechnology, Vol. 10, No. 1, Jan 15, 2007, pg. 1-11 RESEARCH ARTICLE DNA removal from a purification process of recombinant hepatitis B surface antigen Alejandro Beldarraín Iznaga*1 , Mayda Candelario Frontera2 , Javier Rodríguez Uramis3 , José Blas Tejera González4 , Yodelis Calvo Parra5 , Yoel Madruga González6 1Planta
de Producción,
Centro de Ingeniería Genética y Biotecnología ,
P.O. Box 6162,
Habana 10600, Cuba,
Tel: 537 2716022. Ext. 2119
Fax: 537 2713208
E-mail: alejandro.beldarrain@cigb.edu.cu *Corresponding author Financial support: This research was supported by CIGB grants. Code Number: ej07004 Abstract We studied the capacity of an API-rHBsAg purification process to eliminate DNA contamination from yeast-host cell. Firstly, was demonstrated consistency of manufacturing purification process to remove DNA, from (3.9 ± 1.9)108 pg/dose in starting material to (3.4 ± 1.6) pg/dose, equivalent to 8.2 log in Active Pharmaceutical Ingredient (API), measuring DNA quantity in several unit operations along manufacturing process for twenty batches, five consecutive in 2000, 2001, 2003 and 2005. These values for API, lower than 10 pg/dose, accomplish current WHO requirements for Hepatitis B vaccines obtaining by recombinant DNA technology (WHO, 1989; European Pharmacopoeia, 2001a). The main removal factor for manufacturing process, equivalent to 6.4-log, was reached in negative anion-exchange chromatography. Then, the capacity of immunoaffinity chromatography and positive anion-exchange chromatography to remove chromosomal DNA purified from yeast-host cell was assessed using a scaled-down chromatographic process which was shown to yield product meeting purity criteria set for the manufacturing process. Log10 reductions for DNA through the immunoaffinity chromatography and positive anion-exchange chromatography were 7.3 ± 0.1, and 5.8 ± 0.1 respectively. Overall, these studies indicate that total DNA clearance factor for API-rHBsAg manufacturing process was 19.4 log, 2.4 times higher than the real DNA contamination, indicating that API-rHBsAg manufacturing as described here have sufficient DNA reducing capacity to achieved a high margin of DNA safety. Keywords: DNA-clearance factor, process characterization, rHBsAg purification process, spiking experiments. Regulatory agencies states that each unit operation of a cGMP manufacturing process must be controlled to maximize the probability that the finished product meets all quality and design specifications. Biopharmaceutical manufacturers must ensure that their products are free from impurities like nucleic acids, viral particles, in-process intermediate, endotoxins, and host cell proteins. It is generally recognized that downstream processing operations used in purifying and manufacturing a biopharmaceutical product must be validated. The ability of the processing operations to remove specific substances must be demonstrated and in some cases, the ability to effectively and consistently remove a contaminant may be demonstrated by direct measurements of material sampled from actual process, if analytical methods have sufficient precision and sensitivity (ICH, 1999). DNA considered as cellular contaminant rather than risk factor which required removal to extremely low level and in biopharmaceutical productions, the principal source is host cell DNA. Fermentations feed streams can contain large quantities of nucleic acids that can be removed during purification process by passing a feed stream through chromatography resins. In this regard, regulatory authorities state that level of DNA from the host cell can be detected by direct analysis on the product considering that levels of 10-100 pg of residual DNA of host cell origin per dose of a parenterally administered biopharmaceutical is considered to be an acceptably safe level by most of the medicinal agencies (FDA, 1985; Griffiths, 1997; Trouvin, 1997). Nevertheless, in general guidelines for recombinant proteins, there is no precise specification of what an acceptable or tolerable level of contaminating DNA might be, but recommendations are given in some specific monographies as for recombinant hepatitis B vaccine (WHO, 1989; European Pharmacopoeia, 2001a; European Pharmacopoeia, 2001b). Moreover, it has been recently recommended that batch to batch testing should be performed to determine DNA content in biological products produced in cell lines, while the elimination of bacterial or yeast DNA may be validated and does not have to be checked routinely (Trouvin, 1997). Regulatory authorities challenge manufacturers to reduce the amount of residual DNA in particular in ''well-characterized'' biopharmaceutical products combining determination of DNA amount in the final product, calculation of clearance factor for each unit operation and demonstration of DNA removal in purification process by clearance experiments with spiked DNA (FDA; European Medicines Evaluation Agency (EMEA) or the World Health Organization (WHO)). The Center for Genetic Engineering and Biotechnology produces since 1990s an API for a yeast-derived vaccine providing protection against Hepatitis B infection and commercialized under trade mark HEBERBIOVAC HB (Pentón et al. 1992). The downstream process for rHBsAg purification, which includes several chromatographic operations, is potentially effective to remove DNA contamination and it has proven to be safe and efficacious (Pérez et al. 1994; Hardy et al. 2000). However, the effectiveness of manufacturing process to remove DNA contamination has not been studied yet. This study describes the assessment of the DNA removal capacity of an API-rHBsAg manufacturing process combining direct DNA stepwise measurements along downstream purification stream with spiking experiments of two chromatographic separations. Finally, total clearance factor was calculated, demonstrating the high degree of security for an API-rHBsAg purification process to remove DNA burden. Nylon
Hybond-N filter, ATP 32 and X-ray the films were supplied by Amersham
(Arlington Heights
,
All biological samples were taken after cellular disruption from yeast derived API-rHBsAg manufacturing process. Buffers were prepared according to manufacturing SOPs. DNA determination by staining with ethidium bromide in agarose gel. DNA determinations by ethidium bromide (Boheringer Mannheim , Belgium ) were carried out in agarose gels type I at 0.8%. Five microlitre of samples were always applied to gels and results visualized in a UV-transilluminator, were compared with a curve (500 ng, 200 ng, 100 ng, 50 ng) of well-known DNA concentrations from yeast (Sambrook et al. 1989). Samples from Acid Precipitation (AP), primary purification material (PP) for manufacturing process, and starting materials and washing for spiking experiments, were analyzed by this method. DNA determination by dot-blot hybridization. Hybridization, which use probe too specific to measure total DNA, can detect DNA at the picogram level (Eaton, 1989; Per et al. 1993, DiPaolo et al. 1999). Specifically, we use a radioactivity probe with αdATP32 to quantify residual DNA from P. pastoris host, developed and validated to API-rHBsAg manufacturing process in correspondence to current regulations (Candelario and Calvo, 1999). A standard curve was prepared with DNA from host cell, P. pastoris in 1/2 serial dilutions from 250 pg to 1.9 pg. Usually 100 µg of problem samples, reference material for API-rHBsAg and negative control, BSA fraction V, were always assayed. DNA curve, samples and controls were heated at 95ºC by 5 min and applied to a Nylon Hybond N filter (Amersham Bioscience, USA), pre-wetted in 10X SSC, using a Manifold (Biorad, USA). The filters were submerged in a denaturizing solution ( 0.5 M NaOH, 1.5M NaCl) for 5 min and then, in a neutralizing solution ( 0.5 M Tris-HCl, 1.5 M NaCl) during 5 min. Then, filter was dried at 80ºC during 10 min. DNA was fixed on filters by exposition at 254 nm during 3 min. Filters were pre-hydridized in bottle containing pre-hybridization solution (6X SSC, 50% Formamide, 5X Denhardt, 0.5% SDS and 100 µg/ml tRNA) for 2 hrs at 42ºC . Hybridization was performed in a solution of 6X SSC, 50% Formamide and 0.5% SDS, using a probe plasmid digested pRSP3 EcoRI, which contains a repetitive sequence of yeast DNA. The membranes were incubated at 42ºC during 16 hrs; washed twice during 15 min at 42ºC with 2X SSC, 0.1% SDS and then with 0.2X SSC, 0.1% SDS. Results were obtained after X-ray exposition at -70ºC during 3 days and comparing signal intensities of problem sample with DNA curve. Samples from Negative Anion-Exchange chromatography (NAE), Immunoaffinity chromatography (IAF); Desalting by gel filtration chromatography (DS); Positive Anion-exchange chromatography (PAE); Concentration-diafiltration by tangential flow filtration (C-D); Gel filtration chromatography by High Performance Liquid Chromatography (GF) and Active pharmaceutical ingredient (API) for manufacturing process and eluted fractions from spiking experiments, were analyzed by using this method. Other
biochemical assays. The HBsAg concentration was measured by an
enzyme-linked immunosorbent assay (ELISA) system (González et al.
1993) or by UV absorbance at 280 nm using an adsorption coefficient
(1 mg/ml) of 5. Carbohydrates were determined by anthrone method according
to Carney (1986), lipids according to Woodman
and Price (1972). The concentration of mouse IgG was determined
by a sandwich ELISA using a commercial (Sigma,St.
Louis
,
Chromosomal DNA was purified according to procedure described elsewhere (Sambrook et al. 1989). 50 ml of YPG culture (yeast extract 5 mg/ml, bacteriological peptone 10 mg/ml and glucose 2%) was inoculated with a yeast colony of P. pastoris and grown at 28ºC during 24 hrs. Then, the broth was centrifuged at 8000 g during 5 min. Precipitate was resuspended in 10 ml EDTA 50 mM pH 8 and centrifuged again at 8000 g during 5 min. After that, cellular sediment was resuspended in 10 ml of purified and 1-ml of EDTA 500 mM , pH 9.5 and 250 µL of β-mercaptoethanol was added. The broth was centrifuged at 6700 g during 10 min and cell sediment resuspended in 10 ml Sorbitol 1 M , EDTA 100 mM , pH 7.5. 100-µg/ml of zymolase was added and broth incubated during 1 hr at 37ºC . After centrifugation at 4000 g during 15 min cellular sediment was resuspended in 10 ml Sorbitol 1 M , EDTA 100 mM , pH 7.5 and then centrifuged at 4000 g during 15 min at room temperature. Pellet was resuspended in 10 ml NaCl 0.14 M , EDTA 1 mM pH 7.5 and 500 µl of SDS at 20% was added. After a phenol treatment, 10 ml chloroform-isoamilalcohol 24:1 was added to upper phase. After 10 min of centrifugation at 8000 g , aqueous phase was precipitated adding 20 ml of cold absolute ethanol. The white precipitate was extracted with a plastic stick and resuspended in 1 ml of purified water. This material was treated with RNAase at 50 µg/ml and after phenol-chloroform treatment was precipitated again with cold absolute ethanol. Finally, white precipitate was extracted with a plastic stick and resuspended in 1 ml of purified water. Concentration of purified yeast- DNA, diluted in purified water, was calculated according to equation: [DNA] = Abs260nm x Factor x Dilution [1]
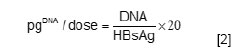
where: [DNA], DNA concentration in μg/ml; Factor = 50 µg/ml. Pure and nodegradated fractions with 7 mg/ml approximately were obtained free of proteins, solvent and RNA contaminant, measuring absorbance radio at 260 nm to 280, 270, 230 and 320 nm respectively (Laws and Adams, 1996). Molecular integrity and absence of tRNA was verified by agarose gel electrophoresis at 0.8%. Only one band was observed (results not shown). The laboratory scale systems for DNA-clearance studies were performed at 0.1% of manufacturing scale, using well-known principles of chromatography scale-down and varying columns diameters, process volumes, and volumetric flow rates (Sofer, 1996; Sofer and Hagel, 1997; Rathore et al. 2005). For immunoaffinity chromatography, experimental conditions were adjusted to maintain constant initial protein load per millilitre of gel and optimal diffusion time in correspondence to manufacturing scale; approximately 2 hrs (Pérez et al. 1994, Hernández et al. 2005). For Ion-exchange chromatography were maintained constant initial protein load, 1 mg per ml packed matrix, and lineal flow at 35.4 cm/h (Pérez et al. 1994). Five runs were performed on the scale down systems with and without DNA. Process outputs of chromatographic profile, product yield, contaminants and product purity were compared to manufacturing-scale systems values. Chromatographic runs were performed according to manufacturing procedures (Pérez et al. 1994). DNA removal by immunoaffinity chromatography was determined by spiking approx. 5.5 mg rHBsAg with 6 mg purified DNA, equivalent to 2.2 x 10⁷ pg/dose. Samples were applied to a 20 ml of immunoaffinity matrix (CIGB,Havana , Cuba ) packed into a XK16/40 (Amersham Bioscience , USA ). Binding buffer was 20 mM Tris/HCl, 3 mM EDTA, 1 M NaCl, pH 7.2. The chromatography was run at 16 ml/h flow rate. Elution buffer was 20 mM Tris/HCl, 3 mM EDTA, 1 M NaCl, 3 M KSCN, pH 7.2. After elution, samples for analysis were desalted by using 100 ml of G- 25 M matrix (Amersham Bioscience , USA ) packed into a XK26/40 column (Amersham Bioscience , USA ). Desalting chromatography was run at 150 ml/min in 20 mM Tris/HCl, 3 mM EDTA, 1 M NaCl, pH 7.2. For ion-exchange chromatography, 18 mg rHBsAg was spiked with 1 mg purified DNA, equivalent to 1.1 x 10⁶ pg/dose, and applied to a 25 ml-DE-52 matrix (Whatman, England) packed into a XK26/40 (Amersham Bioscience, USA). Binding buffer was 20 mM Tris/HCl, 3 mM EDTA, pH 7.2. The chromatography was run at 190 ml/h flow rate. After 1-column volume washing with 20 mM Tris/HCl, 3 mM EDTA, 50 mM NaCl, pH 7.2, the rHBsAg was eluted with 20 mM Tris/HCl, 3 mM EDTA, 400 mM NaCl, pH 7.2. Samples were taken for analysis without previous preparation. After each chromatographic run, the column was regenerated with 150 ml of 0.5 M NaOH during at least 12 hours and then reequilibrated with binding buffer. For further comparison, DNA quantities were expressed in picogram per adult dose of 20 µg rHBsAg according to:
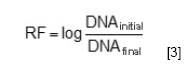
where DNA and rHBsAg represents it respective quantity. The DNA log10 reduction factor (RF) was calculated individually for each operation according to:
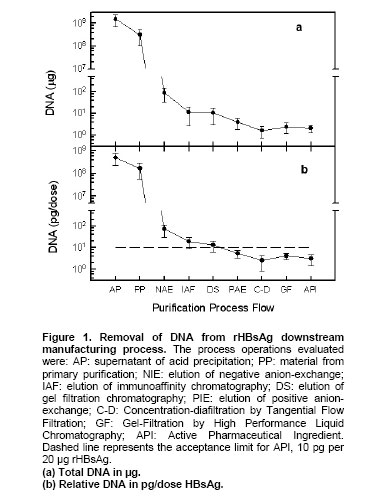
where DNAinitial is the starting DNA quantity in pg/dose and DNAfinal is output DNA quantity after performing purification operation. The total DNA reduction factor was calculated as a sum of the individual log reduction factor. Initially, we investigate DNA removal in manufacturing purification process of API-rHBsAg taking into account the potential ability of some operations to eliminate DNA contamination (Pérez et al. 1994). Figure 1 and Table 1, shown the results obtained during DNA-testing for twenty manufacturing batches, 5 consecutive released in 2000, 2001, 2003 and 2005.
After fermentation process and cellular disruption of yeast broth, the first downstream purification operation is an acid precipitation by adding HCl (Pentón et al. 1992). After acid precipitation (AP), DNA quantity is very high, (1.5 ± 0.81) x 109 µg, equivalent to (5.1 ± 2.7) x 108 pg/dose. These values can be reasonable in correspondence to a hundred kilograms of biomass processed during manufacturing fermentation process (Hardy et al. 2000). Significant DNA quantities should be removed after acid precipitation, however, the high viscosity in starting material from cellular disruption impossibilities precise DNA quantification. Nevertheless, values obtained from DNA determination in acid precipitation, equivalent to 8.7 log, could be considered as target DNA contamination to remove in downstream purification process (Figure 1 and Table 1). The next step evaluated was a sequence of manufacturing operations called primary purification (PP), that include an ion-interaction with a diatomaceous earth matrix, tangential flow filtration to reduce volume by concentration and centrifugation (Penton et al. 1992). In these operations DNA quantity decrease to (3.1 ± 2.1) x 108 µg, equivalent to (1.7 ± 1.1) x 108 pg/dose, which are not significant comparing these values to previous operation (Figure 2 and Table 2). In principle, these results were expected due primary purification is designed to eliminate carbohydrate, host proteins and lipids contamination basically from process stream and increased HBsAg purity (Hardy et al. 2000). After primary purification we start to operate with chromatographic resins and detect DNA level by dot-blot hybridization expecting significant DNA removal to microgram levels.
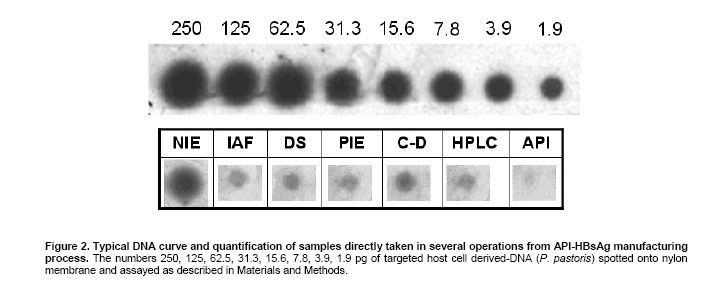
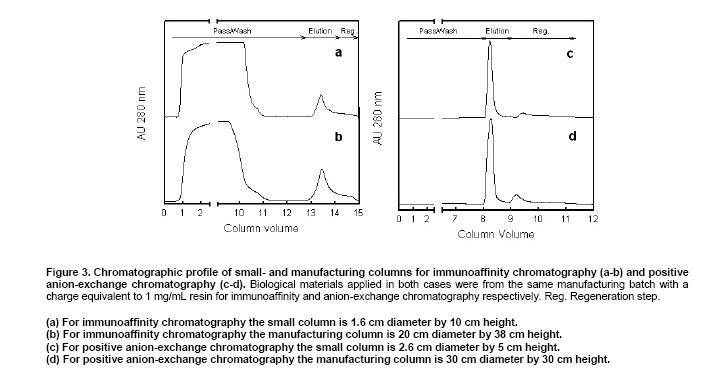
Multiple assays have been developed to quantify low DNA impurities in biopharmaceuticals (Workman, 1995) such as DNA probe hybridization techniques involving radioactive (Eaton, 1989; Kuroda et al. 1988; Yoneyama et al. 1989), biotinylated or otherwise modified probes, enhanced chemiluminescence, ECL (DiPaolo et al. 1999), PCR (polymerase chain reaction) and the total DNA Threshold assay (Per et al. 1993). Because DNA levels and matrix conditions vary during purification, residual DNA analysis in biopharmaceuticals can be very difficult and the methods have to be carefully validated before use. For manufacturing proposes, DNA is usually determined by DNA dot-blot hybridization methods or by a commercially available Threshold system. The hybridization methods are sensitive and specific but time consuming and difficult to validate. The Threshold Total DNA Assay is very sensitive and much easier to use. In contrast to the hybridization methods, it is not sequence specific. The hybridization method developed at CIGB for determination of DNA traces in manufacturing process of API-HBsAg is very specific for ours proposes, with very low detection limit, validated according to current regulations (Candelario and Calvo, 1999) and approved for WHO authorities (http://www.who.int/immunization_standards/en/). A typical radiogram obtained using the dot blot methods is shown in Figure 2. It clearly showed the elimination of residual DNA during chromatographic purification process of API-HBsAg. The first chromatographic purification operation is a negative ion-exchange chromatography by using an anion matrix, DE-52 (Whatman, UK) where DNA removal is very significant, decreasing from (3.1 ± 2.1) x 108 µg in PP to 88.4 ± 56.5 µg, equivalent to 70.1 ± 39.3 pg/dose. Resulting values equivalent to 1.9-log demonstrate the efficiency of DE-52 resin to eliminate DNA, reaching a removal factor quite high, 6.4 log (see NAE inFigure 1 and Table 1). Anionic exchangers are very effective in binding DNA, because the highly charged DNA can bind to an anion exchange at ionic strengths at which proteins don't usually bind (Ng and Mitra, 1994; Sofer and Hagel, 1997). For this reason, the anionic-exchanges resins are considered as a good first purification step where the high content of DNA can increase the viscosity and decrease the efficiency of chromatographic column (Janson and Rydén, 1998). For these resins, cleaning factors equivalent to 3-6 log have been reported (Ng and Mitra, 1994; Sofer and Hagel, 1997; Sadana, 1998, Lightfoot and Moscariello, 2004). The next chromatographic operation is an immunoaffinity chromatography (IAF) where DNA contamination still decreases to 11.3 ± 8.8 µg, equivalent to 19.38 ± 10.52 pg/dose. These values equivalent to 1.3 log, represent 30.2% of incoming DNA. Immunoaffinity chromatography like anion-exchange chromatography has been reported as a very effective to remove DNA (Ng and Mitra, 1994). In principle, we expect more DNA removal percentage; even reach consistently specification value for API, 10 pg/dose, although variation of rHBsAg quantity in production batches, relative low quantity of DNA in purified material or detection limit for DNA assay, can be have significant influence in these results. After immunoaffinity chromatography, the material is desalted by gel filtration chromatography (DS) and practically no DNA removal effect was detected due basically to low resolution of chromatographic matrix used, Sephadex G-25M (Table 1 and Figure 1). No significant removal was apparent in positive anion-exchange chromatography (PAE) where DNA quantity decreases to 3.84 ± 2.04 µg, representing only 34.1% of incoming DNA. However, eluted material reaches consistently specification for API, 5.5 ± 2.2 pg/dose (Table 1 and Figure 1). The last three operations, concentration-diafiltration (C-D), gel filtration by High Performance Liquid Chromatography (GF) and final desalting gel filtration chromatography to conform the Active Pharmaceutical Ingredient (API), conserve DNA quantity lower than the current specification (Table 1 and Figure 1). DNA mass remain close to 2 µg with no significant difference. However, because concentration of rHBsAg in C-D is 3-10 times higher that the final two purification operations, GF and API, and DNA quantification is performed in the lower detection range of curve, we observe a lightly decreasing when DNA content is expressed as a radio per dose. DNA quantity for final material, API, is 3.13 ± 1.46 pg/dose, lower than maximum allowable value according to WHO regulations (WHO, 1989; European Pharmacopoeia, 2001a). These results, beside fulfils a regulatory requirement, demonstrate the high effectiveness and consistency for API-purification process to eliminate DNA contamination from (5.01 ± 2.72)108 pg/dose to 3.13 ± 1.46 pg/dose in API. Despite previous results, the question related to real potentiality of API-rHBsAg purification process to remove DNA contamination has not been fully addressed so far. Considering that 106-107 pg/dose of DNA in starting material as a worst case, that correspond to those quantities before chromatographic purification, we performed spiking experiments at laboratory scale scaling down manufacturing operation for immunoaffinity and positive anion-exchange chromatography. Qualification of scaled-down model for immunoaffinity and positive anion-exchange chromatography. The general approach towards qualification of a scale-down model is to run all operational parameters (inputs) at the centre of the operating range used at large scale (manufacturing production). The performance parameters (outputs) should be similar across scales (Sofer, 1996; Rathore et al. 2005). Taken into account previous consideration, we evaluate the comparability of the model by examining product elution profiles, at small and manufacturing scale, by analysis of chromatographic profiles and quality of purified material. A typical chromatogram for immunoaffinity chromatography for both scales is shown in Figure 3, left. The feed load solution containing buffer and biological materials is compatible for loading the column, which is pre-equilibrated in buffer of similar composition (Material and Methods). Chromatographic resin is loaded at low flow rate (8 cm/h) with approximately 9 columns volumes of load. In correspondence to an immunoaffinity chromatography process, a high signal is observed corresponding to unbound material. The load is immediately followed with a wash buffer with approximately 3 column volumes and then the HBsAg elutes as a single peak collected from the stat of UV rise for 1.5 column volumes. The column is then regenerated by changing pH from basic to acidic solution before to re equilibration for next load. As is shown in Figure 2, left in both scales chromatographic profile are very similar and as would be expected unit operation provides excellent removal of host-cell impurities, including DNA with high HBsAg purity with no significant differences (Table 2). A typical chromatographic separation for positive anion-exchange chromatography in both scales is shown in Figure 3, right. All biological material is bounded to chromatographic resin at moderate flow rate (approx. 36 cm/h) with approximately 4 columns volumes. The load is immediately followed with a wash buffer with approximately 3 column volumes and then the HBsAg elutes as a single peak collected from the stat of UV rise for 1 column volume. The column is then cleaned and regenerated using a concentrated solution of KSCN and 0.5 M NaOH and stored in diluted ethanol between runs for microbiological control. As is shown in Figure 2, right in both scales chromatographic profile is the same and small-scale data are within the full scale range (Table 2). These results suggest that current manufacturing scale immunoaffinity and positive anion-exchange process for purification of API-HBsAg, can be successfully scaled down with eluted product purity and yield comparable to samples manufactured at production scale. Therefore, the scales down models described were carried out as the basic for DNA-spiking experiment. DNA removal in small scale spiking experiments for immunoaffinity and positive anion-exchange chromatography. To determine the DNA removing capacity of the immunoaffinity and positive anion-exchange chromatography, spiking experiments were carried out at reduced scale under conditions equivalent to those used in the full-scale manufacturing process. In both cases, the resulting chromatogram and product recovery were consistent to those seen in the full-scale manufacturing process and small scale process without contaminant (Figure 2). For immunoaffinity chromatography, the starting material with 2.2 ± 0.5 x 10⁷ pg/dose of DNA (7.3 ± 0.1 log) was applied onto the column (Table 3). DNA is largely removed during load and washing steps, consistent with an affinity chromatographic process, removing more than 99% of DNA contamination, equivalent to 8.1 ± 0.2 log. Eluted material with a highly pure rHBsAg, contain 1.1 ± 0 pg/dose DNA, less than 0.1 log detected by dot-blot hybridization assay, indicating that clearance factor for immunoaffinity chromatography is 7.3 ± 0.1 log (Table 3). Similar results for different contamination have been reported previously, where affinity matrices demonstrate high purification capacity, eliminating large quantities of impurities or contaminant, including DNA (Ng and Mitra, 1994; Rhemrev-Boom et al. 2001; Weller, 2000; Subramaian, 2002; Kelly et al. 2004; Lightfoot and Moscariello, 2004). These results beside fulfill DNA specification for API-HBsAg in correspondence to current regulations (WHO, 1989; European Pharmacopoeia, 2001a).
For positive anion-exchange chromatography, the starting material with 1.1 x 10⁶ pg/dose, equivalent to 6 log DNA, was applied onto the column and all biological material is bounded to chromatographic resin (Table 3). During washing, increasing NaCl concentration to 50 mM , very low quantity of DNA elutes from the column and due rHBsAg absorbance was close to zero; DNA quantity per dose of rHBsAg was not calculated. After elution, highly pure rHBsAg was obtained with low DNA contamination (1.8 ± 0.3 pg/dose, equivalent to 0.3 ± 0.1 log), detected by dot-blot hybridization assay. These results beside fulfil DNA specification according to current regulations, indicate that clearance factor for anion-exchange chromatography is 5.7 ± 0.1 log, which are in correspondence with our previous observation (see above) and other reports where the potentiality of ionic exchange resin to eliminate DNA has been demonstrated (Dasarathy, 1996; Sofer and Hagel, 1997; Sadana, 1998; Rathore et al. 2003; Lightfoot and Moscariello, 2004). DNA completely elutes during cleaning operation with 0.5 M NaOH for 12 hrs at least, consistent with previous reports where combination of sodium chloride and sodium hydroxide were used for 100% DNA cleaning from ion-exchange resin (Dasarathy, 1996; Sofer and Hagel, 1997). In summary, total DNA-reduction factor for API-rHBsAg purification process is 19.4 log, corresponding to 6.4 log for negative-anion exchange chromatography, 6.2 log for immunoaffinity chromatography and 5.7 for positive-anion exchange chromatography. This value is 2.4 times higher than the real DNA quantity to be removed form API-HBsAg process stream, 8.2 log (see above), demonstrating a high degree of security for manufacturing process. Although, our study has been limited to three chromatographic operations, there are, at least, two other that may remove DNA contamination, concentration-diafiltration by tangential flow filtration (C-D) and gel filtration by HPLC. However, these were not evaluated because satisfactory results were achieved. The efficiency and consistency of a biopharmaceuticals purification process determines drug quality, including which specific types and concentrations of process contaminants may remain. From regulatory point of view, we achieved an essential requirement for API-rHBsAg to conform the commercial vaccine HEBERBIOVAC HB, demonstrating the robustness of manufacturing process to remove DNA in correspondence to current regulations (WHO, 1989; European Pharmacopoeia, 2001a). Results reported in this study are supported for more than 150 million dose released from 1992 up to date without any adverse event reported. We thank colleagues from the Hepatitis B, In-Process Control and Quality Control Departments at CIGB for their technical assistance.
Note: Electronic Journal of Biotechnology is not responsible if on-line references
cited on manuscripts are not available any more after the date of publication. © 2007 by Pontificia Universidad Católica de Valparaíso -- Chile The following images related to this document are available:Photo images[ej07004f2.jpg] [ej07004f3.jpg] [ej07004f1.jpg] | |||||||||||||||||||||||||||||||||||||||||||||||||||||||||||||||||||||||||||||||||||||||||||||||||||||||||||||||||||||||||||||||||||||||||||||||||||||||||||||||||||||||||||||||||||||||||||||||||||||||||||||||||||
| |||||||||
