 |
| About Bioline | All Journals | Testimonials | Membership | News |
|
||||||
|
||||||
Electronic Journal of Biotechnology, Vol. 10, No. 3, July 15, 2007, pg. 400-408 RESEARCH ARTICLE Extraction of bulk DNA from Raj Kumar Gothwal1, Vinod Kumar Nigam2 , M. Krishna Mohan3 , Dinakar Sasmal4 , Purnendu Ghosh*5 1Birla Institute of Scientific Research Statue Circle,
Jaipur-302 001 *Corresponding author Financial support: This work was carried out as in house project. Code Number: ej07038 AbstractA reliable method for characterizing microbial communities on the basis of their differences in the 16S ribosomal RNA (rRNA) gene sequences in the hot arid zone sandy soils has been optimized. A desert plant (Calligonum polygonoides) was chosen to provide the rhizospheric soil samples, collected from three different agro-ecological locations. Total community DNA was efficiently extracted at small-scale level using direct lysis with hot sodium dodecyl sulphate (SDS), glass bead beating and finally subjecting the sandy soil to liquid nitrogen freeze-thaw cycles. To amplify V3 region of bacterial 16S rRNA gene, universal conserved primers were used. Second round polymerase chain reaction (PCR) was attempted to increase product concentration and to minimize the effect of inhibitory substances. To enhance the detection sensitivity of the denaturing gradient gel electrophoresis (DGGE), the effect of change in template DNA concentration was studied. The separation of bands were greatly enhanced in the fingerprints obtained after the second round of PCR representing low abundant species which were not differentiated at single optimized concentration of DNA. Keywords: arid soils, microbial community, PCR-DGGE, rhizosphere, soil DNA extraction. Abbreviations: DGGE: denaturing gradient gel electrophoresis Although, a wealth of information is available about many microorganisms isolated from soil by culturing techniques, the nature of a substantial part of the soil microbiota is essentially unknown due to their unculturability (van Elsas and Smalla, 1995). Introduction of nucleic acid based techniques into microbial ecology has allowed identification and characterization of unculturable microbial communities. The extraction and analysis of total microbial community DNA from soil is useful in several ways such as it provides insight in the prevalence of specific genes in microbial communities in the soil ecosystem, resulting in better understanding of natural selection and in describing microbial communities in terms of their population structure of both culturable and non culturable cells abundant in soil. To detect and monitor microorganisms in these situations an efficient extraction of DNA is a prerequisite to support polymerase chain reaction(PCR). Various protocols are available to isolate DNA from different kinds of soils (Smalla et al. 1993; Volossiouk et al. 1995; Zhou et al. 1996; Clegg et al. 1997) but there are few reports on extraction of soil DNA from arid soils (Kuske et al. 1997; Wechter et al. 2003). Application of PCR to selectively amplify 16S ribosomal RNA (rRNA) genes from DNA isolated directly from the environmental samples has made possible to assess the diversity of microbes in a wide range of habitats (Hugenholtz et al. 1998). The use of denaturing gradient gel electrophoresis (DGGE) to separate mixed PCR products generated from the environmental samples, offers a culture-independent way for tracking dominant bacterial populations in space and time (Muyzer et al. 1993). Optimization of this technique has been performed using different parameters like DGGE primer designing (Wu et al. 1998), gel composition and electrophoretic conditions (Hayes et al. 1999), comparison of different hypervariable regions for generating fingerprints of microbial communities (Yu and Morrison, 2004), a double or nested PCR approach for improving the sensitivity of detection (Dar et al. 2005) and the efficiency of various different methods of DNA extraction and purification from soil samples for improved analysis at community levels (Niemi et al. 2001; Costa et al. 2004). In this study we have optimized the DNA extraction protocol, at small scale level for the arid zone soil samples. To perform the PCR-DGGE based community analysis, universal bacterial primers (Lane, 1991; Muyzer et al. 1993) were used. We have also evaluated the effect of change in template concentration in DGGE banding patterns. This step could help in analyzing the microbial communities in environmental samples with greater detection efficiency. The area selected for the present study was Western sandy
plain sub-region, one of the agro-ecological zone of North Western hot arid
region of
Soil DNA was extracted in to TENS buffer. Briefly, The primers (BioServe Biotech.
Ind. Ltd.) used in the present study were the universal primers conserved
for the V3 region of bacterial 16S rRNA gene, PRBA The DGGE was carried out using a DcodeTM Universal
Mutation Detection system (Bio-Rad) with
modifications in the procedure as described (Nakatsu et al. 2000).
Briefly, PCR products were resolved on 8% (w/v) polyacrylamide gels in 0.5
X TAE using denaturing gradients ranging from 40 to 55% (where 100% denaturant
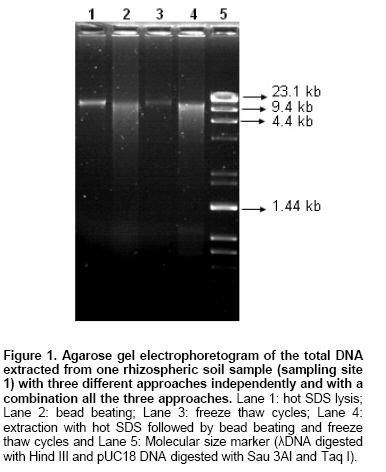
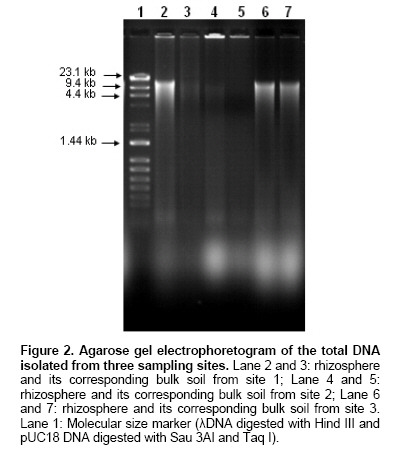
contains Rhizosphere soil samples and their respective bulk soil samples were collected from three different agro ecological sub zones. In our study the primary aim was to successfully isolate a high molecular weight DNA from the indigenous bacterial communities present in the rhizospheric soils from hot arid zones. Indigenous bacterial populations are more difficult to lyse than the seeded bacteria in the soil (Zhou et al. 1996). Hot SDS treatment, freeze thaw cycles and mechanical homogenization (bead beating) were also evaluated individually as the three techniques, to isolate the DNA from arid zone soil samples. All these techniques were first tested for their feasibility to isolate DNA from soil samples of one site (sampling site no. 1). Figure 1 shows the effect of four different DNA extraction approaches and the increase in the yield of DNA when a combined approach was used in the experiment. We found that each of these techniques were having their own advantages and disadvantages e.g. the molecular weight was higher and the quantity of the sheared fragments were low in case of samples treated with either hot SDS or freeze-thaw cycles alone, but in these treatments the yield was, in general, low and medium in all samples. Hot SDS and freeze thaw cycle approaches failed to extract DNA in bulk soil samples from sampling site 2 whereas, bead beating and combined approach gave low and medium yields, respectively (Table 3). For increasing yield of the DNA the bead beating treatment was found effective but the loss in molecular weight and shearing effect was dominated (Figure 1). The use of bead beating has been recommended earlier for efficient cell lysis in the extraction of soil DNA (Miller et al. 1999). Hot SDS treatment and freeze thaw cycles were ineffective in rupturing Bacillus globigii endospores and Fusarium moniliforme conidia and only the bead mill disruption was found to effectively release large amounts of DNA from microbial suspensions as well as seeded sandy loam soils differing in texture, chemical composition and organic matter content (Kuske et al. 1998). Combination of hot SDS, grinding and freezing thawing the samples for much higher yields from most of the gram positive bacteria but without severe shearing have also been reported earlier (Zhou et al. 1996). In our study, we observed that combined approach of DNA extraction was found to be effective to efficiently extract reasonably high molecular weight DNA along with high yields in the samples from all the three studied sites (Table 3). The soil DNA was isolated from these samples and was electrophoretically analyzed, as shown in Figure 2. It shows that, a high molecular weight DNA can be obtained from all the soil samples. It was also observed that the yield was higher in case of all the rhizosphere soil samples as compared to their corresponding controls. This was also confirmed by spectrophotometric analysis (Table). We also used three different sizes of glass beads in a single reaction mixture to facilitate more efficient extraction from a wider range of microbial cells and spores and the similar observations have been reported earlier (Kuske et al. 1998). The absorbance ratios (260/230) for the crude DNA extracts in all samples were found low (2.0 is indicative of pure DNA; Sambrook et al. 1989) due to the presence of humic contaminants in the crude DNA preparations and which could be seen in all the samples (having a brown to light brown colour). Similar low ratios at absorbance 260/230 have been reported in other studies (Zhou et al. 1996) whereas, it has also been suggested that these absorbance ratios alone are not sufficient as a guide to purity but, the accessibility of the DNA to restriction enzyme or Taq DNA polymerase enzyme is more important for a successful PCR reaction and it could be used as an indicator of purity (Clegg et al. 1997).
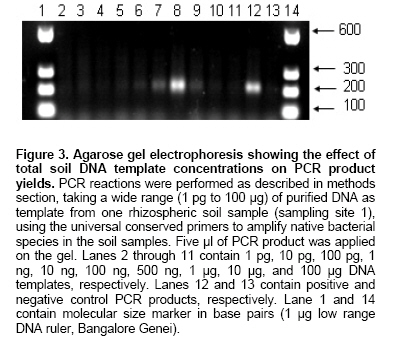
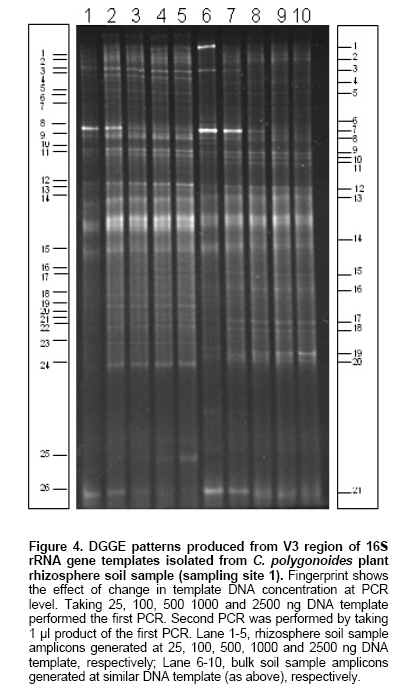
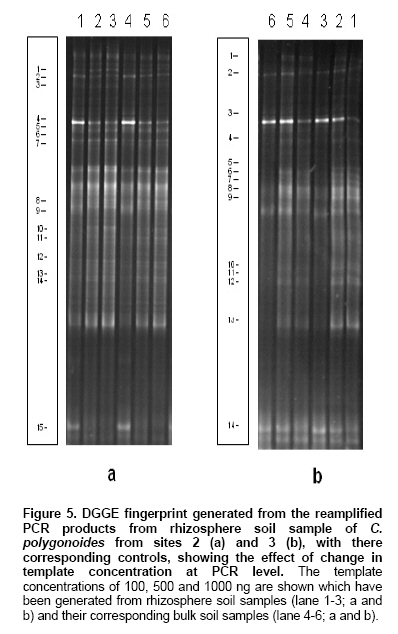
The PCR was performed using the V3 region primer sets. To find out the optimum template concentration for a PCR reaction, a wide range of DNA templates were used (1 pg to 100 µg). Figure 3 represents the optimization of amount of template for maximum amplified product. When the concentration of the template DNA was less than 10 ng no amplified product was detected. We observed that to initiate PCR reaction an optimum concentration of template DNA is needed, below this optimum concentration, the PCR reaction could not be initiated which was observed by low amplified product formation. At higher concentration a similar effect was noticed which could be due to the inhibitory effect of template DNA. Here, our results are not completely in agreement with those reported earlier (Kuske et al. 1998), where recommended template concentrations are 100 pg to 1 ng per reaction for maximum PCR product yield whereas, in our experiments it was in the range of 100 ng to 1 µg with maximum at 500 ng. This difference in optimization might be due to the differences in the starting soil samples or the differences in the PCR primers. It indicates that, quantification of the extracted soil DNA and its subsequent utilization for determination of the optimum template DNA concentration required for PCR initiation is a critical step. The above-optimized protocol was successfully used for the amplification of V3 region of 16S rRNA gene with all the samples, which could be further utilized for rhizosphere community analysis in case of the studied area. The PCR products obtained as above were loaded in a DGGE gel to reveal the diversity of bacterial species in the samples. It was observed that these products were not well resolved in a DGGE gel with a linear gradient of 40-55% (data not shown). To enhance the detection limit and also to increase the PCR product concentration, reamplification of the first PCR product was performed. Double or nested PCR protocols have been used before to improve the sensitivity of detection in DGGE based analysis of microbial community (el Fantroussi et al. 1997; Heuer and Smalla, 1997; Levesque et al. 1997). The capability of nested PCR approach for detecting low copy number of D. tiedjei in an anaerobic microbial reductive dechlorination activity under microcosms study has been shown clearly (el Fantroussi et al. 1997). They detected weak signals in the first round PCR, which improved in the second round of PCR. A recent report (Dar et al. 2005) reveals that a three step nested PCR-DGGE approach can be used successfully to study the diversity of sulphate reducing bacteria (SRB) with high resolution in samples from mixed microbial communities containing SRB in low numbers. We have not performed the nested PCR rather, a second PCR was done to enhance the signals using the same primer set as used in the first PCR. This enhanced detection signals (Figure 4 and Figure 5) in second round of PCR might be due to the first round of PCR which resulted in the amplification of sufficient amount of products even from the groups present in low numbers, and the dilution of inhibitory substances such as humic substances present in the sample. In arid zones, the rhizosphere is an important site where maximum microbial activity could be seen, since it provides carbon substrates in nutritionally poor soils (Bhatnagar and Bhatnagar, 2005). In our study we observed positive rhizosphere effect in the samples collected from one site only (sampling site 1), Figure 4. Whereas, in the samples from other two sites we have not seen such type of differences, Figure 5. These variations could be due to the differences in the soil DNA extraction protocol and the type of soil along with testing conditions and environmental conditions (Normander and Prosser, 2000; Duineveld et al. 2001; Smalla et al. 2001). Further, to test the effect of different template concentrations on DGGE banding pattern, the first PCR was done applying five different concentrations of template DNA (25 ng to 2500 ng) instead of single/optimal concentration (500 ng). When the second PCR was performed (using the products of first round PCR) and the products were loaded on the DGGE gel, enhancement in the number of bands was observed (Figure 4). These patterns were found reproducible when gels were run on several occasions and from different sets of DNA extractions and PCR reactions from the same batch. By varying the template concentrations at first round of PCR we have detected differences in intensity of the same bands (Figure 4; lane 1-5 and 6-10) when all the five template concentrations were applied in the gel, within a sample. During analyzing the gel image we found that there were some bands which were more distinguishable at lower template concentrations (band numbers 8 and 26, lane 1-5). But some of the bands were more distinguishable at higher concentrations of template (band numbers 1, 2 and 25, lane 1-5). In case of control samples (lane 6-10) too, a similar type of phenomenon was present. The band numbers 1, 3, 7 and 21 were more observable at the lower template concentrations whereas, band numbers 19 and 20 were more prominent at the higher template concentrations. Similar observations were also made with the profiles generated from other two sampling sites and the change at different levels of amplicons generation has been shown in Figure 5 a and b(only the three concentrations have been shown instead of five). The technique of DGGE uses gene fragments amplified from a community, but copy numbers of rRNA genes vary among individual cells. We cannot optimize the template concentration for each individual community member in one PCR reaction. Thus, DGGE banding patterns are expected to represent dominant community members, including species which constitute greater than 1% of the total community (Muyzer, 1999). In our study we produced the PCR amplicons at five different levels and when they were loaded on the gel, almost all produced a different banding pattern (differences in the intensity of some bands in different lanes). The extremely low template concentration amplicons were showing some prominent bands (Figure 4 and Figure 5), which were either absent or not the prominent ones in the optimum range. This difference might be due to the very high template concentration (inhibitory to PCR) of those species. Similarly, the amplicons generated by higher concentrations of template, also showed some bands, which were either absent or not the prominent ones in the optimum range. This shifting of the bands might be due to the very low template concentrations (low to initiate the PCR reaction) of those species. The DGGE detects the major constituents of a community, overlooking the less abundant but potentially very important species. By varying the concentration of template DNA at first PCR level, we have visualized the species, which are unable to detect even at the optimized PCR conditions, particularly the less abundant ones. The optimization of this highly valuable technique of DGGE has been achieved earlier by varying the different parameters as discussed earlier (Wu et al. 1998; Hayes et al. 1999; Niemi et al. 2001; Yu and Morrison, 2004; Costa et al. 2004). We have made an attempt in this direction for further improvement, in the application of the technique of PCR-DGGE in the area of microbial diversity analysis with more precision. The results presented here demonstrate that above method has been found satisfactory for the extraction of total community DNA from the soils of desert regions. It has also been found that sensitivity level of fingerprints generated after first round PCR was low. When the second round PCR was carried out and analyzed by DGGE, the detection limit was greatly enhanced. This is most likely due to an increase in the concentration of amplified product and decrease in the contaminant level. Performing PCR-DGGE at different concentration of template DNA (below and above optimized), we have visualized an increased separation of bands, possibly representing low abundant species which were not clear at single optimized concentration of DNA (500 ng) in PCR. References
Note: Electronic Journal of Biotechnology is not responsible if on-line references cited on manuscripts are not available any more after the date of publication. Supported by UNESCO / MIRCEN network © 2007 by Pontificia Universidad Católica de Valparaíso -- Chile The following images related to this document are available:Photo images[ej07038f3.jpg] [ej07038f2.jpg] [ej07038f5.jpg] [ej07038f1.jpg] [ej07038f4.jpg] | ||||||||||||||||||||||||||||||||||||||||||||||||||||||||||||||||||||||||||||||||||||||||||||||||||||||||||||||||||
| |||||||||
