 |
| About Bioline | All Journals | Testimonials | Membership | News |
|
||||||
|
||||||
Electronic Journal of Biotechnology, Vol. 10, No. 4, October 15, 2007, pg. 570-581 Inter simple sequence repeats separate efficiently hemp from marijuana (Cannabis sativa L.) Erdogan E. Hakki*1,Seyit A. Kayis2 ,Emine Pinarkara3 ,Ayla Sag4 1Department
of
Field
Crops
Faculty
of
Agriculture
Selcuk
University
42079,
Campus,
Konya-Turkey
Tel:
90
332
223
28
63
Fax:
90
332
241
01
08
E-mail: eehakki@selcuk.edu.tr *Corresponding author Financial support: Research grants from Turkish State Planning Organization (YUUP-DPT2004K120750) and The Scientific and Technical Research Council of Turkey (TUBITAK-Kariyer-104O547) and that of The Scientific Research Coordination Center of Selcuk University (BAP-06701059) are gratefully acknowledged. Cannabis sativa L. is a multiple-use plant that provides raw material for the production of seed oil, natural fiber for textiles, automotive and pulp industries. It has also been used in insulating boards, ropes, varnishes, animal feed, and as medicinal agents. Cannabis has potential to be used for phytoremediation: however, its cultivation is strictly controlled due to its psychoactive nature and usage in producing drugs such as marijuana, and hashish. In this study, psychoactive type Cannabis samples, which were seized from 23 different locations of Turkey, and nine hemp type Cannabis accessions, as well as an unknown accession were used. Our interest was to identify the genetic relatedness of the seized samples and to separate drug and hemp type plants. Inter Simple Sequence Repeats (ISSRs) were employed for analysis based on single plant material (SET1) and bulked samples of them (SET2). Data was analysed via cluster analysis and principal coordinate analysis (PCoA). PCoA analyses, by using SET1 and SET2, were able to efficiently discriminate the seized samples from the fiber type accessions. However, separation of the plants was not clear via unweighted pair-group method using arithmetic average (UPGMA) dendogram in SET1, while they were clearly separated in SET2. Hemp type accessions showed high levels of variation compared to drug type Cannabis both in SET1 and SET2. Keywords: Cannabis sativa, cluster analysis, hemp, ISSR, marijuana, principle coordinate analysis.
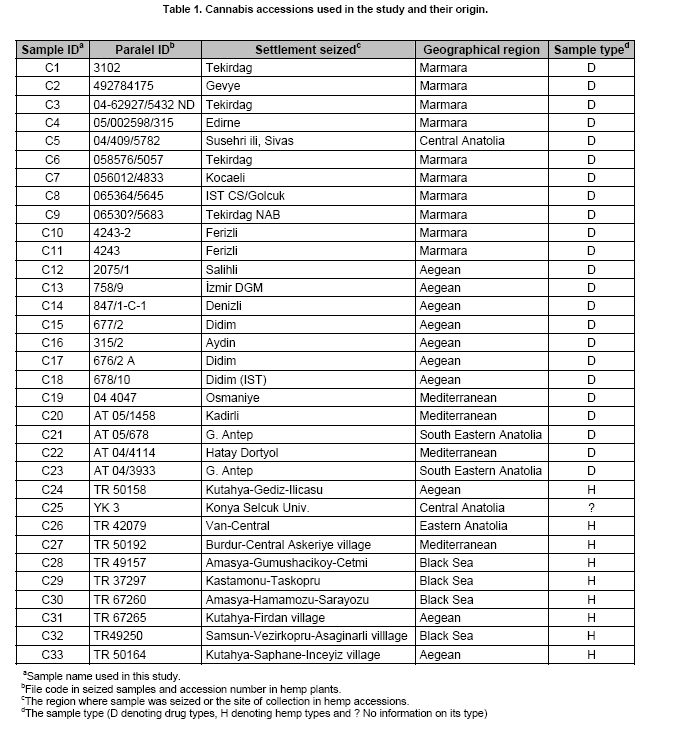
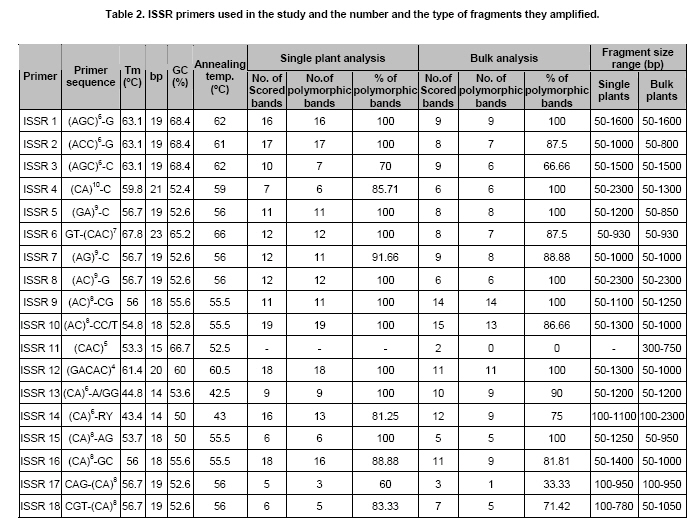
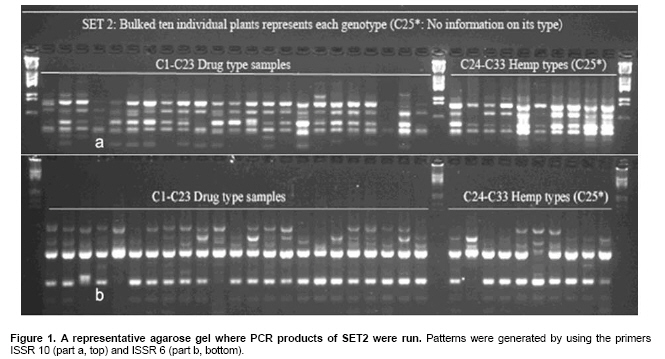
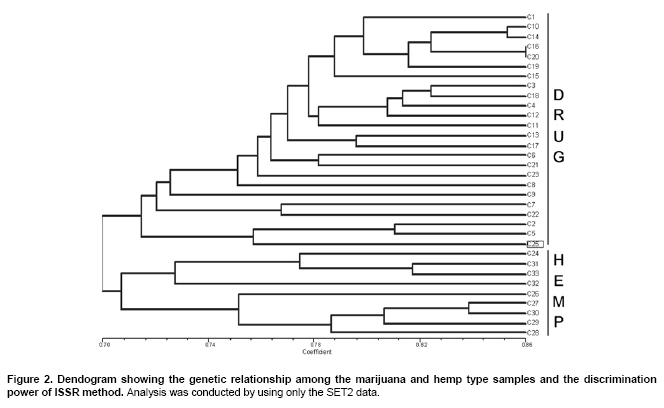
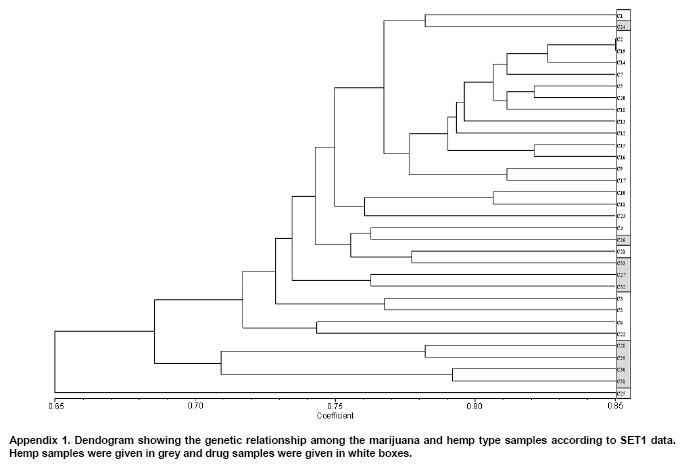
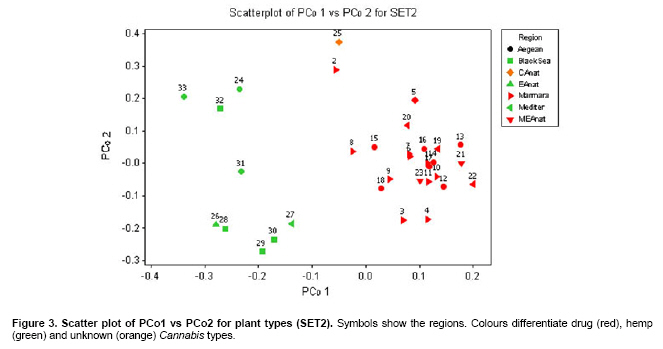
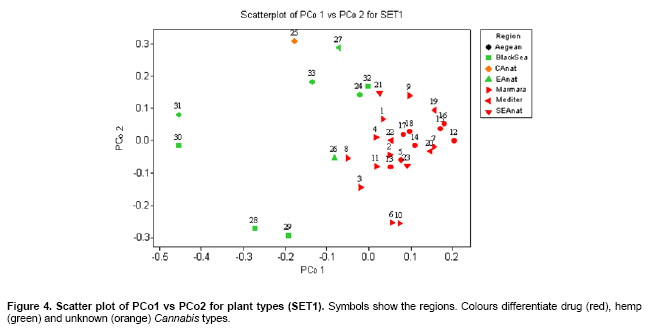
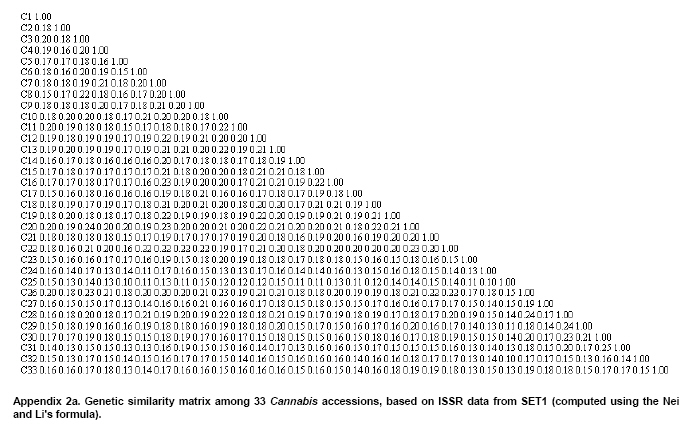
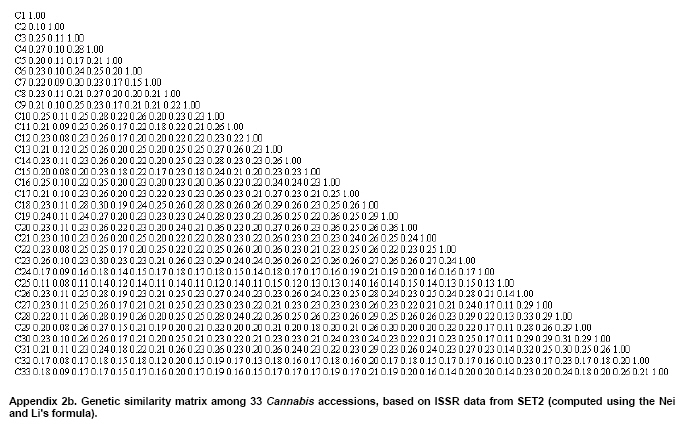
Cannabis sativa L. is a plant that provides food and oil from its seeds, fiber for rope, fabric from its stems, and psychoactive drugs from its flowers and leaves. Hemp seeds have high levels of oil (up to 35%), which are rich in linoleic acid (18:2 omega-6; n6) and alpha-linolenic acid (18:3 omega-3; n3), that are essential dietary fatty acids. Furthermore, with their ratio (n6/n3) being somewhere around 2:1 to 3:1, it resembles traditional Mediterranean diets, where the incidence of coronary heart disease is known to be very low (Callaway, 2004). Hemp seeds oil can also be used for fuel and as raw material for plastics as well as feed for livestock or as a fertilizer (Karus and Vogt, 2004). Hemp cultivation is considered as an environmental friendly activity that can support sustainable agriculture. It has the potential to be used in phytoremediation to remove heavy metal contaminants from the soil. Additionally, it can be used to prevent soil erosion due to long tap root development, while improving soil by means of crop in rotation (Ranalli and Venturi, 2004). Beside the economical properties, mentioned above, some varieties of Cannabis have psychoactive potency as well. Cannabis plants that contain low Δ9-tetrahydrocannabinol (THC) content, a low THC:Cannabidiol (CBD) ratio and are cultivated for fiber and/or achenes (e.g. seeds) are called hemp. On the other hand, Cannabis plants that have high THC content, high THC:CBD ratio and are used for their psychoactive potency are known as marijuana (Alghanim and Almirall, 2003; Elsohly and Slade, 2005; Hillig, 2005). For hemp, European Union (EU) has assigned the upper levels of THC and CBD to THC ratio as 0.2% and 2, respectively. Cannabis plant was used as a fibre source during the last three centuries. However, because of its potential use as a drug, its cultivation was either ceased (in North America as well as other countries such as Turkey), or limited (in Europe) due to strict regulations. In addition, with the large production of cotton and development of synthetic material, its farming was reduced. On the other hand, with the help of the EU subsidies, Cannabis was rediscovered in 1990's with novel applications (such as automotive industry, insulation mats for construction sector etc.). During this time, molecular techniques found wide applications in many plant species for different purposes such as genetic characterization and/or marker assisted selection. Molecular studies were well-accepted also in Cannabis research. In a study conducted on the molecular level, the genetic diversity of C. sativa cultivars/accessions from 5 European countries, including Italy, that once had a fruitful breeding and selection program of Cannabis, and one accession from Korea were assessed and high levels of polymorphism was observed (Faeti et al. 1996). Gillan et al. (1995) reported the differentiation of C. sativa samples with the use of RAPDs when HPLC analysis was inefficient. In a RAPD assay conducted with 51 C. sativa samples, 43 of which were Australian samples and 8 were from Papua-New Guinea, Jagadish et al. (1996) were able to distinguish between the samples from distinct sources. Genetic analysis using RAPD and restriction fragment length polymorphism (RFLP) methods in combination were also found to be useful in distinguishing between drug type, fiber type and intermediate drug type strains (Shirota et al. 1998). In a very recent study conducted by Datwyler and Weiblen (2006), it was reported that it was possible to discriminate illegal, potent marijuana cultivars from hemp plants by using AFLP markers. In that study, three hemp populations were also distinguished efficiently by principal coordinates analysis (PCoA). In a preliminary work conducted with three strains of C. sativa from different sources, Kojoma et al. (2002) reported that different samples were identified by means of inter simple sequence repeat (ISSR). ISSR is a technique offering the simplicity of RAPDs with an increased level of reliability. It involves PCR amplification of regions between adjacent, inversely oriented microsatellites using a single simple sequence repeat primer. The use of the tandem repeat motifs of di-, tri-, or tetranucleotides that are abundant in all eukaryotic genomes produces a high number of polymorphic fragments, especially in plants (Hamada et al. 1982). Since it is simple, fast, cost-effective, highly discriminant and highly reliable, in recent studies, it is widely applied in plant genetic analyses (Liu and Wendel, 2001; Reddy et al. 2002; Arnau et al. 2003; Galvan et al. 2003; Vijayan and Chatterjee, 2003). The objectives of the present study are: (1) to analyze the high number of seized Cannabis samples together with hemp plants by means of ISSR, a procedure simple enough to be adapted by every lab with the basic molecular biology knowledge and infrastructure (2) to compare two different approaches (in the first, a single plant represents an accession and in the second, a set of ten different plants of the same accession bulked equally represent the specific accession) for discriminating hemp and marijuana type plants via their accessions (3) to obtain information on the genetic variation of both groups that will be helpful for breeding studies and forensic investigations in order to support drug enforcement efforts by acquiring useful information on the sources and distribution networks of these illicit substances. In this study, psychoactive Cannabis samples were seized from 23 different locations (C1-C23) representing three geographically distinct and problematic areas of Turkey (South and West Coastal Regions with the exception of C5 from Central Anatolia), namely Mediterranean, Aegean and Marmara. Hemp type Cannabis samples (9 accessions; C24, C26-C33) were obtained from the Aegean Agricultural Research Institute, Izmir and from a local population (one accession; C25) from Konya Selcuk University, Faculty of Agriculture Seed Stocks. No information was available on psychoactive nature of accession C25. All the information relevant to the seized samples and accessions are shown in Table 1. Ten seeds were planted from each accession to produce material for DNA extraction. Plants were grown in a fully automated greenhouse. Leaves collected from three week old seedlings were shock-frozen in liquid nitrogen and stored at -80ºC until DNA isolation was performed. DNAs were extracted individually from a total of 330 samples. Total DNAs of the samples were extracted using a standard 2X CTAB protocol with minor modifications (Rogers and Bendich, 1988). For each accession, 100 mg of leaf sample from 10 different plants were used and DNAs were isolated individually. After concentrations were determined, by an Eppendorf BioPhotometer, sample DNAs were diluted to the working concentration of 20 ng/µL. In this study, 50 ISSR primers were used for initial screening. Out of the 50 primers, 18 of them that gave the most informative patterns (in terms of repeatability, scorability and the ability to distinguish between varieties) were selected for identification. The selected 18 primers were 14-23-mers based on various di- tri- or pentanucleotide SSR repeats. They were anchored at the 5`end or 3`end, by zero nucleotide or by one to three partially degenerated selective nucleotides. PCR amplification of the DNA with ISSR primers Each reaction contained 2.0 mM MgCl2; 10 mM Tris-HCl (pH 8.8); 50 mM KCl; 0.8% Nonidet P40; 200 mM of each of the dNTPs; 0.5 µM primer; 20 ng DNA template and 0.4 units of Taq DNA Polymerase (Fermentas Life Sciences) in a final reaction volume of 25 µl. After a pre-denaturation step of 3 min at 94ºC, amplification reactions were cycled 35 times at 94ºC for 1 min, at annealing temperature (Table 2) for 50 sec and 72ºC for 1 min in Eppendorf Mastercycler gradient thermocycler. A final extension was allowed for 10 min at 72ºC. Upon completion of the reaction, amplified products were loaded onto a 2.0% agarose/1x Tris-Borate EDTA gel and electrophoresed at 4 V/cm. Many factors of PCR amplification influence pattern quality. MgCl2 used at final concentration of 2.0 mM was generally found to generate bands of high intensity with minimum background. However, in the PCR of two primers (ISSR 9 and 10), 2.5 mM MgCl2 concentration was found to produce better banding pattern. Thus, conditions were optimised for every primer. Template DNA concentration was also found to influence band intensity. From 5, 10, 20 and 50 ng DNA concentrations tested, 20 ng gave the best amplification products. Primer concentration of 0.5 µM resulted in higher number of bands as compared that of 0.3 µM. This was especially effective in the lower weight area. In the ISSR assay, two sets of PCR amplifications were constituted. In the first set (SET1), every accession was represented by a randomly selected single plant DNA. In the second set (SET2), a total of ten individual plants represented each accession (the one individual used in the first set was also included). Every primer was amplified for the two sets simultaneously. Then the resultant products were run in agarose gel and evaluated (Figure 1). Amplifications were repeated at least twice (in different time periods) for each primer, using the same reagents and procedure. Each DNA fragment generated was treated as a separate character and scored as a discrete variable, using 1 to indicate presence, and 0 for absence. Accordingly, a rectangular binary data matrix was obtained and statistical analysis was performed using the NTSYS-pc (Rohlf, 1992) statistical package. A pairwise similarity matrix was generated by means of simple matching coefficient (via SIMQUAL procedure of NTSYS-pc) and unweighted pair-group method using arithmetic average (UPGMA). Cluster analysis was performed (via SAHN procedure of NTSYS-pc) to develop a dendogram. Then, PCoA was performed using a batch mode of NTSYS-pc to show the inter-relationship among the samples both for SET1 and SET2. A matrix comparison of Mantel test (Mantel, 1967), for the correspondence of the similarity matrices of SET1 and SET2, was performed via the MXCOMP procedure of NTSYS-pc. In addition, a genetic similarity matrix was calculated according to Nei and Li (1979). ISSR amplification and analysis The GC contents of the selected ISSR primers used in this study were all 50% or above (up to 68.4%) and the annealing temperatures used were generally above 55ºC. They resulted in a number of polymorphic fragments both in fiber type and drug type plant DNAs (Figure 1). However, the number of fragments generated from a single plant set was higher in almost all of the primers used. Total number of bands scored in SET2 was 153, 86.9% of which were polymorphic. A total of 205 fragments were scored in SET1, of which 192 were polymorphic (93.7%). This was attributed to the relatively high concentration of the DNA coming from an individual plant sample. While the total content of DNA in both of the sets was 20 ng, contribution of every individual in the bulked sample was only 2 ng. Hence, the partially faint bands observed in the SET1 were repressed and invisible in SET2 (Bulked set) due to the concentration effect. However, using bulked samples resulted in much more consistant and reliable amplifications due to the fact that the sharper bands supplied by every individual always were scored. Results from statistical analysis of genotypic data Results from PCoA of ISSR marker accessions by using SET1 and SET2 showed that it is possible to discriminate efficiently the seized samples from the fiber type accessions. However, discrimination of the seized marijuana samples from the fiber type accessions was better with SET2. Separation of hemp and drug type Cannabis was not clear via UPGMA dendogram in SET1, while they were separated clearly in SET2. The genetic relationships among Cannabis sativa L. accessions, in SET2, are presented in a dendogram (Figure 2). All accessions were clearly grouped into two major branches. However, similarity of the two main groups was also high (about 70%) based on simple matching similarity index. C25 accession, which is the population obtained from the Selcuk University Faculty of Agriculture seed stocks, was grouped into the drug type of Cannabis sativa L. in SET2. The dendogram generated via SET1 data (Appendix 1) was inefficient in discriminating effectively hemp and drug type plants. Related to the PCoA results, the first two dimensions of the PCo plot indicate the presence of well-separated clusters for plant types both in SET1 and SET2. However, distinction was more efficient with SET2 (Figure 3) than with SET1 (Figure 4). Hemp type accessions showed high levels of variation compared to drug type Cannabis both in SET1 and SET2. The C25 accession was separated from hemp and drug type plants in both sets; however, it was very close to drug type plants in SET2, while it was close to hemp type plants in SET1. The first two dimensions of the PCo plot for geographical regions (Figure 3 and Figure 4) were not sufficient to separate the samples clearly, but this does not necessarily mean that these samples (drug types) are unrelated. Result from matrix comparison of similarity matrices of SET1 and SET2 produced a weak correlation (r = 0.37, P = 0.99). Genetic similarity matrices, calculated from SET1 and SET2 according to Nei and Li (1979) were given in Appendix 2a. Accessions genetic distance matrix for bulked samples shows a similarity range from 0.08 to 0.33 with a mean of 0.21 (Appendix 2b). This shows that the accessions tested in this study are divergent at the DNA level. The smallest similarity value of 0.08 was observed between accession C2 and accessions C12, C15, C22, C25, C29, and C32. On the other hand, the biggest similarity of 0.33 was observed between the accessions C26 and C28. This study was conducted on two independent SETs, by using ISSR markers, which were analysed simultaneously. Complete discrimination of hemp type accessions from drug type seized samples, via both cluster and PCoA, was only possible in SET2, while the distinction in SET1 was possible only via PCoA. The reason of better separation via PCoA might be that of PCoA is a translation of dissimilarities between objects into the actual distances between objects in multidimensional space. However, in cluster analysis, once a group or cluster is formed from two or more objects, that group can not be broken later in the process. As a result, the dendogram is not a representation of all pairwise dissimilarities between objects (Legendre and Anderson, 1999). Disadvantages of cluster analysis were also stressed by Ruanet et al. (2005) and usage of artificial neural networks (ANNs) was proposed. The difference in the results between SET1 and SET2 might have resulted from a weak correlation between similarity matrices of SET1 and SET2, which resulted from matrix comparsion via the Mantel test. This might be due to the template effect, where amplification of faint fragments failed in bulked samples. Hence, more consistent bands were amplified and the specific accessions were better represented. In the analysis of SET2, all accessions were clearly clustered into two major branches in UPGMA dendogram. However, similarity of the two main groups was also high (about 70%) based on simple matching similarity index. The C25 accession was grouped into the drug type of Cannabis sativa L. in SET2. We can speculate that this sample is an intermediate type with relatively high levels of THC; however this should be confirmed with HPLC analysis. In preliminary work conducted by Kojoma et al. (2002), three strains of C. sativa from different sources reported similar results. However, we noted that their sample size was very small. We did not come across any other Cannabis study done by using ISSR genetic markers. This was the first, to our best knowledge, study where a high number of seized samples were analysed together with hemp type accessions from different geographical regions. In a study performed by Shirota et al. (1998) RAPD and RFLP methods in combination were found to be useful in distinguishing between drug type, fiber type and intermediate drug type strains. There are studies that reported the differentiation of C. sativa samples with RAPD markers (Gillan et al. 1995; Faeti et al. 1996; Jagadish et al. 1996; Hakki et al. 2003). However, the low level of reproducibility of data obtained by RAPD analysis makes this simple procedure unreliable. That is the reason RAPD markers were used to construct specific primers in a number of studies. Hence, male associated DNA sequences were generated (Sakamoto et al. 1995; Mandolino et al. 1999). AFLP was also utilized for male associated DNA sequence generation (Flachowsky et al. 2001; Peil et al. 2003). Datwyler and Weiblen (2006) reported that it was possible to discriminate illegal, potent marijuana cultivars from hemp plants via PCoA of AFLP variation. In that study, they were also able to distinguish the hemp groups very efficiently. That study was promising to help distinguishing licit cultivars from the illicit ones (due to its high forensic and agricultural utility, especially where the cultivation of industrial hemp is permitted, like Canada and Europe). However, it should be noted that their samples belong to only a small number of populations (3 hemp and 1 drug types). Microsatellites are widely used effective marker systems in crops (Hakki et al. 2001), but their utility in C. sativa remains limited due to the low number of primers available (Gilmore et al. 2003). Although microsatellite primer identification is very difficult (Hakki and Akkaya, 2000), in the long run, microsatellites are more promising. Efforts of different research groups are expected to increase the number of presently available useful polymorphic microsatellite loci in the near future (Alghanim and Almirall, 2003; Gilmore and Peakall, 2003; Hsieh et al. 2003). However, cost effectiveness, reliability, and simplicity of the ISSR are strong advantages against the complicated multistep AFLP procedures, which have been proven to be useful in separating licit from illicit Cannabis cultivars (Datwyler and Weiblen, 2006). This is especially important for breeding studies and forensic applications in the countries where industrial hemp production is permitted. In the world drug smuggling routes, Turkey is one of the most important international transit routes between the major production areas of Asia and the main targets of the drugs in Europe. Hence, the control of the plantation and trafficking in Turkey becomes even more important. The authors thank Prof. Sait Gezgin for providing the controlled greenhouse while growing the plants. We thank Dr. U. Baykal for her help with the English language and the critical reading of the manuscript.
Note: Electronic Journal of Biotechnology is not responsible if on-line references cited on manuscripts are not available any more after the date of publication. © 2007 by Pontificia Universidad Católica de Valparaíso -- Chile The following images related to this document are available:Photo images[ej07056f4.jpg] [ej07056f1.jpg] [ej07056a1.jpg] [ej07056t1.jpg] [ej07056f3.jpg] [ej07056a2a.jpg] [ej07056f2.jpg] [ej07056a2b.jpg] [ej07056t2.jpg] |
| |||||||||
