 |
| About Bioline | All Journals | Testimonials | Membership | News |
|
||||||
|
||||||
Electronic Journal of Biotechnology, Vol. 11, No. 1, January 15, 2008, pg. Ranking agro-technical methods and environmental parameters in the biodegradation of petroleum-contaminated soils in Nigeria Reginald B. Kogbara Department of Agricultural and Environmental Engineering, Rivers State University of Science and Technology, P.M.B. 5080, Port Harcourt, Nigeria, Tel: 234 803 293 0133, E-mail: regkogbara@yahoo.com Received February 20, 2007 / Accepted July 9, 2007 Code Number: ej08011 Abstract A combination of experimental cells consisting of some agro-technical methods aimed at accelerating the biodegradation of petroleum contaminated soils were evaluated in order to ascertain the relevance of these methods and the relative attention due necessary soil environmental parameters. The methods of treatment involved the variation of tilling, watering and nutrient application, plus biopile and phytoremediation treatments. In the experiments described, petroleum contamination of soils was simulated under field conditions, the remedial treatments were then utilized for clean up. Analysis of soil parameters after a six-week study period showed an increase in total heterotrophic bacteria (THB) counts across all the treatments, with THB counts increasing with increment in soil nutrient level and initial concentration of the contaminant. The total hydrocarbon content (THC) analysis, based on a performance index introduced in this study, indicated that on the average, the variation of nutrient application, tilling and watering facilitated the attenuation of THC at the rate of 429.4 mg/kg day, 653.2 mg/kg day, and 327.5 mg/kg day respectively. While the combined effect of various levels of nutrients, tiling and watering performed at the rate of 558.7 mg/kg day, biopile and phytoremediation treatments recorded 427.9 mg/kg day and 489.3 mg/kg day respectively. These results imply that though nutrient application, watering and other factors affect the biodegradation process, frequent tilling for maximum oxygen exposure is the most important factor that affects the biodegradation of petroleum-hydrocarbons in tropical soils. Keywords: bioremediation methods, performance index, phytoremediation, total hydrocarbon content.
Nature has her own way of effecting the degradation of all things over a long period, but surprisingly the most important factors or variables required in order to accelerate this natural degradation of materials mostly controlled by biological organisms are not well known. In the light of this, different positions exist on methods to speed up the biodegradation of petroleum-hydrocarbons in contaminated soils just as there are different researchers. From the nineties, there was a focus on the utilization of agro-technical methods in accelerating the biodegradation process. Studies have shown that several agro-technical methods including tilling and loosening, watering and drainage systems, and the addition of organic materials (straw, compost etc) and mineral fertilizer could decrease the contamination level by facilitating the oxidation of easily degradable petroleum components, as well as contributing to an increase in microbial activity (Rhykerd et al. 1999; Marin et al. 2005). Microbial activity in pristine soil is generally considered to be limited by the amount of available organic carbon and not by inorganic nutrients. However, a large influx of petroleum-hydrocarbons, which results during an oil spill can reverse the natural trend thus creating an environment where the availability of mineral nutrients limits biodegradation of the carbon compounds thus added. Consequently, biostimulation of indigenous microorganisms through nutrient supplementation has gained wide acceptance in bioremediation works. Several studies on the effects of biostimulation mainly by the addition of N-P-K or oleophilic fertilizers (or both) have reported positive effects on contaminant attenuation in petroleum polluted terrestrial and marine environments (Rhykerd et al. 1999; Gallego et al. 2001; Mishra et al. 2001; Vasudevan and Rajaram, 2001; Dua et al. 2002; Ouyang et al. 2005; Mohan et al. 2006). This has led to bioremediation of petroleum-hydrocarbon contaminated soils becoming an attractive method of treatment due to its advantages, which include cost effectiveness, environmental friendly nature of the process and simplicity. Hence, this study became necessary in order to assess the relevance of some bioremediation methods that have gained wide acceptance, by way of determining the importance of pertinent environmental parameters in oil biodegradation. Its object was to ascertain the relative attention due necessary soil environmental parameters and thus provide veritable knowledge on the best practices for an accelerated bioremediation. This research is highly relevant to the Niger Delta region of Nigeria, where the study took place, since frequent oil-spills arising from crude-oil exploration-and-development activities have become common experience. Its importance also extends to other regions of the world, as the findings of the study would be beneficial in decision making on remedial techniques for oil-polluted areas. The existence of bacteria within an extremely broad range of environmental conditions coupled with the ability of certain species called hydrocarbon utilizing bacteria (HUB) to degrade petroleum hydrocarbons in contaminated soils when given the right metabolic feedstock to stimulate their growth and multiplication, have been previously reported (Huy et al. 1999; Okerentugba and Ezeronye, 2003). Consequently, this informed the use of methods such as the application of different levels of tillage, nutrients and watering along side the biopile and phytoremediation treatments, since they all facilitate the stimulation of indigenous soil microbial flora. This was in line with the hypothesis that since petroleum contamination of soils of the study area has become common experience, HUB would be present in such soils and they would have acclimated to the trend. However, the biopile and phytoremediation options slightly differ in principle from the others. Phytoremediation entail the in situ use of plants and their associated microorganisms to degrade, contain or render harmless contaminants in soil or ground water (Alkorta and Garbisu, 2001). Although reports by Wiltse et al. (1998) have it that in addition to the stimulation of soil microbes the phytoremediation mechanism also involves the translocation of petroleum hydrocarbons through plants and their subsequent transpiration to the atmosphere. On the other hand, the biopile method (also referred to as enhanced composting) involve the use of piles or mounds of soil of about 50 cm depth in which contaminated soil is mixed with uncontaminated soil and spread over a large area alongside the maintenance of adequate oxygen, nutrients, moisture and pH within the piles. Therefore, it were the aims of the present study to investigate the relative utility of agro-technical methods and soil environmental parameters in the biodegradation of petroleum contaminated soils, and also to develop and propose a performance index for the evaluation of bioremediation systems. This investigation took place at the research farm of the Rivers State University of Science and Technology, Port Harcourt, Nigeria. Port Harcourt is the capital of Rivers State and economically the most important city in the Niger Delta region of Nigeria. From this region, more than 98% of Nigeria’s current economic mainstay, crude oil, is derived. The city falls within the tropical rain-forest zone, and its ambient environment has a mean annual rainfall of about 2400 mm; a mean monthly relative humidity of 85%; a mean daily minimum and maximum temperature of about 23ºC and 31.5ºC respectively (Ayotamuno et al. 2006b). The investigation involved seven options (six with treatments, and a control, which had no treatment) which had different kind of treatments. The field cells of five of the treatment options (this excludes the option with biopile treatment) extended horizontally 40 cm x 40 cm with depths of about 30 cm. The cells were such that the depth and exposed surface area of the soil, and in turn its temperature, nutrient concentration, moisture content and oxygen availability, could be measured. The cells also inhibited excess run-offs of the crude oil contaminant, which was inevitable since the study took place between the months of June and August 2005, in the open air and so exposed to the rain. Option 1 had different levels of fertilizer application, option 2 was the variation in soil oxygen levels through various rates of tillage, option 3 received different levels of water application, and option 4 had the combination of different levels of tillage, water and fertilizer application. Options 5 and 6 involved biopile and phytoremediation (using Zea mays-maize and Pennisetum purpureum-elephant grass) treatments respectively. The soil piles of option 5 were of dimension 1m x 1m. Option 7 was the control, which had no remediation treatment. Conditions of a major spill were simulated in the field by sprinkling Bonny light crude oil at the rate of 0.8 litres per 0.16 m2 of soil for options 1-4, 6 and 7, while option 5 had 0.8 litres of crude oil per square metre of soil. The cells were left undisturbed (i.e. in the open air) for three days to assume the time taken for contingency plans before clean up and to allow for infiltration and percolation of the contaminant. All treatment applications commenced after the three-day period. Each of the six treatment options had five constituent cells (each with three replications) to which were applied different levels of the treatments, while the control (option 7) had just three replications. The objective of the variation in treatment levels was to investigate the most appropriate application level in each treatment option and then compare the different options (agro-technical methods) using the best application levels. The set up of the treatment cells were as follows: Option 1. The five constituent cells in this option received 50 g, 75 g, 100 g, 150 g and 200 g of 20-10-10 NPK fertilizer which was applied twice during the six-week study period. Fertilizer application took place three days after soil contamination, and later two weeks after the first application. Option 2. The variations in tillage of the constituent cells were one day per week, three days in a week, five days in a week, once daily and twice daily. Option 3. Watering was done using sprinklers at the rate of 0.5, 0.75, 1, 1.5, and 2 litres, once every three days throughout the study period. Option 4. The various cells had the admixture of corresponding levels of the treatments in options 1, 2 and 3 above. In other words, the first cell received 50 g of fertilizer, 0.5 litre of water and one day per week tillage, the second had 75 g of fertilizer, 0.75 litres of water and three day-per week-tillage, and so on. The application rates of the various parameters were the same as obtained in the corresponding level of the cells of options 1, 2 and 3. The choice of the different combinations of nutrient application, tillage and watering was an arbitrary decision with the aim of evaluating any likely advantage a combination of the three treatment variants may have over the use of an individual treatment method. Option 5. Two of the five soil piles in this option received 50 g of fertilizer, while the other three had 100 g of fertilizer, twice during the study period. The position that the depth of a pile might affect its efficiency led to variations in the depth of the piles. Two of them had a depth of 50 cm, another two, 60 cm and the fifth pile, 55 cm. These values emanated from an arbitrary decision. The layers of the piles received oxygen supply by tilling just like other options, with cutlasses and shovels to simulate the action of tillage machinery when on a field scale. The soil piles received one litre of water twice a week and high-density polyethylene linings formed the cover of the top and bases of the piles in order to facilitate control of the moisture level within the pile. Option 6. Two of the constituent cells had Zea mays (maize) plants at different populations (one had three stands, the other five stands), and two others had Pennisetum purpureum (elephant grass) plants (one had three stands, the other five stands). The remaining cell had a combination of both plants (three stands of maize plus two stands of elephant grass) grown on them. Previous use of these plants for phytoremediation has shown them to be good agents of hydrocarbon degradation (Ayotamuno et al. 2006a). In the course of the experiments, the cells received a fertilizer solution and there was no tilling because of the plants grown on the cells. It is worthy of mention that several studies have demonstrated the necessity of nutrients and oxygen in bioremediation of oil-contaminated soils hence all the treatment cells were supplied with nutrients (fertilizers) and exposed to oxygen through tillage (except phytoremediation cells which contained plants) in order to facilitate their remediation. With respect to the above, the application rates were constant for options in which the particular parameter (nutrient or oxygen exposure) had no variation. Thus, a total of 100 g of 20-10-10 NPK fertilizer was applied to the constituent cells in the various relevant options throughout the study period in split applications of 50 g, twice at an interval of two weeks. Similarly, all relevant options were tilled two days per week. Soil samples were obtained at set periods for analysis, using a hand-dug soil auger. Different random spots were augured and bulked together to form composite samples; these were placed in well-labelled polyethylene bags. The samples for total hydrocarbon content (THC) measurements were placed in 1-litre glass bottles and sealed with aluminium foil. This procedure was undertaken three times to form three replicates. The bags and glass bottles were immediately transferred to the laboratory for analysis. Measures were made of pertinent soil characteristics using methods described in relevant literatures (Black et al. 1979; Vasudevan and Rajaram, 2001; Del Panno et al. 2005; Garrity, 2005). Particle size distribution for soil texture determination was carried out by the Bouyoucous hydrometer method. The pH was determined using an EIL Model 720 pH meter by dipping the electrode into a 1:2.5 soil: water suspension that has been stirred and allowed to equilibrate for about 1 hr. The Electrical conductivity was determined on the filtrate obtained after filtering the suspension used for pH determination. The oven drying method was employed for moisture content determination. Organic carbon was determined by the wet combustion method, while total nitrogen determination was done in Tecator digestion flasks by adding a catalyst mixture containing selenium, CuSO4 and Na2SO4 alongside concentrated analytical sulphuric acid. An auto analyser was then used to determine the percentage nitrogen content. Bacterial numbers were estimated by plating on nutrient agar medium (Tryptic Soy agar) and the colony forming units counted after 24 hrs of incubation at 30ºC. All determinations were carried out in triplicate. Identification of the bacterial colonies isolated in the plate-count medium was achieved by direct microscopic observations with a Nikon phase-contrast microscope and through a series of biochemical tests (including catalase, oxidase, fermentation of glucose, Gram stain, etc), growth experiments, morphological features of colonies and cells, and carbon utilization patterns. Gram-negative non-fermentative glucose isolates were analysed by the bioMerieux API-20 NE identification system. These were used as a basis for classical biochemical determination of the isolates in accordance with methods described in Bergey’s Manual of Systematic Bacteriology (Garrity, 2005). The analytical procedure for soil THC involved the use of toluene to extract the hydrocarbon content, the absorbance of the extract thus obtained was then determined at 420 nm in a Spectronic 70 spectrophotometer. Thereafter, the THC of the soils was determined from standard curves of known concentrations of petroleum fractions. Details of this method of analysis are contained in the work of Osuji et al. (2006). Statistical analysis involved simple descriptive and univariate summary statistics such as mean, standard deviation and percentage. As soil THC was the basic index used for evaluating the effectiveness of the various agro-technical methods, the THC results were subjected to analysis of variance (ANOVA) following the procedure described by Frank and Althoen (1994). The analysis was used to compare the variability in THC with time in the various options (since biodegradation is a time dependent process) due to the treatment applications. Soil physicochemical parameters The soil parameters that were used to characterise the background condition of the field sites are presented in Table 1. The particle size analysis showed that the soil texture ranged from silty clay to silty clay loam, although the experimental cells were all situated within a given area of about 1500 square metres. This is inevitable as soil properties are likely to vary greatly from one region to another and can vary greatly within the same region spatially and with depth. This in turn was responsible for the variation in other physicochemical properties. There is no doubt that this has some effect on the results obtained, and the influence of the variations cannot be discarded, especially as a high interaction between the contaminant and the soil matrix is an important factor that affects oil biodegradation (with respect to variation in clay content). This implies that the contaminant is bound to percolate in different ways in soils with different clay contents. However, this was considered one of certain limitations encountered when dealing with soils on a field scale, and it is a common sight on large-scale operations, which may not be of great significance to distort the object of the study; hence, a note is given on that in the conclusion. Moreover, in assessing the performance of the treatment options all analysis was made with reference to the initial contaminant concentration in each treatment cell.
The effects of the agro-technical methods on other parameters within the soil environment such as moisture content, total nitrogen and organic carbon can be seen from the values of the essential soil characteristics used for analysis in this study shown in Table 2, Table 3, Table 4, Table 5, Table 6 and Table 7. The moisture content did not vary according to a distinct pattern in many of the options, but in options 3 and 4 in which watering was carried out continuously it increased with remediation period. On the average level, moisture content increased in all the cells and options as remediation period progressed. This is expected because the experiment took place during the rainy season. There were decreases in soil organic carbon in all the options thus indicating contaminant attenuation. In a related development, the total nitrogen of all the treatment cells and the control decreased throughout the study period. This is contrary to expectation that it would naturally increase due to the application of the nitrogenous fertilizer. Ayotamuno et al. (2006b) reported the possibility for such an enormous loss of nitrogen during biodegradation, which could be linked with widely occurring biochemical reduction reactions brought about by denitrifying bacteria such as Pseudomonas, Bacillus and Micrococcus, especially when localized micro sites of low oxygen exist in the centre of soil aggregates. The findings of the microbiological analysis (from the growth experiments, biochemical tests, morphological analyses and the like previously mentioned) revealed that the HUB population in the soils included such denitrifying bacteria, which could have induced the trend.
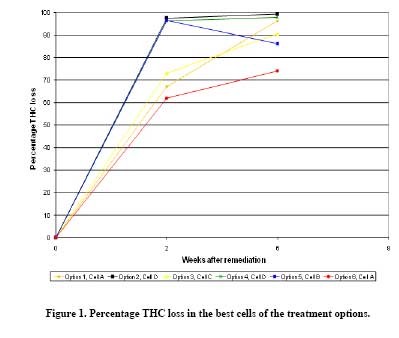
Microbiological characteristics The results of the total heterotrophic bacterial (THB) counts showed that HUB exist in many soils of the Niger Delta area of Nigeria and the presence of large amounts of the contaminant activates them to metabolize the contaminant. The last three columns of Table 2, Table 3, Table 4, Table 5, Table 6, Table 7 and Table 8 shows a general increase in bacterial numbers as remediation treatments progressed. An exception to this was the THB count of the control (Option 7) (Table 8) which increased after the first two weeks (from 12.6 x 10⁵ to 19.9 x 10⁵ Cfu/ml) and dropped at the end of the six-week period (to 19.4 x 10⁵ Cfu/ml). This could be attributed to unfavourable environmental conditions. The Phytoremediation option recorded significantly large numbers of THB (Table 7, last three columns) relative to other options especially after six weeks of remediation. This confirmed the findings of previous studies that phytoremediation treatments are characterised by relatively large bacterial numbers as the plant root zone (rhizosphere) has significantly larger numbers of micro organisms than bulk soil (i.e. soils which do not have plants grown on them). In the overall analysis, it could be inferred from the results that THB counts increased in proportion to the initial concentration of the contaminant and the nutrient status of the soil. Gallego et al. (2001) had previously reported a similar observation. The authors had it that once petroleum degrading bacteria are adhered to the surface of hydrocarbons they begin to multiply and thus the growth can become limited by the surface available. Bacterial identification tests and experiments revealed that the HUB types involved in the degradation included strains of Acinetobacter, Alkaligenes,Anthrobacter, Bacillus, Corynebacterium,Enterobacter, Flavobacterium, Micrococcus, Pseudomonas and Serratia. Variations in contaminant concentration The THC analysis of the soils points to the fact that due to the bacterial status of soils of the Niger Delta region in Nigeria, any agro-technical method utilized will stimulate biodegradation, which will in due course be limited by other environmental parameters. After six weeks of remediation, the THC dropped from 18601.0 mg/kg to 156.2 mg/kg in Cell D of Option 2 which had the highest THC attenuation (Table 3). While the best cells in treatment options with the poorest THC attenuation ranged from a mean of 14823.7 mg/kg to 2703.7 mg/kg (compare Table 4, Table 6 and Table 7). Field observations and the results in Table 7 indicate that in the long run maize performed better than elephant grass in the phytoremediation experiments, while the combination of both plants had the best THC attenuation rate. At the initial stage elephant grass thrived better (see THC values in Table 7, 2 weeks after remediation) but later maize gave a better performance. On the average, the plant heights (both plants) ranged from 0.45 to 0.65 m at the end of the six-week study period. During their growth, leaf burn was experienced in both plants at the early stages but it later disappeared as the experiments progressed. Overall, the findings of this study points to the fact that combining both plants gives a better alternative in phytoremediation works due to the position that the decontamination process in that case is a synergy of the degradation patterns of both plants. Of significant interest in this study is the sudden increase in contaminant concentration (THC) in some of the treatment cells of the various treatment options and the control (option 7), between the first two weeks after remediation and the end of the six-week period. The trend was pronounced in cells in which application rates of a given treatment may be considered excessive. This was the case with option 1 (see Table 2, cells D and E), option 2 (Table 3, cell E), and option 4 (Table 5, cell E), in which the highest treatment levels recorded increases in THC. The same behaviour was exhibited by cells where the treatment level/kind were inadequate: option 3 (Table 4, cells A and B) and the use of one type of plant in the phytoremediation option (Table 7), are good examples. For the biopile option it was observed in all the soil piles (or cells) (see Table 6), while the phytoremediation option had the same situation except for cell A which had the combination of maize and elephant grass. This is unexpected as the basic source of hydrocarbon, crude oil, was applied just once. A related development was reported by Ayotamuno et al. 2006a and Ayatamuno et al. 2006b. Vance (2002) was probably one of the first researchers to have observed a similar circumstance. He concluded that the sudden increase in contaminant concentration was probably an effect induced by the high levels of bacterial activity stimulated in the hydrocarbon rich soil. The bacteria active in the biodegradation of the contaminant excrete extra cellular surfactant-like polymers during their metabolic cycle and these surfactant-like polymers mobilized the hydrocarbon contaminants to levels physical lower in the soil from which the samples had been collected. Moreover, this study has improved our understanding of the situation as a thorough analysis of the data presented in Table 2, Table 3, Table 4, Table 5, Table 6, Table 7 and Table 8 reveals that the initial enormous reduction in THC after the first two weeks of remediation and the subsequent increase in THC in the affected options may be attributed to oxygen supplies within the soil profile. This is because at the initial stage the soils contained adequate oxygen but as remediation progressed (especially amidst the rains); oxygen became limiting in the aftermath of biological utilization, as the affected options were not receiving regular tillage, thus anoxic (low oxygen) conditions resulted. The biopile option had the worst case of the trend; from the foregoing, it could be readily understood that the depth of the soil piles did not allow for easy oxygen diffusion within the soil matrix. A comparison of the results obtained in options 2 and 4 with the adversely affected options (options 5, 6 and 7) lends weight to the hypothesis that the unusual trend was caused by insufficient oxygen supply within the soil profile. This probably resulted in conditions similar to those of the anaerobic decomposition of organic materials, where certain hydrocarbon compounds like methane (CH4) could be generated and thus compass a sudden increment in the THC. Furthermore, the fact that some petroleum degrading bacteria are facultative in nature and can perform aerobic or anaerobic degradation depending on prevailing conditions could also be used to link the unusual trend with anoxic conditions in the soil. Noteworthy, is the observation that the trend in the present study and in the few occurrences previously reported was associated with field sites that experienced conditions where oxygen exposure was limited. At this point, it is pertinent to state that due to the unusual trend of variation in contaminant concentration, the usual practice of evaluating the performance of a bioremediation system based on the percentage reduction in THC, does not give a proper understanding of the effectiveness of such a system. For instance, based on percentage THC loss in the best treatment cells in the various options after the six-week study period, the treatment options performed as follows: option 1 (96.4%), option 2 (99.2%), option 3 (90.6%), option 4 (97.9%), option 5 (86.1%) and option 6 (74.0%) (Figure 1). However, a sudden increment in THC in some treatment cells introduces complexities in assessing the effectiveness of the treatment methods. In this regard, a performance index based on the average amount of contaminant degraded per unit time by a bioremediation system was developed in this study, it is hereby proposed for the evaluation of such systems. In the development of the performance index, due consideration was given to the fact that bioremediation is a time dependent process and as such it takes a longer time for a larger volume (or area dimension) of soil to be remediated than a smaller volume. Similarly, a heavily contaminated soil takes a longer time to be cleansed than does a soil with lighter contamination. Furthermore, experience from this and other bioremediation studies shows that degradation rate tends to change as the treatment period increases especially after some weeks of remediation treatment(s) when a plateau is reached in the degradation trend probably due to incomplete degradation and the formation of toxic intermediary metabolites from saturate and Polyaromatic hydrocarbon (PAH) degradation. Hence, all these make it complex to determine a suitable formula for the performance of a biodegradation system. The points outlined above, coupled with the fact that the performance of a bioremediation system is a function of the application rate(s) of several factors (like nutrient, oxygen exposure, water, soil types, etc) highlights the inadequacy of the use of percentage reduction in contaminant concentration. Although the percentage reduction in contaminant concentration gives a good idea of the extent of hydrocarbon reduction, an index, which at first sight describes the amount of hydrocarbons removed in a given time, provides a better understanding of the effectiveness of a bioremediation system. This is true especially when scale effects are considered, because such an index provides more information than one in which the amount of contaminant removed and the time taken for the removal can be known only after necessary calculations. Moreover, considering the variation in degradation trend usually experienced after some weeks of remediation treatments (already described above), it follows that a performance index that takes cognizance of the amount of contaminant degraded by a given treatment system at the stage when a plateau is reached and all other stages, gives a better description of the treatment system’s efficiency. The following relation is the mathematical expression of the performance index. PJmc = Amount of Conta min ant deg raded (mg/kg) Time takedn of the deg radiation (day) [1] This is further expressed as:
Where: P.ITHC - Performance index based on the THC (mg/kg day). Co - Initial concentration of the contaminant in the soil (mg/kg). C1, C2, C3, Cn-1, Cn - Concentrations of the contaminant at the first, second, third, (n-1)th and nth analysis, respectively, some days after remediation treatment began (mg/kg). T0,1; T1,2; T2,3; Tn-1,n - Time interval between the collection of samples for the initial concentration and first analysis, first and second analysis, second and third analysis, and (n - 1)th and nth analysis, respectively (day). n - Number of analysis carried out after the initial concentration of the contaminant has been established. Equation 2 takes cognizance of the fact that analysis for contaminant concentration may not always be done at regular intervals, hence the choice of the denominators of the equation. In addition, the performance index may be based on other measures of contaminant concentration such as Total Petroleum Hydrocarbon (TPH) and PAH. It is evident from the terms of the equation that variations in degradation trend are considered, and when the normal trend results the equation still gives a good understanding of the effectiveness of a biodegradation process. From the THC values in Table 2, Table 3, Table 4, Table 5, Table 6, Table 7 and Table 8, the treatment cells that performed best in the various options are: Cell A for option 1, Cell D for option 2, Cell C for option 3, Cell D for option 4, Cell B for option 5 and Cell A for option 6. These were then used for performance evaluation of the agro-technical methods. Based on Equation 2, the performance indexes (P.ITHC) of the treatment options are 429.4 mg/kg day for option 1, 653.2 mg/kg day for option 2 and 327.5 mg/kg day for option 3. Options 4, 5 and 6 had 558.7, 427.9 and 489.3 mg/kg day respectively. The control (which had no treatment) had a P.ITHC of 23 mg/kg day. The results of the two-way ANOVA carried out on the THC results in the six treatment options (one-way ANOVA for the Control) are shown in Table 9. The significance of the F value in the Control (option 7) implies that increase in remediation period brought about different THC values in the control. This is in line with previous observations that even without treatment oil biodegradation still take place in soils although at a very slow rate. In two of the treatment options (options 1, and 3) the row, column and interaction sources of variability were not significant at the 0.05 probability level. This implies that: there was no significant difference in the effect of remediation period on THC in the various cells, the soils did not have significantly different THC values with different levels of treatments, and that different profiles or patterns of differences were not observed across the different levels of treatment after two and six weeks of remediation. In other words, the variations in nutrient level and watering did not result in significant differences in the THC over time. The statistical analysis showed that for options in which tillage was varied (options 2 and 4) the row, column and interaction sources of variability were significant at the 0.0005 probability level (in option 4 the row source was significant at the 0.025 probability level). This highlights the position that different levels of tillage induced significantly different biodegradation rates as remediation period increased, and caused different profiles of differences after two and six weeks of treatment. Similarly, the ANOVA for the phytoremediation and biopile options also indicated significance for all sources of variability. The implication of this is that the different levels of treatments (i.e. plant population and kind of plant combination for the phytoremediation option, and depth of soil pile and amount of fertilizer applied, for the biopile option) induced significantly different THC values and resulted in different patterns of differences as remediation period increased. From the results of the performance index (P.ITHC), it is evident that agro-technical methods that maximize oxygen exposure and diffusion within the soil profile are the most relevant for soil environmental conditions similar to those of the study area. The results of the study further highlights the view that whilst it is essential for nutrient supplementation and watering to be carried out during bioremediation works, more attention should be given to an effective tillage and pulverization system which maximizes the diffusion of oxygen within the soil profile. This is supported by an observation that has become common knowledge to the ‘initiated’ that even the degradation of PAHs which are not readily biodegraded are initiated when molecular oxygen is introduced into the ring structure of the compound, thus leading to the ultimate production of intermediates that feed into the Krebs cycle. Amidst a range of conditions and inherent experimental limitations, such as differences in soil composition, and other uncontrollable factors that may have some effects on the results, it is reasonable to conclude from the findings of this study (especially a comparison of the results of options 2 and 4) that oxygen exposure is the most important factor affecting oil biodegradation. In the ranking of basic environmental parameters based on the relative attention due each, oxygen exposure is followed by nutrients; soil water plays a lesser role in comparison with both factors. This is further supported by the fact that oxygen exposure and nutrients are limiting factors that influence remediation by other treatment options. Furthermore, the study showed that phytoremediation and enhanced composting (use of biopiles) are promising technologies for tropical soils save for the fact that they require appropriate bioengineering to ensure oxygen exposure and diffusion within the soil profile. Therefore, simple methods that ensure the adequacy of oxygen and nutrients within the contaminated soil matrix are the most attractive for field-scale bioremediation operations, especially in areas with environmental conditions similar to those of the study area. Moreover, attention should be given to the utilization of optimum application levels as the results of this research indicated that biodegradation rates respond to differences in treatment application levels. The author thanks Dr. Josiah Ayotamuno, Mr. Muideen Taleat and Mr. Peter Lenu Kianen of the Department of Agricultural and Environmental Engineering, Rivers State University of Science and Technology, Port Harcourt, Nigeria for the many fruitful discussions, and for providing technical support for this study. The constructive and valuable comments of two anonymous reviewers are gratefully acknowledged.
Note: Electronic Journal of Biotechnology is not responsible if on-line references cited on manuscripts are not available any more after the date of publication. © 2008 by Pontificia Universidad Católica de Valparaíso -- Chile The following images related to this document are available:Photo images[ej08011f1.jpg] | |||||||||||||||||||||||||||||||||||||||||||||||||||||||||||||||||||||||||||||||||||||||||||||||||||||||||||||||||||||||||||||||||||||||||||||||||||||||||||||||||||||||||||||||||||||||||||||||||||||||||||||||||||||||||||||||||||||||||||||||||||||||||||||||||||||||||||||||||||||||||||||||||||||||||||||||||||||||||||||||||||||||||||||||||||||||||||||||||||||||||||||||||||||||||||||||||||||||||||||||||||||||||||||||||||||||||||||||||||||||||||||||||||||||||||||||||||||||||||||||||||||||||||||||||||||||||||||||||||||||||||||||||||||||||||||||||||||||||||||||||||||||||||||||||||||||||||||||||||||||||||||||||||||||||||||||||||||||||||||||||||||||||||||||||||||||||||||||||||||||||||||||||||||||||||||||||||||||||||||||||||||||||||||||||||||||||||||||||||||||||||||||||||||||||||||||||||||||||||||||||||||||||||||||||||||||||||||||||||||||||||||||||||||||||||||||||||||||||||||||||||||||||||||||||||||||||||||||||||||||||||||||||||||||||||||||||||||||||||||||||||
| |||||||||

